Peninsula Clean Energy Board of Directors Annual Retreat - September 26, 2020
←
→
Page content transcription
If your browser does not render page correctly, please read the page content below

Peninsula Clean Energy
  Board of Directors
    Annual Retreat
      September 26, 2020
Agenda
• Call to order / Roll Call

• Public Comment

• Action to set the agenda and approve consent items

                                                       2
Regular Agenda
8:30 – 8:45   Call to Order / Roll Call
              Public Comment
              Action to set the agenda and approve
              consent items
8:45 – 8:50   Citizens Advisory Committee Report
8:50 – 9:30   Strategic Plan Update
              - Review and Discussion of Strategic Plan
                Dashboard

                                                    3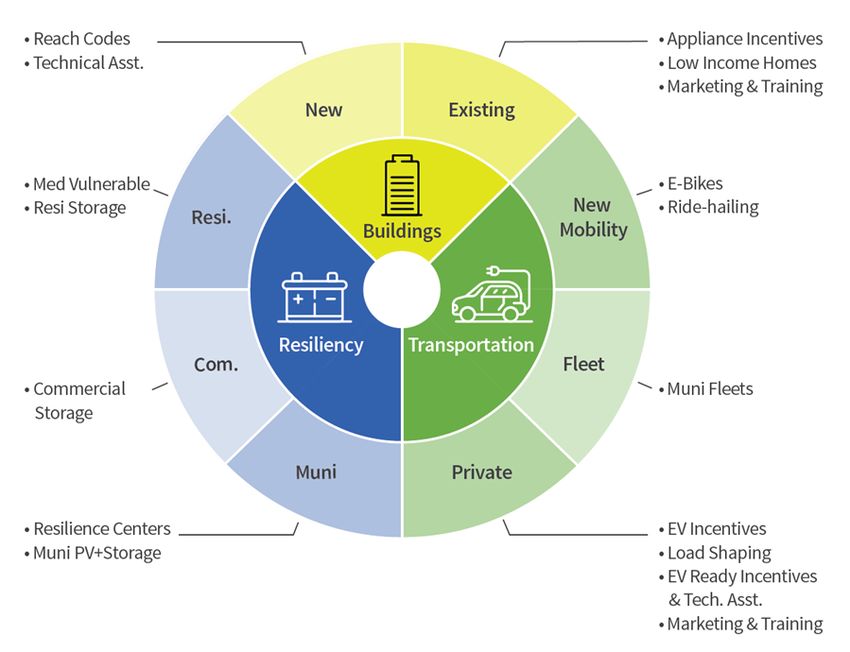
Regular Agenda
9:30 – 10:10    High Level Review and Discussion of
                Market Research Results
10:10 – 10:20   Break
10:20 – 11:00   Financial Update
11:00 – 11:45   Review of Approved Community Energy
                Programs and Budgets/Allocation
11:45 – 12:00   Conclusions and Wrap-Up
12:00           Adjourn

                                                  4
PCE Board Retreat
Strategic Plan Dashboard
September 26, 2020Agenda
• Strategic Plan Implementation Status
• Updates to PCE Strategic Plan
• Review Strategic Plan Dashboard
o Departmental Dashboards
o Descriptions of Metrics
o One-page descriptors
6Strategic Plan Implementation Status
• All departments have worked with their teams to
create work plans to support the strategic plan goals,
objectives, and key tactics
• Tasks developed under each key tactic
• “Owners” assigned to each task
• Discussion on metrics and timelines
• All staff has been involved
• All staff know where they fit into PCE’s strategic plan
7Updates to PCE Strategic Plan
• As part of the implementation process, certain
departmental goals and key tactics were revised and
some were added
• Details of these changes were provided in the packet
8Strategic Plan Dashboard
Metrics for reviewing progress against strategic plan:
Organizational Priorities
Department dashboards:
- Power Resources
- Public Policy
- Community Energy
- Marketing and Customer Care
- Financial Stewardship
- Organizational Excellence
9Strategic Plan Dashboard
BOD Dashboard
Organizational Priorities 2019 Baseline 2020 2025 Target
2025 100% RE 24/7 47% 100%
Overall County GHGs (MT CO2e) TBD TBD
Power Resources Measurement Period - Calendar Year Public Policy Measurement Period - Fiscal Year Community Energy Measurement Period - Calendar Year
2019 Baseline 2020 2025 Target 2020 Baseline 2021 2025 Target 2019 Baseline 2020 2025 Target
Renewable Content (%) 52% 100% PCIA Containment Low High Transportation: GHG Reductions (MT) 770 TBD
Emmissions Factor (lbs/MWh) 94 0 Legislative Impact Medium High Buildings: GHG Reductions (MT) TBD TBD
New Capacity Statewide (%) 0 50% Regulatory Impact High High EV Charging ports installed 0 3,500
Local Resources (MW) 0 20 Coalition Building Low High Electric appliances installed 0 2,000
Fostering CCA Growth Medium High Funds for Low Income (FY) 11% 20%
Marketing & Customer Care Measurement Period - Fiscal Year Financial Stewardship Measurement Period - Fiscal Year Organizational Excellence Measurement Period - Fiscal Year
2020 Baseline 2021 2025 Target 2020 Baseline 2021 2025 Target 2020 Baseline 2021 Yearly Target
Participation Rate (as of FY end) 97% 97% Days Cash On Hand (Unrestricted) 238 231 Governance High High
PCE Aided Awareness 34% 60% Credit Rating (Fitch/Moodys) BBB+/Baa2 "A" Level Staff Satisfaction High High
PCE Favorability 63% 80% Change in Net Position ($000s) $48,900 Positive Innovation Impact High High
Key Account Engagement Low High Investment Performance TBD TBD Organizational Policies High High
Residential & SMB Engagement Med/Low High Average Cost of Energy $61.92 $62.73 Technology and Systems Med High
Baseline is 2020 if FY, 2019 if CY
10Organizational Priorities
Measurement Period: Calendar Year
2019
Baseline 2020 2025 Target
2025 100% RE 24/7 47% 100%
Overall County GHGs (MT CO2e) TBD TBD
11Metrics Definition
• 2025 100% RE 24/7 (%): Average hourly renewable
penetration – average % of load served by renewables
in each hour of the year
• Overall County GHGs (MT CO2e): County-wide total
GHG emissions for the calendar year comprising
o Building energy use (natural gas and electricity)
o Vehicle use (estimate of how many vehicles and total VMT)
o Point source data (e.g. cement factory, etc.)
12Power Resources
Measurement Period: Calendar Year
2019
Baseline 2020 2025 Target
Renewable Content (%) 52% 100%
Emissions Factor (lbs / MWh) 94 0
New Capacity Statewide (%) 0 50%
Local Resources (MW) 0 20
13Metrics Definition
• Renewable Content (%): ECOplus renewable energy
content as reported through CEC Power Source Disclosure
reporting
• Emissions Factor (lbs / MWh): Greenhouse gas
emissions per MWh of load (Starting in 2020, as reported
through CEC Power Source Disclosure reporting)
• New Capacity Statewide (%): Percent of load served by
newly constructed resources (i.e. Wright)
• Local Resources (MW): Megawatts of new resources built
in San Mateo County
14Public Policy
Measurement Period: Fiscal Year
2020
Baseline 2021 2025 Target
PCIA Containment Low High
Legislative Impact Medium High
Regulatory Impact High High
Coalition Building Low High
Fostering CCA Growth Medium High
15Metrics Definition PCIA Containment – Qualitative assessment based on participation of regulatory team in PCIA related CPUC dockets Legislative Impact – Qualitative assessment based on participation of legislative team in legislative hearings, coalitions and other activities Regulatory Impact – Qualitative assessment based on participation of regulatory team in advancing PCE’s regulatory objectives and priorities within CalCCA and at relevant regulatory agencies Coalition Building – Qualitative assessment based on regulatory and legislative teams’ engagement with and formation of coalitions as a means to achieve success in all areas of our work Fostering CCA Growth – Qualitative assessment based on participation of regulatory team in in supporting expansion CCAs and assessment of regulatory team in thought leadership 16
Community Energy
                                 Measurement Period: Calendar Year
                                       2019
                                      Baseline   2020   2025 Target
Transportation: GHG Reductions (MT)     770                TBD
Buildings: GHG Reductions (MT)          TBD                TBD
EV Charging Ports Installed              0                3,500
Electric Appliances Installed            0                2,000
Funds for Low Income (FY)               11%                20%

                                                                      17
Metrics Definition (1/3)
• Transportation: GHG Reductions (MT)
• Total EVs added due to PCE incentives (estimated VMT and avoided
gasoline emissions)
• Utilization of EV chargers due to PCE incentives (estimated VMT and
avoided gasoline emissions)
• Utilization of EV chargers installed due to reach codes
• One-year average emissions reduction based on 10-year projection
• Assumes 0 GHG for electricity based on annualized 100% greenhouse
gas free electricity to start in 2021
• Figures are a projection of reductions based on actual measures
18Transportation – 2020 Hypothetical
EV Charging
Electric Ride-Hailing Multifamily Workplace Fast Charge
Vehicles L1/L2 L2
# Units 600 100 500 1000 100
Avg. 17,000 69,000 - - -
Miles/yr/vehicle
Gal. gas saved 440K 229K 232K 3.5M 734K
CO2e saved 3,900 2,000 2,000 31,000 6,500
(metric tons)
• Total emissions reduced: 45,000 metric tons/year
• Gas saved compared to gas vehicle that gets 23 MPG for personal vehicles and
30 MPG for ride-hail vehicles
• Multifamily charging usage is an annual average over 10 years (because EVs do
not immediately appear)
19Metrics Definition (2/3)
• Buildings: GHG Reductions (MT)
• Projected reach code impact: emissions benefit of new buildings
constructed under reach codes (difference in emissions compared to
buildings with natural gas) compared to state code
• Expected use of appliances in existing buildings receiving incentives
(compared to average gas appliance)
• One-year average emissions reduction based on 10-year projection
• Assumes 0 GHG for electricity based on annualized 100%
greenhouse gas free electricity to start in 2021
• Figures are a projection of reductions based on actual measures
20Reach Codes – 1 city hypothetical residential
Newly built residential Built prior years Ave CO2 savings Total CO2
units with reach code under code per unit (MT/unit savings for year
(10 yr historical ave.) (by code cycle) by code cycle) (MT)
2020 0 0 0 0
State Code 2021 270 270 4 1,080
improves but 2022 270 540 4 2,160
not 100% electric
2023* 270 810 4 3,240
2024 270 810 | 270 4|2 3,240 + 540
2025 270 810 | 540 4|2 3,240 + 1,080
State Code 100%
electric 2026* 270 810 | 810 4|2 3,240 + 1,620
2027 270 810 | 810 | 0 4|2|0 3,240 + 1,620
2028 270 810 | 810 | 0 4|2|0 3,240 + 1,620
2029 270 810 | 810 | 0 4|2|0 3,240 + 1,620
• Total emissions reduced: 34,020 MT CO2e
• Average emissions reduced over 10 years: 3,402 MT CO2e /year 21Metrics Definition (3/3)
• EV Charging ports installed – Annual and cumulative total
EV charging stations deployed in current and prior years
• Electric appliances installed – Annual and cumulative total
electric appliances deployed in current and prior years
• Funds for Low Income – Percentage of community energy
and resilience budget spent in the fiscal year targeting:
• workforce: all investment for training programs
• low-income and underserved communities: 400% above federal
poverty line, participation in low-income rate plans
(CARE/FERA), and San Mateo County Community Vulnerability
Index
22Marketing and Customer Care
Measurement Period: Fiscal Year
2020
Baseline 2021 2025 Target
Participation Rate (as of FY end) 97% 97%
PCE Aided Awareness 34% 60%
PCE Favorability 63% 80%
Key Account Engagement Low High
Residential & SMB Engagement Med/Low High
23Metrics Definition
• Participation Rate (as of FY end): Percentage of eligible electricity accounts in our
service territory that receive electricity generation from Peninsula Clean Energy.
• Peninsula Clean Energy Aided Awareness: Measured by annual survey, in the second
half of the FY, of representative sample of residents in our service territory (including
customers and non-customers). Aided awareness of Peninsula Clean Energy (respondents
recognize from a list) as an electricity provider for the service territory.
• Peninsula Clean Energy Favorability: Of those respondents to the annual survey (see
above) who are aware (aided) of Peninsula Clean Energy, the percentage who have a
“favorable” or “somewhat favorable” opinion of Peninsula Clean Energy.
• Key Account Engagement: Based on scoring rubric of strategic accounts who participate
in high-, medium- and low-engagement Peninsula Clean Energy activities/programs.
• Residential and Small Business Engagement: Based on scoring rubric of residential
and small business customers who participate in high-, medium- and low-engagement
Peninsula Clean Energy activities/programs.
24Financial Stewardship
Measurement Period: Fiscal Year
2020
Baseline 2021 2025 Target
Days Cash on Hand (Unrestricted) 238 231
Credit Rating (Fitch/Moody’s) BBB+/Baa2 “A” level
Change in Net Position ($000s) $48,900 Positive
Investment Performance TBD TBD
Average Cost of Energy $61.92 $62.73
25Metrics Definition
• Days Cash on Hand (Unrestricted): Cash balance that is
unencumbered by bank or loan covenants and reduced by Board-approved
future fiscal year community program commitments. As measured by the
number of days of cash on hand at any given point. Board policy is a
minimum of 180 days.
• Credit Rating: Public assessment by independent rating agencies
measured by maintenance of investment grade ratings.
• Change in Net Position: Annual measurement of Total Revenues
minus Total expenses plus/minus the change in Non-Operating
Income/Expenses.
• Investment Portfolio Performance: Metric and performance criteria
not yet defined.
• Average Cost of Energy: Quantitative assessment measured by Total
Cost of Energy divided by Base Load (as publicly reported).
26Organizational Excellence
Measurement Period: Calendar Year
2020
Baseline 2021 Yearly Target
Governance High High
Staff Satisfaction High High
Innovation Impact High High
Organizational Policies High High
Technology and Systems Medium High
27Metrics Definition
• Governance – Assessment of succession process for Board members and
alternates, quality of orientation for new board members, and degree of Board
member support of the organization
• Staff Satisfaction – Based on yearly surveys, assessment of employee
satisfaction; evaluation of professional development and training efforts;
evaluation of competitive benefits
• Innovation Impact – Assessment of the quality of technology, program design,
and policy innovation developed by the organization and its impact towards the
organization’s goals and the clean energy industry
• Organizational Policies – Assessment of progress toward implementation of
key policies such as the Sustainable Workforce and Ethical Vendor Standards
policies
• Technology & Systems – Assessment of quality and completeness of systems
to support the organization’s work including for business processes, energy-
related analysis, program impact evaluation and customer insights; evaluation of
systems and practices that ensure data accuracy/privacy and security.
28Discussion and questions
Market Research Results
      September 26, 2020
Objectives
Assess awareness and perception among San Mateo
County residents of:
• Peninsula Clean Energy brand
• Benefits, obstacles to adoption and purchase interest
in:
o Electric Vehicles
o All-Electric Homes and specific end uses historically
fueled by natural gas
31Approach
• Random sample of all households in San Mateo
County
• Letter invitation from San Mateo County Office of
Sustainability
• Response rate: 8.3%
• 19-minute self-administered online survey offered in
multiple languages (English, Spanish, Mandarin,
Tagalog)
Affiliation with OOS provided an opportunity to capture
“unaided awareness” BUT likely introduced some
degree of pro-environment bias into the sample
32Approach (continued)
• Sample was “normalized” as follows to better reflect
population
• Resulting sample: 2,261 residents
• The margin of error for a total sample of 2,261 at the
95% confidence level is +/- 2.0% but is slightly higher
for subgroups
• Surveys were completed April 7 to April 29, 2020
33Brand Awareness, Perception
Brand
Awareness,
Perception
• 34% total awareness
o Inclusive of 11% unaided
• Of those who are aware, 63% had a favorable perception
• Brand perceptions are fairly well-aligned with our mission
and messaging
• Top priority for an “electricity provider” is lower rates; all
other priorities far behind in importance
• 85% of respondents agree (58% strongly agree) with the
statement: “I believe our community should prioritize efforts
to do our part to reduce greenhouse gas emissions.”
35Brand Perceptions
Our intended messages are getting across (among those who are
aware)
Is working to improve the environment 65% 1% 33%
58% 2% 41%
Provides cleaner energy than other electricity providers
56% 1% 42%
Offers programs that benefit the environment (help you be "greener")
53% 2% 45% TRUE
Is a reliable provider of electricity
42% 6% 52% FALSE
Is a public agency in San Mateo county
40% 2% 58%
Is innovative NOT SURE
37% 16% 47%
Charges lower rates than PG&E
32% 1% 67%
Supports local jobs and the local economy
26% 4% 70%
Understands and responds to customer needs
10% 3% 88%
Is financially strong
10% 45% 45%
Is a company division/branch of PG&E
Q9 - For each statement, please indicate if you think it is true or false about Peninsula Clean Energy. 36
Base: Aware of PCE (n=770)Energy Provider Priorities
The highest priority for an electricity provider among all San Mateo County residents is
lower electric rates
• Nearly half (48%) rank low rates as their #1 priority
• Just 17% rank cleaner sources #1, followed by renewable investment (10%), storage (10%) and
environmental benefits (9%)
Lower electric rates 11% 15% 48% 74%
Cleaner energy sources 16% 22% 17% 56%
Offers programs that benefit the environment 17% 15% 9% 42% Priorities
(or to help you be “greener”)
Invests in renewable energy generation 17% 14% 10% 41%
Offers solar + storage solutions to provide
Ranked
electricity during power shutoffs
14% 17% 10% 40% 3rd 2nd 1st
Local jobs and economic activity 10% 7% 3% 20%
2%
Offers programs that promote
electric vehicles or EVs
7% 4% 14%
Offers programs that promote converting household
appliances from natural gas to electric
3% 8%
3% 2%
Q7a - If a provider of electricity to your home could offer all the advantages listed below, which three 37
would be most important to you?
Base: Total Sample (n=2,261)Implications
• Our brand awareness has plenty of upside for
improvement
• Perceptions of Peninsula Clean Energy are favorable
among those who are aware
• Improvement needed on the perception of lower cost
electricity
• Opportunity to improve awareness and favorability
among non-whites and renters
38Electric Vehicles
EV Awareness, Perceptions
Objective:
• Assess awareness and perception among San Mateo
  County residents about electric vehicles, including
  benefits, obstacles to adoption and purchase interest

Respondents:
• Survey questions on this topic were presented only to
  those respondents who were:
  o Licensed drivers and
  o Primary decision maker for vehicle purchases

                                                          40
Persuasion Monitor™– EV / Plug-in Hybrid EV
Almost all respondents to the EV survey were aware of EVs and view them favorably.
However, most rate themselves as lacking in familiarity. This dip indicates a need for
more information, especially to address barriers to adoption.
Metrics are particularly strong in
households with >$100K in income and
94% among homeowners
85%
51% Rating on
43% scale of 1-10
where 10 is
29% 10 extremely
likely
9% 9 10%
14% 8
Aware Familiar Favorable Would Now
Consider* Use
The base for this chart and all remaining slides in this section is Licensed * Would Consider includes those who would
Drivers who are Vehicle Decision-makers, not all SM County households. consider an HEV, the other metrics are for 41
BEV and PHEV only.Perceptions of EVs
High percentages of respondents agree with most factual statements about EVs
but are less certain about total cost of ownership and ability to charge in a
standard wall outlet.
Perceptions of Plug-In EVs Licensed Drivers / Decision Makers % Agree % Not Sure
EVs have the lowest emissions of all cars 27% 50% 77% 13%
EVs save the most money on fuel 29% 44% 73% 13%
Rebates, tax credits and other incentives are available
to those who purchase EVs
37% 34% 70% 16%
EVs let me use the carpool lane as a single driver 25% 38% 63% 20%
Agree Somewhat
Most new electric vehicles can go 200 miles on a single charge 33% 27% 60% Agree Strongly 19%
It costs less to drive and maintain an EV than a
Educational standard gasoline-powered vehicle
29% 26% 54% 20%
opportunity
EVs can be plugged into a standard wall outlet 15% 19% 35% 24%
QEV3 - Please indicate your agreement with the following statements about plug-in electric vehicles (EVs ). 42
Base: Licensed Drivers and Decision Makers (n=1,777)EV Motivators & Barriers
• Purchase price and miles per charge are motivating consideration.
• Fear of running out of battery and inability to charge are the biggest barriers,
followed by purchase price.
Motivators Licensed Drivers / Decision Makers Barriers Licensed Drivers / Decision Makers
32% 36%
Pricing Of Vehicle 33% Range / Run Out Of Battery 25%
25% 25%
Miles Per Charge 22% Lack of Convenient Charging Stations 15%
14% 24%
Rebates / Incentives 5% Too Expensive 17%
14% 7%
Convenient Charging Stations 8% New Maintenance Cost 8% New
15% Used 6%
Environmental Factors 10% Reliability 5% Used
8% 5%
Cost Of Use 7% Charging Time 2%
6% 4%
Maintenance Cost 8% Safety 3%
3% 4%
Reliability 10% Lifetime Of Battery/ Condition 18%
QEV12 - If you were in the market for a NEW/USED vehicle, what are two or three things that might motivate you to consider getting an electric vehicle?
QEV13 - If you were in the market for a NEW/USED vehicle, what are two or three things that might be a concern to you when considering an electric vehicle? 43
Base: Expecting to buy/lease a new/used car (n=1,111 / 404)Implications
• Residents are strongly aware of EVs and view them
favorably
• Opportunities exist for education about operating costs
and charging
• As of April 2020, 1 in 4 residents were considering
buying a vehicle in the next year
• Opportunity to influence used vehicle buyers toward
EVs
44Building Electrification
All Electric Buildings Awareness, Perceptions
Objective:
To assess awareness and perception among San Mateo
County residents about All-Electric Homes and electric
appliances/equipment for specific end uses in homes
that are historically fueled by natural gas, including
benefits, obstacles to adoption and intention to electrify
their homes
46Appliance Feature Priorities
Energy efficiency (read: lower cost), reduced energy costs, and
comfort are prioritized above all.
Appliance Features
I want the appliances to reduce
my home's energy costs
17% 27% 33% 76%
I want the appliances in my home
to be most energy efficient
22% 29% 22% 73%
I want the appliances to make
my life and home most comfortable
17% 14% 24% 55%
Ranked
I want the appliances in my home
to run on cleaner sources of energy
17% 13% 9% 39% 3rd 2nd 1st
I want the appliances to reduce
my home's carbon footprint
13% 9% 7% 30%
I want the appliances in my home
to give me greater control of how I use energy
14% 7% 5% 26%
QBE4b - When thinking about all the appliances in your home, how important are the following factors to you?
Base: Total Sample (n=2,261)
47NG vs Electric Appliance Perceptions
• Operating efficiency and fuel costs are more strongly associated with gas appliances,
but about 1/3 of consumers are not sure.
• BE will benefit from leveraging the factors on which electric appliances win: emissions,
safety, and the environment.
Generating fewer emission in home 60% 7% 10% 23%
When asked Safer 52% 19% 6% 23%
about concerns if Electric
considering an Greater environmental benefits 44% 12% 14% 30%
electric appliance Both
Greater operating efficiency 25% 16% 31% 29%
for their homes,
Natural Gas
respondents Lower operating cost / Fuel cost 23% 9% 36% 32%
raised VERY few Not Sure
barriers. Lower purchase cost / Less expensive 22% 11% 25% 41%
Works better for cooking 9% 12% 71% 9%
QBE7 - For each of the phrases below, please check whether the phrase better applies, generally, to a natural
gas or electric powered appliance. 48
Base: Total Sample (n=2,261)Implications
• Possible opportunity to add to consumer priorities by
emphasizing the importance of safety and reduced
emissions inside the home
• Widely held belief that natural gas works better for
cooking presents a communications and education
challenge especially among upper income households
49Financial Review Board Meeting September 26, 2020
Purpose/Context
Recently, there have been questions about whether to continue spending on
programs at the same magnitude or
• Cutback?
• Pause?
Step back and review financial projections
• Review assumptions
• Assess sensitivities
• Revise forecasts and upsides/downsides
Summarize program spending
Implement trigger level for when we would reassess program commitments
and/or activities
51Agenda
• Review of Budget
• Conservative assumptions
• Electricity Load
• Prices (old)
• PG&E generation rates
• PCIA
• Energy Price Forecast Summary and Update
• Electricity Load Results YTD
• MRW forecasts
• PCIA
• PG&E Generation rates
• Combined Summary Projection
• Program Expenses and Financial Overview
52Key Assumptions in the FY20/21 Approved Budget and 5-year Plan
• PG&E Generation Rates
• Jan 1, 2021 - Increase of 2%
• 0.5% increase each year through FY24/25
• PCIA Rates
• PCIA Cap of $0.005 on Jan 1, 2021
• PCIA Trigger of 58% increase on Oct 1, 2020 (3 months)
• PCIA Cap of $0.005 on Jan 1, 2022
• No change after that
• Energy Prices
• Based on then-latest forecast (in Nov 2019) – did not include effects of COVID-19
• Electricity Load
• Extended period of depressed and slow-recovering economy (especially in Small/Medium Business)
• Overall load decrease of 13% for FY20/21 from Pre-COVID level (“Budget Case”)
• Overall load decrease of 10% for FY21/22 from Pre-COVID level (“Budget Case”)
• Overall load decrease of 8% for next 3 years from Pre-COVID level (“Budget Case”)
53Cash Reserve Policy
Per current Board-approved policy:
Total Cash
Less - cash restricted by loan term or covenant
Less – cash restricted for committed program spending in future fiscal years (beyond current one)
Equals – Unrestricted Cash
Expenses per day
Total Annual expenses divided by 360
Unrestricted Days Cash on Hand
Unrestricted Cash divided by Expenses per Day
Note: This is a more conservative calculation than rating agencies use (they do not restrict
for future programs)
54Financial Projections Per Approved Budget
Original Budget FY2019-2020 FY2020-2021 FY2021-2022 FY2022-2023 FY2023-2024 FY2024-2025
Preliminary Actual Approved Budget Plan Plan Plan Plan
OPERATING REVENUES 278,092,536 215,703,496 232,290,968 234,247,659 240,623,184 245,026,768
OPERATING EXPENSES 231,337,227 225,642,453 235,267,423 239,214,533 236,055,745 248,158,683
Total Nonoperating Income/(Expense) 2,177,295 1,408,000 1,528,000 1,648,000 1,768,000 1,888,000
CHANGE IN NET POSITION 48,932,604 (8,530,957) (1,448,455) (3,318,874) 6,335,439 (1,243,915)
Total Cash & Cash Equivalents 210,562,154 186,646,421 184,697,966 181,379,092 187,714,531 186,470,616
Based on Current/Projected Program Commitments
Unrestricted Cash (per Current Reserve Policy) 150,553,581 153,906,214 152,579,772 151,760,898 158,096,337 156,852,422
Unrestricted Days Cash on Hand (per Current Reserve Policy) 234 246 233 228 241 228
Note: Unrestricted cash has been updated to reflect
more current program commitments 55Energy Price Forecast Update
• We use updated energy price forecasts that are done twice/year (Fall and Spring)
• The FY2020/20221 Approved Budget was based on the then-current forecast - Fall 2019 (pre-COVID)
• The updated Spring 2020 forecast has been used to update the forecast
• Major observations about impact on Net Position:
• Prices are expected to be lower in the first 3 years of PCE’s 5-year plan (through FY2023)
• Prices are expected to be somewhat higher in the last 2 years of PCE’s 5-year plan
Significant Improvement in Net
Position: Updated price forecast
expected to have $15.2 million
positive impact to Net Position
over 5-year time horizon – all in
the first 3 years
56Electricity Load Forecast Update
• Load Forecast was based on slow economic recovery
• Load is still below Pre-COVID forecasted levels
• But early indications are that actual load is well above conservative Budget assumptions
and closer to original “Mid-Case” scenario
Using Mid-Case Forecast would
add $21.7 million positive
impact to Net Position mostly in
the first 3 years
57Electrical Load – Actual vs. Pre-COVID Forecast
Actual Pre-COVID Forecast
58Electrical Load – Actual vs. Budget
Comparison of actuals versus assumed in the Approved Budget
August 2020 – 12.5% higher (included significant heat wave)
July 2020 – 6.5% higher Actual Budget
June 2020 – 6.7% higher
May 2020 – 6.1% higher
59Electrical Load – Actual vs. Mid-Case Scenario
Actual Mid-Case Scenario
60MRW Rate Forecasts
• 10-year Projection vs. PCE’s 5-year planning horizon and forecasts
• MRW
• Expert provider of IOU generation and PCIA rate forecasts (used by most CCAs)
• Uses bottoms-up approach to projections taking into account actual PG&E resource
utilization and retirements
• Retained as Independent Consultant to provide Los Banos Technical Study
• PCIA Rate
• Slightly higher than PCE’s forecasts in near term (negative for PCE)
• Significantly lower than PCE’s forecasts in 4th and 5th year (significantly positive for PCE)
• Significantly lower than current levels in years 6-10 (significantly positive for PCE)
• PG&E Generation Rates
• Lower than PCE’s forecasts in next 5 years (negative for PCE)
• Significantly lower than PCE’s forecasts in 3rd year (negative for PCE)
• Significantly higher than current levels in years 6-10 (significantly positive for PCE)
61MRW Rate Projections
No projection
Change in Net Position FY2020-21 Total Years 1-5 Annually in Years Change in Net Position FY2020-21 Total Years 1-5 Annually in Years
6-10 6-10
MRW Forecast Negative $8.5 Positive $64.2 million Positive $44.1 MRW Forecast Negative $12.1 Negative $81.8 Positive $27.8
million million/year million million million/year and
growing
PCE Forecast Negative $8.5 Negative $8.2 million Not forecast
million PCE Forecast Negative $8.5 Negative $8.2 million Not forecast
million
62Combined Financial Scenario – 5 and 10 Years
Includes
• Updated for actual year-ending cash (Budget was based on an estimate of June 30)
• Updated Energy Price Forecast
• Positive impact in Years 1-3
• Negative impact in Years 4-5
• Revised Electricity Load Forecast
• Positive impact in Years 1-3
• Negative impact in years 4-5
• MRW Forecasts for PCIA and PG&E Generation rates for 10 years
• Negative in Years 1-3
• Positive in years 4-5
• Significantly Positive in Years 6-10
• Other Assumptions for Years 6-10 (conservative)
• Base Load stays flat from Year 5 through Year 10
• Energy Costs escalate at 5% compounded per year from Year 5 level
• All other costs escalate at 5% compounded per year from Year 5 level
63Revised 5-year Outlook
Original Budget FY2020-2021 FY2021-2022 FY2022-2023 FY2023-2024 FY2024-2025
Approved Budget Plan Plan Plan Plan
CHANGE IN NET POSITION (8,530,957) (1,448,455) (3,318,874) 6,335,439 (1,243,915)
Total Cash & Cash Equivalents 186,646,421 184,697,966 181,379,092 187,714,531 186,470,616
Based on Current/Projected Program Commitments
Compared to
Unrestricted Cash (per Current Reserve Policy) 153,906,214 152,579,772 151,760,898 158,096,337 156,852,422 Original
Budget/Plan:
Unrestricted Days Cash on Hand (per Current Reserve Policy) 246 233 228 241 228
Revised Forecast FY2020-2021 FY2021-2022 FY2022-2023 FY2023-2024 FY2024-2025
Forecast Forecast Forecast Forecast Forecast Positive in Year 1
CHANGE IN NET POSITION (3,988,708) (5,672,871) (18,141,312) 9,352,965 30,761,073
Negative in Year 3
Total Cash & Cash Equivalents 179,805,080 174,132,209 155,990,897 165,343,862 196,104,935 Significantly
Based on Current/Projected Program Commitments
favorable in Year 5
Unrestricted Cash (per Current Reserve Policy) 147,064,873 142,014,015 126,372,703 135,725,668 166,486,741
Unrestricted Days Cash on Hand (per Current Reserve Policy) 233 217 190 203 233
6410-year Financial Projection
Revised Forecast FY2020-2021 FY2021-2022 FY2022-2023 FY2023-2024 FY2024-2025 FY2025-2026 FY2026-2027 FY2027-2028 FY2028-2029 FY2029-2030
Forecast Forecast Forecast Forecast Forecast Forecast Forecast Forecast Forecast Forecast
CHANGE IN NET POSITION (3,988,708) (5,672,871) (18,141,312) 9,352,965 30,761,073 30,606,779 26,817,073 19,458,031 15,529,251 6,240,656
Total Cash & Cash Equivalents 179,805,080 174,132,209 155,990,897 165,343,862 196,104,935 226,711,713 253,528,786 272,986,818 288,516,069 294,756,725
Based on Current/Projected Program Commitments
Unrestricted Cash (per Current Reserve Policy) 147,064,873 142,014,015 126,372,703 135,725,668 166,486,741 197,093,519 223,910,592 243,368,624 258,897,875 265,138,531
Unrestricted Days Cash on Hand (per Current Reserve Policy) 233 217 190 203 233 263 284 294 298 291
65Conclusions
• Financial outlook is fairly positive and reasonably predictable
• Don’t see significant downside in next few years
• Could be significant upside – especially after 4th year
Recommendation: Maintain program activities and commitments at current levels
for now
Proposal:
• “Trigger” implemented to decide when to scale back program activities and/or commitments
• If it appears that Unrestricted Days Cash on Hand will drop below 200 in the following fiscal
year, then scale back to ensure compliance.
• As of today, that could happen in Fiscal Year 2022-2023. We will evaluate in the budget for that
year.
• Scaling back would mean:
• Reduction in new program commitments brought to the Board for approval
• Evaluation of expenses that could be reduced or delayed for already approved programs
66Program Spending Overview & Process
• Programs are the biggest, non-energy part of budget
• Long-term commitments
• Budget and Cash Reserve Projections assume:
• Approximate spending of $10-11 million per year
• New program funding approvals of $10-11 million per year
• So, future commitments stay relatively flat
67Program Approval Process
Specific Program – multi-year, multi-element, specific objective
Specific contract ($100k+)
Specific contract ($100k+)
Specific contract ($100k+)
Other expenses/commitments TBD – each < $100k
Example Program – EV Infrastructure $16 million over 4 years (approved 12/2018)
Contract to Board: CLEAResult - $2 million/4 years (approved 8/2019)
Other Contract(s) to Board TBD – each $100K+
Other Individual Expenses/Commitments – each < $100K
Total Expenses = $16 million over 4 years
68Program Budget Process
Approved FY2021 Budget – Total Organization
Cash Reserves set aside ($27.6 million)
Expenses ($225.6 million)
Spending Category – Energy ($197.4 million)
Reserved for Community Energy Programs ($18.7
Spending Category – Community Energy Programs ($7.6 million) million)
Program 1 Current Program 1 Future Years
Year Spending Spending
Program 2 Current Program 2-n Future Years
Year Spending Spending
Program 3 Current
Year Spending Program 4-n
Current Year
Spending
Spending Category – Other Programs ($1.4 million) Reserved for Other Programs ($8.9 million)
Other Categories – Total ($19.2 million) Program 1 Future Years
Spending
Program 2-n Future Years
Spending
69As Presented to Finance Committee on 8/10/20 (Slide 1 of 2)
As of June 30, 2020
Estimated Future Fiscal Year
Program Amount Contract Amount Other Expected
Board Approval Already Spent Spending in Spending for Already
Programs Approved by Board Approved by Approved by Contract or Term
Date as of July 1, 2020 Current FY (prior Approved Programs
Board Board Spending
to June 30, 2021) (FY22-24)
Community Energy Programs
EV Infrastructure 16,000,000 12/20/18 - 4 years 146,000 5,100,000 10,754,000
Contract - ClearResult 08/22/19 2,000,000 146,000 500,000
Contract - Center for Sustainable Energy 10/24/19 850,000
Customer Incentives provided through Center for Sustainable Energy 7,150,000 4,000,000
Customer Incentives (other) 4,000,000
Workforce Development 1,000,000 100,000
Other Spending* 1,000,000 500,000
New EV Incentives 1,500,000 04/27/19 3 years 220,000 800,000 480,000
Low Income Used EV - Contract with Peninsula Family Services 500,000 01/24/19 2 years 220,000 60,000 220,000
Ride & Drive EV Marketing - Contract with Reach Strategies 750,000 02/28/19 3 years 215,000 50,000 485,000
Ride Hailing Electrification - Contract with FlexDrive 500,000 03/26/20 2 years 100,000 400,000
E-Bikes 300,000 07/23/20 3 years 60,000 240,000
Curbside & Low Power Pilot in MUD 1,000,000 06/29/18 - 3 years 100,000 350,000 550,000
Contract - Energy Solutions (MUD - Low Power Pilot) 03/28/19 400,000 100,000 250,000
Curbside Pilot 600,000 100,000
Existing Buildings 6,100,000 05/28/20 - 4 years - 750,000 5,350,000
Contract - ClearResult 06/25/20 250,000 50,000
Customer-direct incentives (originally part of ClearResult contract) 06/25/20 2,750,000 200,000
Other Spending* 3,100,000 500,000
Reach Codes & Technical Assistance 250,000 01/23/20 - 2 years 60,000 - 190,000
Contract - TRC 01/23/20 450,000 60,000
Cost Sharing Contract -SVCE 01/23/20 (200,000)
Climate Action Plans Support - Contract with SMCOOS 95,000 06/25/20 95,000 1 year 90,000 5,000
Community Energy Programs Authorized Subtotal 26,995,000 961,000 7,360,000 18,674,000 70As Presented to Finance Committee on 8/10/20 (Slide 2 of 2)
As of June 30, 2020
Estimated Future Fiscal Year
Program Amount Contract Amount Other Expected
Board Approval Already Spent Spending in Spending for Already
Programs Approved by Board Approved by Approved by Contract or Term
Date as of July 1, 2020 Current FY (prior Approved Programs
Board Board Spending
to June 30, 2021) (FY22-24)
Other Programs
Resilience 10,000,000 01/23/20 - 3 years 20,000 1,281,987 8,698,013
Power On Peninsula - Medical
Portable Battery Authorization (Hassett) - 2 BOD authorizations 07/23/20 750,000 - 683,237 -
Power On Peninsula - Residential/Commercial
Program Admin Contract - TerraVerde 06/25/20 220,000 20,000 140,000
Contract - Sunrun (10 year Agreement) - Residential 06/25/20 474,000
Load Modification Agreement - Contractor TBD - Commercial TBD 460,800
Other Spending* 8,095,200 458,750
Building Electrification Awareness 400,000 01/23/20 - 3 years - 150,000 250,000
Contract - Gelfand 07/23/20 300,000 100,000
Other Spending* 100,000 50,000
Power Resources & Marketing Authorized Subtotal 10,400,000 20,000 1,431,987 8,948,013
Total Programs Authorized Subtotal 37,395,000 981,000 8,791,987 27,622,013
* Other Spending includes spending for program areas for which (a) Board approval is not required (e.g. incentives, contracts under $100,000) or (b) have not yet been identified
71Programs Review September 26, 2020
High-Level Roadmap

                              v1 d
                           ap   e
                         dm loy
                        a ep 0
                     Ro % d 202
                      90 end

                                     73
Approved Budget by Major Area
Resilience
EV Infrastructure
10,000,000 , 27%
16,000,000 , 43%
Electrification Awareness
400,000 , 1%
Reach Codes & Tech
Asst
250,000 , 1%
Existing Buildings
6,100,000 , 16% EV Charging Pilots
1,000,000 , 3%
Ride Hailing & Bikes EV Incentives & Mktg
800,000 , 2% 2,750,000 , 7%
74Resilience
2020 2021 2022 2023
Resilience: $10 million over 3 years
Power On Peninsula Res - Contract:
TerraVerde - $220k/2 years
Power On Peninsula Res - Contract: Sunrun
POP Medical -
- $474k/10 years >>
Contract: Hassett
Hardware +
Outreach- $750k/
0.5 year
Municipal CRCs –$2.5 M
Remaining Distributed RA - $1.1 M
Remaining Medically Fragile Customers - $1.8 M
Critical Infrastructure - $500k
Future Programs - $2.7 M 75Transportation: Vehicles
2019 2020 2021 2022
Vehicles: $3.55 million over 4 years
New EV Incentives - $1.5 million/3 years
Used EV Contract: Peninsula Family Service -
$500k/2 years
Ride & Drive Marketing Contract: Reach Strategies $750k/3 yrs
Ride Hailing Contract with Flexdrive: $500k/2 years
E-Bikes - TBD: $300k/3 years >>
76Transportation: EV Charging
2019 2020 2021 2022 2023
EV Infrastructure: $16 million over 4 years
Technical Assistance - Contract: CLEAResult - $2M/4 years
Incentives (CALeVIP) – Contract: Center for Sustainable Energy - $8M/
3.5 years ($850k + incentives)
Additional Incentives: $4M
Workforce Grants: $1M
Systems & Admin: $1M
77Transportation: EV Charging Pilots
2019 2020 2021 2022
Vehicles: $1 million
Low Power Charging Pilot – Contract: Energy Solutions
$400k/3 years
Curbside Assessment –
Contract: ARUP $98k/6 Curbside Pilot – TBD $500k/2 yrs >>
mos
78Buildings: New & Existing
2020 2021 2022 2023
Buildings: $6.75 million over 4 years
(New) Reach Codes - Contract TRC - $250k/2 years
(Existing) Water Heaters - Contract CLEAResult- $250k/4 years
(plus incentives $2.8M)
(Existing) Low Income Home Upgrades – TBD - $2M/4 years
(Existing) Pilots & Other: $1.1M/4 years
Building Electrification Awareness – Contract Gelfand - $300k/3 yrs
(additional $100k in other expenses)
79San Mateo County Emissions
2015 San Mateo County
2021 Emissions Projection
• Total Emissions: 5.2 Million MT Waste & Water Electricity
5% 2%
• Electricity: ~770,000 MT Building
Natural Gas
23%
2021
• PCE Electricity will be GHG
free on annual basis
• Direct access will account for
majority of electricity related Transportation
& Equipment
emissions 70% • Projection based on last available inventory
from 2015, modifying electricity to show only
estimated direct access emissions
• Upstream leakage emissions are not
accounted for so Building Natural Gas
emissions may be up to 50% larger.
• 80
Air travel and embedded carbon of products
not includedProgram Cost & GHG Reductions – Full Adoption
EV Infrastructure
50,000+ MT
Ave. CO2e Metric Tons GHG
r y
Reduction per year
na
i
lim
Reach Codes
P re
14,000+ MT
EV Incentives
6,400 MT
Existing
Ride-Hailing Buildings
1,800 MT 2,700 MT
81
Funds Invested in $1,000sBackup Slides
Transportation Emissions Detail
                      2019 Transportation GHG Emissions
                                    All Others
                                       10%
                            Buses
                             2%

               HD Trucks
                  7%                                                            Personal Pax Cars
                                                                                      33%

       MD Trucks
         15%

      Rental LD Truck/SUV                                                      Rental Pax Cars
               2%                                                                    5%

         Com. LD Truck/SUV                                                Com. Pax Cars
                2%                                                             2%
                                                                 Gov. Pax Cars
                                                                      1%
                                         Personal LD Truck/SUV
                                                  21%                                               83
            Source: CARB Model for 2019 for San Mateo County
Natural Gas Emissions Breakdown
Small Com. Cooking Small Com. Misc.
7% 2%
Small Com. WH
10%
Res HVAC
33%
Small Com. HVAC
Small Com.
11%
30%
Large Com. Misc. Large Com.
0% Res
4%
66%
Large Com. Cooking
1%
Large Com. WH
1%
Large Com. HVAC
2%
Res Misc.
2% Res Cooking
3% Res WH
Res Dryer 27%
1%
Sources: 2018 PG&E Gas data 84
2010 California Residential Appliance Saturation Survey,
2006 California Commercial End-Use StudyRegular Agenda
Adjourn
85You can also read