Delay-Adjusted Age-Specific COVID-19 Case Fatality Rates in a High Testing Setting: South Korea, February 2020 to February 2021 - MDPI
←
→
Page content transcription
If your browser does not render page correctly, please read the page content below
International Journal of
               Environmental Research
               and Public Health

Article
Delay-Adjusted Age-Specific COVID-19 Case Fatality Rates in a
High Testing Setting: South Korea, February 2020 to February 2021
Eunha Shim

                                            Department of Mathematics, Soongsil University, Seoul 06978, Korea; alicia@ssu.ac.kr; Tel.: +82-(02)-820-0416

                                            Abstract: In South Korea, a country with a high coronavirus disease 19 (COVID-19) testing rate, a
                                            total of 87,324 COVID-19 cases, including 1562 deaths, have been recorded as of 23 February 2021.
                                            This study assessed the delay-adjusted COVID-19 case fatality risk (CFR), including data from the
                                            second and third waves. A statistical method was applied to the data from 20 February 2021 through
                                            23 February 2021 to minimize bias in the crude CFR, accounting for the survival interval as the lag
                                            time between disease onset and death. The resulting overall delay-adjusted CFR was 1.97% (95%
                                            credible interval: 1.94–2.00%). The delay-adjusted CFR was highest among adults aged ≥80 years
                                            and 70–79 years (22.88% and 7.09%, respectively). The cumulative incidence rate was highest among
                                            individuals aged ≥80 years and 60–69 years. The cumulative mortality rate was highest among
                                            individuals aged ≥80 years and 70–79 years (47 and 12 per million, respectively). In South Korea,
                                            older adults are being disproportionately affected by COVID-19 with a high death rate, although
                                            the incidence rate among younger individuals is relatively high. Interventions to prevent COVID-19
                                            should target older adults to minimize the number of deaths.


                                     Keywords: SARS-CoV-2; COVID-19; Republic of Korea; age-specific death rate; case fatality rate

Citation: Shim, E. Delay-Adjusted
Age-Specific COVID-19 Case Fatality
Rates in a High Testing Setting: South
Korea, February 2020 to February
                                            1. Introduction
2021. Int. J. Environ. Res. Public Health         As of 23 February 2021, more than 110 million cases of coronavirus disease-19 (COVID-19)
2021, 18, 5053. https://doi.org/            and approximately 2.5 million deaths had been reported worldwide [1]. The ongoing
10.3390/ijerph18105053                      COVID-19 pandemic has imposed a substantial burden on health systems and economies,
                                            overwhelming many health systems worldwide [2]. Estimation of case fatality rates (CFRs)
Academic Editor: Paul B. Tchounwou          is a key epidemiological metric used to assess the severity of an epidemic, allowing public
                                            health officials to determine the type and intensity of intervention strategies required to
Received: 14 April 2021                     mitigate disease transmission [3].
Accepted: 6 May 2021
                                                  As of 23 February 2021, South Korea, a country of 52 million people, had reported
Published: 11 May 2021
                                            87,324 cases of COVID-19 and 1562 deaths [4]. The majority (62%) of COVID-19 cases
                                            in South Korea have been reported in metropolitan areas, namely Seoul, Incheon and
Publisher’s Note: MDPI stays neutral
                                            Gyeonggi Province [4]. The rapid implementation of extensive testing in South Korea
with regard to jurisdictional claims in
                                            is considered to have been successful in mitigating the spread of the disease, without
published maps and institutional affil-
                                            requiring the need for drastic measures such as a complete city lockdown [5]. Despite these
iations.
                                            successful measures, a second wave of the pandemic started in South Korea in August 2020,
                                            with multiple clusters of infections linked to Protestant churches in the metropolitan Seoul
                                            area [4]. In the third week of November 2020, the greater Seoul area was considered to
                                            have entered a third wave of COVID-19, with the daily caseload remaining over 100 since
Copyright: © 2021 by the author.
                                            November 8. There were 313 cases confirmed on November 18, exceeding 300 for the first
Licensee MDPI, Basel, Switzerland.
                                            time since late August. In light of rapid surges in COVID-19 cases, the Korean government
This article is an open access article
                                            raised the social distancing guidance level in Seoul to level 2—the third highest in a five-
distributed under the terms and
                                            tier social distancing scheme—on 24 November 2020, which included recommendations
conditions of the Creative Commons
                                            such as one-third of the workforce working from home, staggering work and lunch hours,
Attribution (CC BY) license (https://
                                            mask wearing in all indoor spaces, and suspending all nonessential business trips [4].
creativecommons.org/licenses/by/
4.0/).
                                            Following this, the social distancing level in other areas outside Seoul was raised to 1.5 on

Int. J. Environ. Res. Public Health 2021, 18, 5053. https://doi.org/10.3390/ijerph18105053                        https://www.mdpi.com/journal/ijerph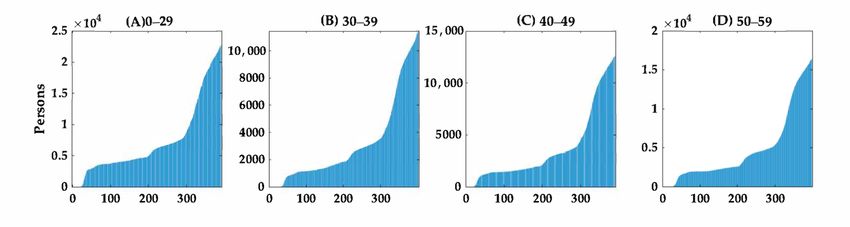
Int. J. Environ. Res. Public Health 2021, 18, 5053                                                                             2 of 11

                                        29 November [4]. On 8 December, the social distancing level was raised to level 2.5, the
                                        second highest in the country’s five-tier scheme, in metropolitan areas, and to level 2 in
                                        other areas [4]. As of 23 February 2021, South Korea was still experiencing a third wave of
                                        COVID-19 [6].
                                              Despite the implementation of these nonpharmaceutical interventions in South Korea,
                                        the number of cases and deaths have continued to rise. Severity estimates for COVID-19 are
                                        essential to assess the potential impact of the ongoing pandemic. The crude CFR is defined
                                        as the cumulative number of deaths divided by the cumulative number of cases. As of
                                        23 February 2021, the crude CFR in South Korea was estimated to be 1.79%, which was
                                        lower than the global average crude CFR of 2.22% [1]. However, the crude CFR does not
                                        accurately capture the increase in the number of fatal cases because of the delay between
                                        diagnosis and death; so called right-censoring. Therefore, it may underestimate the severity
                                        of the pandemic. However, the crude CFR may also overestimate the probability of death
                                        because the denominator is calculated based only on the number of confirmed cases. This
                                        is known as ascertainment bias, which describes the phenomenon of a surveillance system
                                        being much more likely to detect and diagnose severe and fatal cases than mild ones. The
                                        spectrum of symptomatic infections ranges from mild symptoms to critical conditions,
                                        which are characterized as respiratory failure, shock, and multiorgan dysfunction, and can
                                        result in death. Asymptomatic infections of COVID-19 have also been well documented,
                                        with 33% to 73% of all infected individuals being asymptomatic [7–9]. In South Korea,
                                        however, the percentage of COVID-19 positive tests has been reported to be relatively
                                        low (1.4%) and ranked the eleventh lowest positivity rate worldwide, which reflects the
                                        proactive implementation of widespread testing for COVID-19 and contact tracing for
                                        positive cases [6,10]. Furthermore, widespread testing undertaken by the Korea Disease
                                        Control and Prevention Agency (KDCA) has been considered to have effectively identified
                                        asymptomatic individuals, and case ascertainment in South Korea has been considered
                                        more complete than in many other settings, thus reducing ascertainment bias toward severe
                                        cases [10,11].
                                              To date, most published COVID-19 CFR estimates have not provided age-stratified
                                        estimates and have not reported on settings where case ascertainment is likely to be
                                        relatively complete. However, it is known that middle-aged and older adults have a higher
                                        incidence of severe acute respiratory syndrome coronavirus 2 (SARS-CoV-2) infection than
                                        younger individuals, older adults are more likely to develop severe COVID-19 [12], and
                                        COVID-19 mortality increases with age [7,13,14]. The Chinese Center for Disease Control
                                        and Prevention has reported CFRs of 8% and 15% among those aged 70–79 years and
                                        ≥80 years, respectively, in contrast to an all-age CFR of 2.3% [7]. Similarly, in the United
                                        Kingdom, the CFR among individuals aged ≥80 years is 20-fold higher than that among
                                        individuals aged 50–59 years [7]. Thus, it is essential to assess the age-specific CFR to
                                        gauge the severity of the SARS-CoV-2 pandemic.
                                              The global CFR of COVID-19 was reported to be 3% in initial studies [15], whereas
                                        country-specific crude CFRs have ranged from the lowest rates in Germany (0.7%) and
                                        South Korea (2.4%) to the highest rates in Canada (4.9%), the United States (5.4%), Spain
                                        (6.0%), the Netherlands (7.4%) and Italy (9.3%) [16–18]. To reduce the bias of the crude CFR,
                                        several CFR estimators have been proposed. For instance, prior studies have proposed
                                        adjusting the number of confirmed cases in the denominator by multiplying a factor [19–23].
                                        In a prior study concerning the CFR of COVID-19 in Canada, we showed that the estimated
                                        crude CFR would be 2.87% on 15 December 2020, whereas the adjusted CFR was estimated
                                        at 3.36% (credible interval [CrI] 3.29–3.43%) [24]. A previous study by Shim et al. on the
                                        risk of COVID-19-related death in South Korea estimated delay-adjusted CFRs but did
                                        not report age-stratified estimates [18]. Another study by Newall et al. [11] estimated age-
                                        specific CFRs for South Korea but only included incidence and mortality data up to 12 June
                                        2020, which comprised mainly data from the first wave, during which the reported crude
                                        CFR (2.31%) was higher than that reported in this study. In addition, based on data up to
                                        June 2020, the highest incidence occurred among younger adults aged 20–29 years, whereas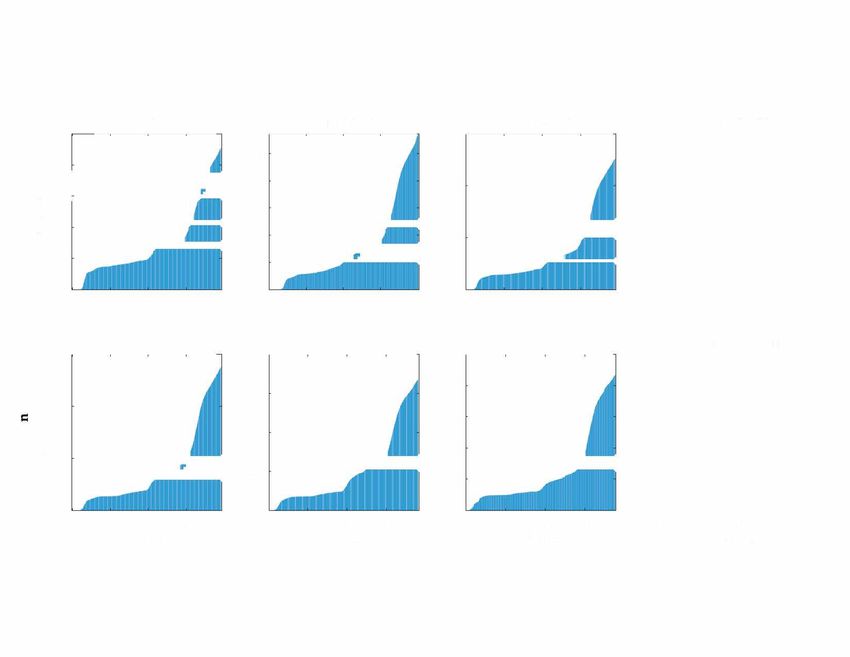
Int. J. Environ. Res. Public Health 2021, 18, 5053                                                                              3 of 11

                                        the cumulative age distribution of cases as of 23 February 2021 was closer to the South
                                        Korean population distribution. Hence, it is important to reassess the age-specific CFR
                                        based on updated data, including data from the second and third waves of the pandemic
                                        in South Korea.
                                             This study aimed to estimate the risk of death among confirmed cases, taking into
                                        account ascertainment bias and right-censoring using established methods [20,25]. Given
                                        the importance of delay-adjusted CFR estimates according to age, this study aimed to
                                        provide real-time estimates of adjusted age-specific CFR during the COVID-19 pandemic,
                                        and to identify the most vulnerable segments of the population in South Korea, through
                                        February 2021. The age-specific delay-adjusted CFR estimates in South Korea could be
                                        useful for estimating the impact of the COVID-19 pandemic in South Korea where large-
                                        scale testing has been implemented as a core disease control intervention.
                                             This paper is organized as follows. In Section 2, the data sources and the method to cal-
                                        culate delay-adjusted COVID-19 CFRs are presented. In Section 3, the results are presented,
                                        which include epidemiological characteristics of COVID-19 in South Korea and crude and
                                        delay-adjusted CFRs. Sections 4 and 5 focus on discussion and conclusions, respectively.

                                        2. Materials and Methods
                                        2.1. Data Sources
                                             Daily cumulative numbers of COVID-19 cases and deaths stratified according to age
                                        group were obtained from daily reports published by the KDCA [4]. The analysis used
                                        data reported from 20 February 2021 through 23 February 2021, from which the number of
                                        stratified polymerase chain reaction (PCR)-confirmed cases and deaths according to age
                                        groups was extracted, forming a time series. A confirmed diagnosis of COVID-19 was
                                        based on the detection of SARS-CoV-2 RNA using reverse-transcription PCR (RT-PCR).
                                        According to the KDCA’s Center for Laboratory Control of Infectious Diseases, the criterion
                                        for negative RT-PCR for SARS-CoV-2 is a cycle threshold (Ct) value of ≥37, whereas the
                                        positive upper limit of the Ct value is 35 [26]. The daily updates on COVID-19 cases were
                                        reported in age groups at 10-year intervals. Given there was one COVID-19 death recorded
                                        in those aged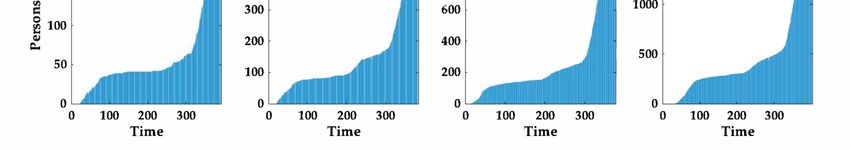
Int. J. Environ. Res. Public Health 2021, 18, 5053                                                                                                    4 of 11

                                               Using the equation above, the factor of underestimation can be rewritten as:
                                                                                        Z ∞
                                                                                  u=          exp(−rs) f (s)ds.
                                                                                         0

                                             If f (s) is the density of a gamma distribution, which is consistent with prior find-
                                        ings [28,29], with mean T and coefficient of variation v, an adjustment factor, u(t), can be
                                        used and defined as:
                                                                                          −1/v2
                                                                           u(t) = 1 + rTv2        .

                                             The maximum likelihood method was used to estimate the growth rate of the epidemic
                                        during COVID-19 by age group. To calculate the adjustment factor, ua , incidence data and
                                        the distribution of time from disease onset to death were used. Specifically, we considered
                                        the distribution of the time from onset to death, F(s), where F(s) was the density of a gamma
                                        distribution with a mean T (11.5 days) and a standard deviation (v2 ) of 6.6 days [4,11,20].
                                             Using the adjustment factor, the following equation was employed to create an unbi-
                                        ased estimator of the CFR, pt :
                                                                                         bt
                                                                                    pt =
                                                                                         ut
                                        where bt is a crude biased estimated CFR calculated at time t [20]. To account for the
                                        uncertainty in time from disease onset to death, and to generate 95% confidence intervals
                                        (CIs) in the CFR estimates, the distribution F(s) was varied by sampling the mean from
                                        a normal distribution with a mean of 11.5 days and a standard deviation of one day.
                                        The moment-generating function was then used to determine the adjusted CFR on each
                                        calendar day by running Monte Carlo simulations with 1000 independent replications [20].

                                        3. Results
                                        3.1. Epidemiological Characteristics of COVID-19 in South Korea
                                                       Among a total of 87,681 COVID-19 cases reported by the KDCA up to 23 February
                                                  2021, most reported cases involved persons aged 50–59 years (18.6%), followed by those
                                                  aged 60–69 years (15.7%) and 20–29 years (15.1%) (Figure 1) [4]. In contrast, the reported
                                                  deaths due to COVID-19 increased substantially with age, with 20.7% of a total 1573 deaths
                                                  occurring among those aged ≥80 years, followed by those aged 70–79 years (6.4%) and
       Int. J. Environ. Res. Public Health 2021, 18, x                                                              5 of 11
                                                  60–69 years (1.3%; Figure 1). There were no COVID-19 deaths recorded among individuals
                                                  aged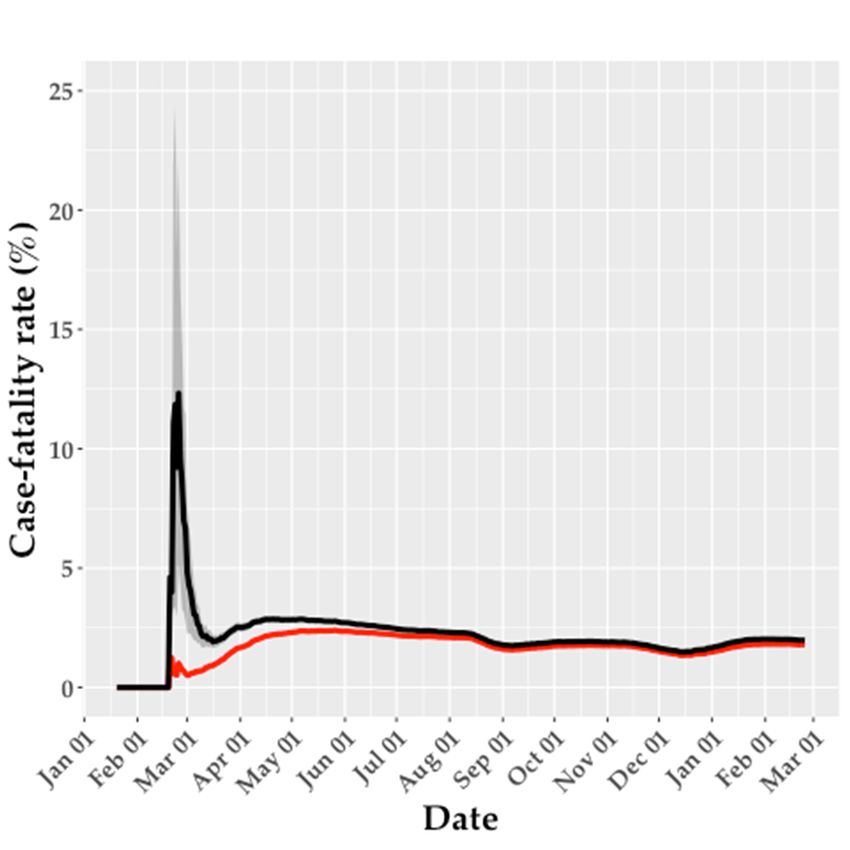
Int. J. Environ. Res. Public Health 2021, 18, 5053 5 of 11
Figure 1. Distribution of the population, COVID-19 cases, and COVID-19 deaths according to age
in South Korea, as of 23 February 2021.
Figure 2A shows the cumulative incidence rate according to age group. The cumula-
Figure 2A shows the cumulative incidence rate according to age group. The cu-
tive incidence rate across all ages was 0.17%, with the highest rate (0.23%) among individ-
mulative incidence rate across all ages was 0.17%, with the highest rate (0.23%) among
uals aged ≥80 years, followed by those aged 60–69 years (0.22%). The mortality rate per
individuals aged ≥80 years, followed by those aged 60–69 years (0.22%). The mortality rate
100,000 population
per 100,000directly in relation
population toin
directly COVID-19
relation toaccording
COVID-19 toaccording
age grouptoisage
shown
groupin is shown
Figure 2B.inIndividuals aged ≥80 years were most affected. Specifically, the mortality rate
Figure 2B. Individuals aged ≥80 years were most affected. Specifically, the mortality
per 100,000
rate per46.9
was among
100,000 wasindividuals
46.9 among aged ≥80 years,aged
individuals and ≥
11.9 amongand
80 years, those aged
11.9 70–79
among those aged
years, compared with compared
70–79 years, 3.0 for all ages.
with 3.0 for all ages.
Int. J. Environ. Res. Public Health 2021, 18, x 6 of 11
(A)
(B)
Figure 2. Mortality
Figure raterate
2. Mortality duedue
to COVID-19 according
to COVID-19 accordingtotoage
agegroup
groupininSouth
South Korea as of
Korea as of23
23February
February2021.
2021. (A)Cumulative
(A) CumulativeCOVID-19
COVID-19incidence
incidence rate
rate according
according toto age
age group;
group;(B)
(B)COVID-19
COVID-19mortality
mortality rate
rateaccording
accordingtotoage
agegroup.
group.
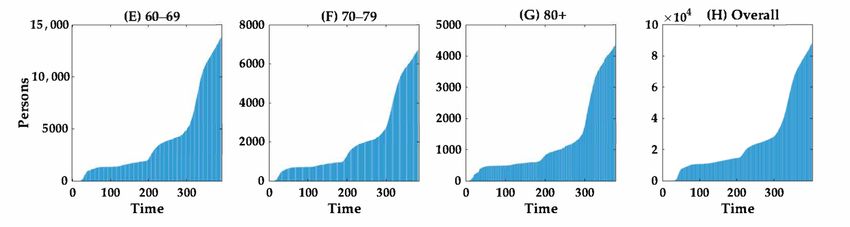
3.2. Evolution of Cases and Deaths according to Age Group
The cumulative numbers of cases and deaths according to age group over time are
shown in Figures 3 and 4, respectively. The curves suggest that the cumulative number of
cases of COVID-19 increased proportionally faster than the cumulative number of deaths.
The growth curve for the cumulative number of cases across all age groups increased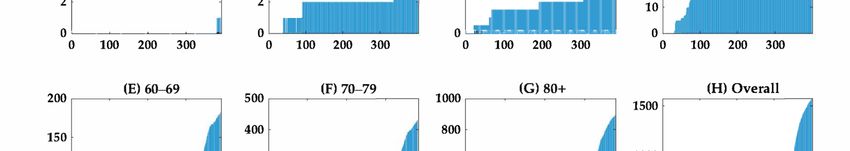
(B)
Int. J. Environ. Res. Public Health 2021, 18,Figure
5053 2. Mortality rate due to COVID-19 according to age group in South Korea as of 23 February
6 of 11
2021. (A) Cumulative COVID-19 incidence rate according to age group; (B) COVID-19 mortality
rate according to age group.
3.2.3.2. EvolutionofofCases
Evolution Casesand
andDeaths
DeathsAccording
according to
toAge
AgeGroup
Group
The
The cumulativenumbers
cumulative numbersof of cases
cases and
and deaths
deaths according
accordingtotoageagegroup
groupover
overtime
time are
are
shown in Figures 3 and 4, respectively. The curves suggest that the cumulative
shown in Figures 3 and 4, respectively. The curves suggest that the cumulative number number ofof
cases
cases ofof COVID-19increased
COVID-19 increasedproportionally
proportionally faster
faster than
thanthethecumulative
cumulativenumber
number ofof
deaths.
deaths.
The growth curve for the cumulative number of cases across all age groups
The growth curve for the cumulative number of cases across all age groups increased more increased
more rapidly
rapidly after dayafter
275day
(20275 (20 November
November 2020),2020),
duringduring the third
the third wave, wave,
thanthan prior
prior to this
to this date.
date. Notably,
Notably, the number
the number of fatalofcases
fatalincreased
cases increased dramatically
dramatically with with age (Figure
age (Figure 4). 4).
Int. J. Environ. Res. Public Health 2021, 18, x 7 of 11
Figure 3. Temporal distribution of cumulative COVID-19 cases according to age group in South Korea from 20 February
Figure 3. Temporal distribution of cumulative COVID-19 cases according to age group in South Korea from 20 February
20212021
to 23
to February
23 February2021. The
2021. cumulative
The cumulativenumber
numberof ofCOVID-19
COVID-19 cases are shown
cases are shownaccording
accordingtotothe
thefollowing
following age
age groups:
groups:
(A) (A)
0–290–29
years, (B) 30–39 years, (C) 40–49 years, (D) 50–59 years, (E) 60–69 years,
years, (B) 30–39 years, (C) 40–49 years, (D) 50–59 years, (E) 60–69 years, (F) 70–79 years, (G) ≥ 80 years and
70–79 years, (G) ≥80 years and (H)(H)
allall
cases.
cases. DayDay 1 corresponds
1 corresponds to to
2020 February
February 2021.The
2021. Thescale
scaleon
onthe
theY-axis
Y-axis differs according
accordingtotoage
agegroup.
group.
Figure 4. Temporal distribution of cumulative COVID-19 deaths according to age group in South Korea from 20 February
Figure 4. Temporal distribution of cumulative COVID-19 deaths according to age group in South Korea from 20 February
20212021
to 23
to February 2021.
23 February The
2021. cumulative
The cumulativenumber
numberof ofCOVID-19
COVID-19 deaths are shown
deaths are shownaccording
accordingtotothe
thefollowing
following age
age groups:
groups:
(A) (A)
0–290–29
years, (B)(B)
years, 30–39 years,
30–39 (C)(C)
years, 40–49
40–49years, (D)
years, (D)50–59
50–59years,
years,(E)
(E)60–69
60–69 years,
years, (F) 70–79
70–79 years,
years,(G)
(G)≥80≥80years
years and
and (H)
(H) allall
COVID-19
COVID-19 deaths.
deaths. DayDay 1 corresponds
1 corresponds toto2020February
February2021.
2021.The
Thescale
scale on
on the Y-axis
Y-axis differs
differsaccording
accordingtotoageagegroup.
group.
3.3. Crude and Delay-Adjusted Risk of Death
The crude and delay-adjusted CFRs were relatively similar, overall, although the de-
lay-adjusted CFR was highly unstable early in the epidemic (Table 1 and Figure 5). The
early rise in the adjusted CFR occurred because both the number of deaths and the num-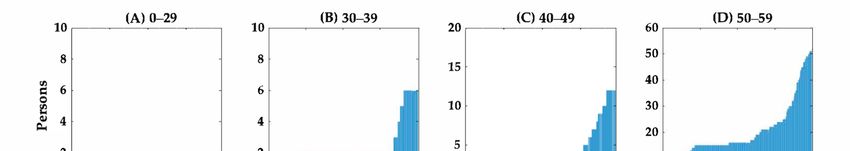
Int. J. Environ. Res. Public Health 2021, 18, 5053 7 of 11
3.3. Crude and Delay-Adjusted Risk of Death
The crude and delay-adjusted CFRs were relatively similar, overall, although the
delay-adjusted CFR was highly unstable early in the epidemic (Table 1 and Figure 5).
The early rise in the adjusted CFR occurred because both the number of deaths and the
number of cases reported increased at approximately the same time in late February 2020.
During this period, the denominator, that is, the number of cases predicted to have a
known outcome (survived or died), was relatively low, resulting in unstable estimates
of the adjusted CFR. However, the delay-adjusted CFR stabilized over time because the
outcomes of most cases, either recovery or death, were known by the endpoint of the
analysis when enough time had elapsed from the peak in cases.
Table 1. Summary results of cumulative time-delay-adjusted COVID-19 case fatality rates according
to age group in South Korea (23 February 2021).
Age Group Latest Estimate Range of Median Crude Case
(Years) (95% CrI) Estimates Fatality Rate
0–29 0.00% (0.00–0.01%) 0.00–0.01% 0.00%
30–39 0.06% (0.06–0.06%) 0.04–6.17% 0.05%
40–49 0.11% (0.10–0.11%) 0.09–27.17% 0.10%
50–59 0.35% (0.34–0.36%) 0.29–20.41% 0.32%
Int. J. Environ. Res. Public Health 2021, 18, x 8 of 11
60–69 1.46% (1.44–1.49%) 1.14–37.35% 1.32%
70–79 7.09% (7.00–7.21%) 5.75–29.13% 6.41%
80+ 22.88% (22.48–23.29%) 16.57–35.95% 20.61%
All ages
CrI: credible interval. 1.97% (1.94–2.00%) 1.49–12.33% 1.79%
CrI: credible interval.
Figure 5. Crude
Figure 5. Crude case fatality rate (CFR;
(CFR; red
red line)
line) and
andadjusted
adjustedCFR
CFRestimates
estimates(black
(blackline)
line)ininSouth
South
Korea up
Korea up to 23 February 2021.
2021. The
Theshaded
shadedarea
areaaround
aroundthe
theblack
blackline
lineillustrates
illustratesthe
the95%
95%credible
credible
interval (CrI)
interval (CrI) for
for the
theadjusted
adjustedCFR.
CFR.
Both
Both the
the crude
crude and
and delay-adjusted
delay-adjusted CFR
CFR estimates
estimates increased
increased substantially
substantially with
with age.
age.
Among
Among all age groups,
groups, older
olderadults
adultswere
werethe
themost
mostseverely
severely affected.
affected. TheThe time-delay
time-delay ad-
adjusted CFRs were 22.88% (95% CrI: 22.48–23.29%) for those aged ≥ 80 years
justed CFRs were 22.88% (95% CrI: 22.48–23.29%) for those aged ≥80 years and 7.09% (95% and 7.09%
(95% CrI: 7.00–7.21%)
CrI: 7.00–7.21%) amongamongthosethose
agedaged
70–7970–79
years,years, compared
compared to anto an overall
overall CFR ofCFR of 1.97%
1.97% (95%
(95% CrI: 1.94–2.00%)
CrI: 1.94–2.00%) for allfor all ages
ages combined.
combined.
4. Discussion
In this study, the time-delay adjusted CFR according to age group was estimated for
the ongoing COVID-19 pandemic in South Korea. Consistent with previous studies that
estimated the time-delay adjusted COVID-19 CFR according to age group [11,30,31], both
the crude and the delay-adjusted CFRs for South Korea increased rapidly with age. Spe-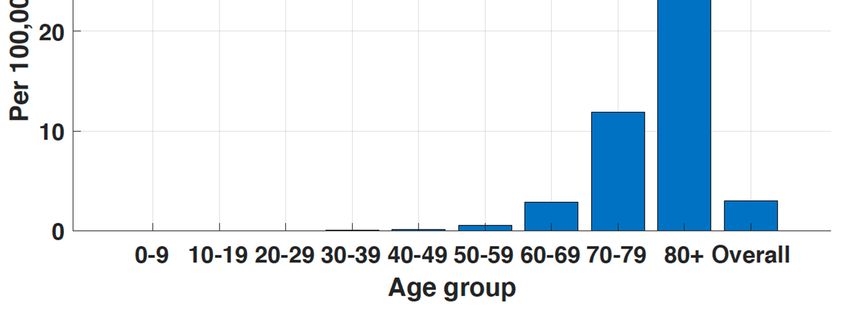
Int. J. Environ. Res. Public Health 2021, 18, 5053                                                                               8 of 11

                                        4. Discussion
                                             In this study, the time-delay adjusted CFR according to age group was estimated for
                                        the ongoing COVID-19 pandemic in South Korea. Consistent with previous studies that
                                        estimated the time-delay adjusted COVID-19 CFR according to age group [11,30,31], both
                                        the crude and the delay-adjusted CFRs for South Korea increased rapidly with age. Specifi-
                                        cally, it was shown that the COVID-19 pandemic in South Korea has disproportionately
                                        affected adults aged ≥70 years, despite the relatively low overall adjusted CFR (1.97%)
                                        for all ages combined. This finding highlights the importance of determining age-specific
                                        CFRs, in addition to the overall CFR, when assessing the risk of mortality associated with
                                        COVID-19. Furthermore, this study found that both the delay-adjusted and crude CFRs
                                        showed substantial variations especially at the beginning of the pandemic in South Korea.
                                        Similar patterns have been observed in previous studies concerning delay-adjusted CFRs
                                        conducted in South Korea and other countries [11,25,31,32]. Thus, these results highlight
                                        that caution must be applied when interpreting CFRs, particularly earlier in the pandemic,
                                        even with adjustment for the delay between diagnosis and death. Moreover, there is likely
                                        to have been substantial variation in terms of delay in notification of confirmed cases and
                                        deaths throughout the pandemic, further complicating the interpretation of CFRs in the
                                        early phase, partially due to changes in surveillance and reporting practices. In the United
                                        Kingdom, the reporting delay is reported to have decreased over time [33].
                                             The age structure of affected populations should be considered when comparing CFRs
                                        among countries. Therefore, age-specific estimates of the CFR would be very useful when
                                        comparing CFRs of countries with differing age structures. Age-specific CFRs suggest that
                                        countries with aging populations may experience higher COVID-19-related CFRs than
                                        countries with more youthful populations, as shown in Italy [14]. While the population
                                        in South Korea is aging at a rapid rate, the proportion of the population aged ≥65 years
                                        is 13.9%, which is relatively low in comparison to highly affected countries such as the
                                        U.S. (15.4%), Spain (19.4%), France (19.7%), Germany (21.5%), Bulgaria (20.8%) and Italy
                                        (23.0%) [34]. In China and Italy, COVID-19 cases have primarily involved older adult
                                        populations, whereas in South Korea a higher proportion of younger individuals (aged
                                        20–29 years) have been affected than in other countries [35]. In Korea, the relatively low
                                        CFR is likely to reflect the age distribution of the cases, and could also have resulted from
                                        the larger proportion of cases being confirmed among younger individuals, leading to
                                        a larger denominator in relation to this low-risk population. Hence, the demographic
                                        distribution of cases in South Korea, good access to healthcare, and the population age
                                        structure, favor a lower overall CFR than in countries with a relatively older population [36].
                                             This study has some limitations. First, while the successful control of the pandemic in
                                        South Korea suggests a relatively high level of case ascertainment, a seroprevalence survey
                                        conducted in Daegu found evidence of substantial numbers of undiagnosed cases in South
                                        Korea [37]. The CFR estimates are likely to be affected by under ascertainment, which
                                        might result in overestimation of the CFR if the surveillance system preferentially captured
                                        the most severe cases, as has been reported in some other countries [38–40]. Second,
                                        South Korean data include a proportion of asymptomatic cases but not all asymptomatic
                                        cases; thus, these estimates represent neither a complete estimate of the CFR among
                                        symptomatic cases of COVID-19 nor of the CFR involving all cases with SARS-CoV-2
                                        infections. Third, the demographic distribution of cases has evolved over time throughout
                                        the pandemic, which affects the delay in reporting due to the age-related variation in
                                        susceptibility to symptomatic infection. Younger individuals who generally suffer milder
                                        (or asymptomatic) infection may have been under-represented as a result, and/or had
                                        a longer delay from symptom onset to death. The COVID-19 pandemic in South Korea
                                        moved from initial clusters related to a religious group in Daegu, predominantly affecting
                                        females aged 20–29 years, to involve more widely distributed cases among all age groups
                                        in the community. This shift might have affected the delay, but the distribution of delay
                                        was fixed in this analysis [41]. Furthermore, the publicly available data from the KDCA
                                        did not include daily data stratification according to age and sex for the entire period; thus,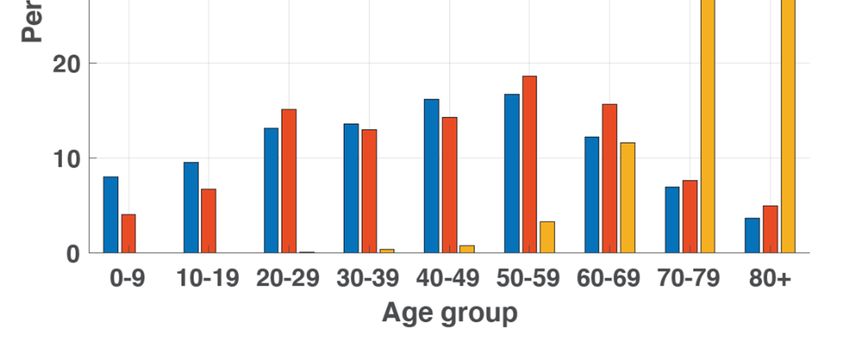
Int. J. Environ. Res. Public Health 2021, 18, 5053                                                                                   9 of 11

                                        the estimates of CFR in this study were stratified only according to age and not according
                                        to sex. Although important differences in CFR according to age were identified in this
                                        study, future research should include other independent predictors of mortality risk for
                                        COVID-19, such as pre-existing conditions including hypertension, diabetes mellitus and
                                        cardiovascular disease, and risk factors such as an increased body mass index [42].

                                        5. Conclusions
                                             This study used real-time epidemiological data in South Korea, which is a setting
                                        with high rates of testing for COVID-19, and found that older adults, especially those aged
                                        ≥70 years, were disproportionately affected due to the COVID-19 pandemic, consistent
                                        with previous studies conducted in other regions. These results suggest that intervention
                                        strategies against COVID-19 should target older adults and should seek to improve adher-
                                        ence with preventive measures among this group to maximize the effect of interventions
                                        on minimizing the number of deaths.

                                        Funding: This work was supported by the National Research Foundation of Korea (NRF) grant
                                        funded by the Korea government (MSIT) [No. 2018R1C1B6001723].
                                        Institutional Review Board Statement: Ethical review and approval were waived for this study as
                                        only aggregated publicly available data were used.
                                        Data Availability Statement: The daily number of confirmed cases and deaths associated with
                                        COVID-19 in South Korea was obtained from publicly available sources, available at https://www.
                                        cdc.go.kr (accessed on 15 April 2021).
                                        Conflicts of Interest: The author declares no conflict of interest.

References
1.    WHO COVID-19 Weekly Epidemiological Update. Available online: https://www.who.int/emergencies/diseases/novel-
      coronavirus-2019/situation-reports (accessed on 6 January 2021).
2.    Walker, P.G.; Whittaker, C.; Watson, O.J.; Baguelin, M.; Winskill, P.; Hamlet, A.; Djafaara, B.A.; Cucunubá, Z.; Mesa, D.O.; Green,
      W.; et al. The impact of COVID-19 and strategies for mitigation and suppression in low-and middle-income countries. Science
      2020, 369, 413–422. [CrossRef]
3.    Reed, C.; Biggerstaff, M.; Finelli, L.; Koonin, L.M.; Beauvais, D.; Uzicanin, A.; Plummer, A.; Bresee, J.; Redd, S.C.; Jernigan, D.B.;
      et al. Novel framework for assessing epidemiologic effects of influenza epidemics and pandemics. Emerg. Infect. Dis. 2013, 19, 85.
      [CrossRef]
4.    The Updates of COVID-19 in Republic of Korea. Available online: http://www.kdca.go.kr/board/board.es?mid=a20501010000
      &bid=0015 (accessed on 2 March 2021).
5.    Normile, D. Coronavirus cases have dropped sharply in South Korea. What’s the secret to its success. Science 2020, 17, 1–2.
      [CrossRef]
6.    Share of Total COVID-19 Tests that Were Positive. Available online: https://ourworldindata.org/grapher/covid-19-positive-
      rate-bar (accessed on 2 March 2021).
7.    Wu, Z.; McGoogan, J.M. Characteristics of and important lessons from the coronavirus disease 2019 (COVID-19) outbreak
      in China: Summary of a report of 72,314 cases from the Chinese center for disease control and prevention. JAMA 2020, 323,
      1239–1242. [CrossRef]
8.    Oran, D.P.; Topol, E.J. The proportion of SARS-CoV-2 infections that are asymptomatic: A systematic review. Ann. Intern. Med.
      2021. [CrossRef]
9.    Sakurai, A.; Sasaki, T.; Kato, S.; Hayashi, M.; Tsuzuki, S.-i.; Ishihara, T.; Iwata, M.; Morise, Z.; Doi, Y. Natural history of
      asymptomatic SARS-CoV-2 infection. N. Engl. J. Med. 2020, 383, 885–886. [CrossRef] [PubMed]
10.   Workman, J. The proportion of COVID-19 cases that are asymptomatic in South Korea: Comment on Nishiura et al. Int. J. Infect.
      Dis. 2020, 96, 398. [CrossRef]
11.   Newall, A.; Leong, R.; Nazareno, A.; Muscatello, D.; Wood, J.; Kim, W. Delay-adjusted age-and sex-specific case fatality rates for
      COVID-19 in South Korea: Evolution in the estimated risk of mortality throughout the epidemic. Int. J. Infect. Dis. 2020, 101,
      306–311. [CrossRef]
12.   Verity, R.; Okell, L.C.; Dorigatti, I.; Winskill, P.; Whittaker, C.; Imai, N.; Cuomo-Dannenburg, G.; Thompson, H.; Walker, P.G.;
      Fu, H. Estimates of the severity of coronavirus disease 2019: A model-based analysis. Lancet Infect. Dis. 2020, 20, 669–677.
      [CrossRef]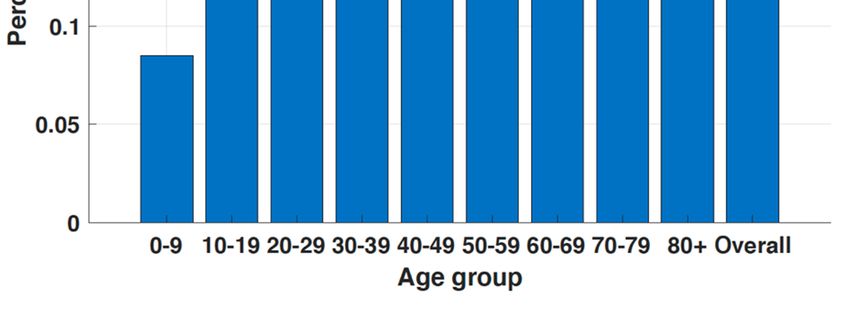
Int. J. Environ. Res. Public Health 2021, 18, 5053                                                                                  10 of 11

13.   Richardson, S.; Hirsch, J.S.; Narasimhan, M.; Crawford, J.M.; McGinn, T.; Davidson, K.W.; Barnaby, D.P.; Becker, L.B.; Chelico, J.D.;
      Cohen, S.L. Presenting characteristics, comorbidities, and outcomes among 5700 patients hospitalized with COVID-19 in the New
      York City area. JAMA 2020, 323, 2052–2059. [CrossRef]
14.   Onder, G.; Rezza, G.; Brusaferro, S. Case-fatality rate and characteristics of patients dying in relation to COVID-19 in Italy. JAMA
      2020, 323, 1775–1776. [CrossRef] [PubMed]
15.   Wang, C.; Horby, P.W.; Hayden, F.G.; Gao, G.F. A novel coronavirus outbreak of global health concern. Lancet 2020, 395, 470–473.
      [CrossRef]
16.   Sudharsanan, N.; Didzun, O.; Barnighausen, T.; Geldsetzer, P. The contribution of the age distribution of cases to COVID-19 case
      fatality across countries: A nine-country demographic study. Ann. Intern. Med. 2020, 173, 714–720. [CrossRef] [PubMed]
17.   Abdollahi, E.; Champredon, D.; Langley, J.M.; Galvani, A.P.; Moghadas, S.M. Temporal estimates of case-fatality rate for
      COVID-19 outbreaks in Canada and the United States. CMAJ 2020, 192, E666–E670. [CrossRef] [PubMed]
18.   Shim, E.; Mizumoto, K.; Choi, W.; Chowell, G. Estimating the risk of COVID-19 death during the course of the outbreak in Korea,
      February–May 2020. J. Clin. Med. 2020, 9, 1641. [CrossRef] [PubMed]
19.   Yoshikura, H. Two parameters characterizing 2009 H1N1 swine influenza epidemic in different countries/regions of the world.
      Jpn. J. Infect. Dis. 2009, 62, 411–412. [PubMed]
20.   Nishiura, H.; Klinkenberg, D.; Roberts, M.; Heesterbeek, J.A. Early epidemiological assessment of the virulence of emerging
      infectious diseases: A case study of an influenza pandemic. PLoS ONE 2009, 4, e6852. [CrossRef]
21.   Chen, Z.; Akazawa, K.; Nakamura, T. Estimating the case fatality rate using a constant cure-death hazard ratio. Lifetime Data Anal.
      2009, 15, 316–329. [CrossRef]
22.   Garske, T.; Legrand, J.; Donnelly, C.A.; Ward, H.; Cauchemez, S.; Fraser, C.; Ferguson, N.M.; Ghani, A.C. Assessing the severity of
      the novel influenza A/H1N1 pandemic. BMJ 2009, 339, b2840. [CrossRef]
23.   Ejima, K.; Omori, R.; Cowling, B.J.; Aihara, K.; Nishiura, H. The time required to estimate the case fatality ratio of influenza using
      only the tip of an iceberg: Joint estimation of the virulence and the transmission potential. Comput. Math. Methods Med. 2012,
      2012, 978901. [CrossRef]
24.   Shim, E. Regional variability in COVID-19 case fatality rate in Canada, February–December 2020. Int. J. Environ. Res. Public Health
      2021, 18, 1839. [CrossRef] [PubMed]
25.   Kayano, T.; Nishiura, H. A Comparison of Case Fatality Risk of COVID-19 between Singapore and Japan. J. Clin. Med. 2020,
      9, 3326. [CrossRef] [PubMed]
26.   Kim, J.Y. Letter to the editor: Case of the index patient who caused tertiary transmission of coronavirus disease 2019 in Korea:
      The application of Lopinavir/Ritonavir for the treatment of COVID-19 pneumonia monitored by quantitative RT-PCR. J. Korean
      Med. Sci. 2020, 35, e88. [CrossRef]
27.   Kobayashi, T.; Jung, S.-m.; Linton, N.M.; Kinoshita, R.; Hayashi, K.; Miyama, T.; Anzai, A.; Yang, Y.; Yuan, B.; Akhmetzhanov, A.R.;
      et al. Communicating the risk of death from novel coronavirus disease (COVID-19). J. Clin. Med. 2020, 9, 580. [CrossRef]
      [PubMed]
28.   Hawryluk, I.; Mellan, T.A.; Hoeltgebaum, H.; Mishra, S.; Schnekenberg, R.P.; Whittaker, C.; Zhu, H.; Gandy, A.; Donnelly, C.A.;
      Flaxman, S.; et al. Inference of COVID-19 epidemiological distributions from Brazilian hospital data. J. R. Soc. Interface 2020, 17,
      20200596. [CrossRef]
29.   Wu, J.T.; Leung, K.; Bushman, M.; Kishore, N.; Niehus, R.; de Salazar, P.M.; Cowling, B.J.; Lipsitch, M.; Leung, G.M. Estimating
      clinical severity of COVID-19 from the transmission dynamics in Wuhan, China. Nat. Med. 2020, 26, 506–510. [CrossRef]
30.   Munayco, C.; Chowell, G.; Tariq, A.; Undurraga, E.A.; Mizumoto, K. Risk of death by age and gender from CoVID-19 in Peru,
      March–May, 2020. Aging 2020, 12, 13869. [CrossRef]
31.   Undurraga, E.A.; Chowell, G.; Mizumoto, K. COVID-19 case fatality risk by age and gender in a high testing setting in f America:
      Chile, March–August 2020. Infect. Dis. Poverty 2021, 10, 11. [CrossRef]
32.   Mizumoto, K.; Dahal, S.; Chowell, G. Spatial variability in the risk of death from COVID-19 in Italy. Int. J. Tuberc. Lung Dis. 2020,
      24, 829–837. [CrossRef]
33.   Gutierrez, E.; Rubli, A.; Tavares, T. Delays in death reports and their implications for tracking the evolution of COVID-19. SSRN
      Electron. J. 2020. [CrossRef]
34.   Population Ages 65 and above (% of Total Population). Available online: https://data.worldbank.org/indicator/SP.POP.65UP.
      TO.ZS?name_desc=false&view=chart (accessed on 28 February 2021).
35.   Liu, J.; Xu, J.; Sun, C.; Wang, J.; Wang, X.; Chen, X.; Gao, S. Age-stratified analysis of SARS-CoV-2 infection and case fatality rate
      in China, Italy, and South Korea. Eur. Rev. Med. Pharmacol. Sci. 2020, 24, 12575–12578.
36.   Rath, R.S.; Lohiya, A.; Ahamed, F.; Kathiresan, J.; Suliankatchi, R.A. Public health response to COVID-19 in selected countries—
      Hits and misses. J. Fam. Med. Prim. Care 2020, 9, 5580.
37.   Song, S.-K.; Lee, D.-H.; Nam, J.-H.; Kim, K.-T.; Do, J.-S.; Kang, D.-W.; Kim, S.-G.; Cho, M.-R. IgG seroprevalence of COVID-19
      among individuals without a history of the coronavirus disease infection in Daegu, Korea. J. Korean Med. Sci. 2020, 35, e269.
      [CrossRef] [PubMed]
38.   Hauser, A.; Counotte, M.J.; Margossian, C.C.; Konstantinoudis, G.; Low, N.; Althaus, C.L.; Riou, J. Estimation of SARS-CoV-2
      mortality during the early stages of an epidemic: A modeling study in Hubei, China, and six regions in Europe. PLoS Med. 2020,
      17, e1003189. [CrossRef] [PubMed]
Int. J. Environ. Res. Public Health 2021, 18, 5053 11 of 11
39. Jung, S.-m.; Akhmetzhanov, A.R.; Hayashi, K.; Linton, N.M.; Yang, Y.; Yuan, B.; Kobayashi, T.; Kinoshita, R.; Nishiura, H.
Real-time estimation of the risk of death from novel coronavirus (COVID-19) infection: Inference using exported cases. J. Clin.
Med. 2020, 9, 523. [CrossRef]
40. Pan, A.; Liu, L.; Wang, C.; Guo, H.; Hao, X.; Wang, Q.; Huang, J.; He, N.; Yu, H.; Lin, X. Association of public health interventions
with the epidemiology of the COVID-19 outbreak in Wuhan, China. JAMA 2020, 323, 1915–1923. [CrossRef]
41. Korean Society of Infectious Diseases; Korean Society of Pediatric Infectious Diseases; Korean Society of Epidemiology; Korean
Society for Antimicrobial Therapy; Korean Society for Healthcare-associated Infection Control and Prevention. Korea Centers for
Disease Control and Prevention.s Report on the epidemiological features of coronavirus disease 2019 (COVID-19) outbreak in the
Republic of Korea from January 19 to March 2, 2020. J. Korean Med. Sci. 2020, 35, e112. [CrossRef]
42. Pigoga, J.L.; Joiner, A.P.; Chowa, P.; Luong, J.; Mhlanga, M.; Reynolds, T.A.; Wallis, L.A. Evaluating capacity at three government
referral hospital emergency units in the kingdom of Eswatini using the WHO Hospital Emergency Unit Assessment Tool. BMC
Emerg. Med. 2020, 20, 33. [CrossRef]You can also read