U.S. Farm Policy: Revenue Support Program Outlays, 2014-2020 - October 5, 2020
←
→
Page content transcription
If your browser does not render page correctly, please read the page content below
U.S. Farm Policy: Revenue Support Program
Outlays, 2014-2020

October 5, 2020

                             Congressional Research Service
                              https://crsreports.congress.gov
                                                     R46561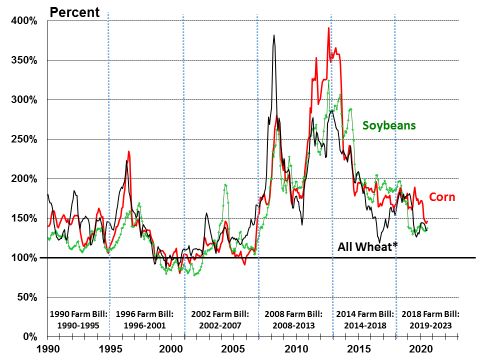
SUMMARY

                                                                                                      R46561
U.S. Farm Policy: Revenue Support Program
                                                                                                      October 5, 2020
Outlays, 2014-2020
                                                                                                      Randy Schnepf
Provisions of Title I of the 2018 farm bill (Agriculture Improvement Act of 2018; P.L. 115-334)       Specialist in Agricultural
authorize a set of revenue support programs for major program crops for crop years 2019-2023 as       Policy
part of the so-called farm safety net. This includes three principal revenue support programs—
Marketing Assistance Loan (MAL), Agricultural Risk Coverage (ARC), and Price Loss Coverage
(PLC). Participation in these revenue support programs is free. However, individuals must sign
up their base acres for ARC and PLC and comply with certain requirements to be eligible for
payments.

Under the MAL, PLC, and ARC programs, most grain, oilseed, and pulse crop producers in the United States are eligible for
two tiers of revenue support. The first tier of support is provided by the MAL program in the form of a price floor and interim
financing—a nonrecourse, nine-month loan at statutory loan rates for harvested production of eligible crops (referred to as
loan crops). The MAL program may be supplemented by a higher, second tier of revenue support comprised of either (1) the
PLC program, which provides price protection at the national level via statutorily fixed “reference” prices for eligible crops,
or (2) the ARC program, which provides revenue protection via historical moving average revenue guarantees at the county
or whole-farm levels.

The ARC and PLC programs were first authorized under the 2014 farm bill (Agricultural Act of 2014; P.L. 113-79) for the
crop years 2014-2018. At the start of the 2014 farm bill, participating producers were offered a one-time opportunity to enroll
their historical program acres (referred to as “base” acres), on a crop-by-crop basis, for either ARC or PLC. Under the 2014
enrollment, 76% of base acres—including 93% of corn, 97% of soybeans, and 58% of wheat—signed up for the county-level
ARC program. The high ARC sign-up for these crops was due to record or near-record farm prices during the 2010-2013
period. These historically high prices factored into the ARC revenue guarantee formula and assured producers of receiving
payments during 2014-2016. However, in recent years, market conditions have turned in favor of PLC. The 2018 farm bill’s
first sign-up (for the crop years 2019 and 2020) allowed producers to reallocate base acres between ARC and PLC. Under
this new enrollment, producers overwhelmingly shifted away from ARC and to PLC for all crops, as 70% of total enrolled
base acres elected to participate in the PLC program.

Payments under the MAL, ARC, and PLC programs vary countercyclically with market conditions—that is, payments tend to
increase when farm prices fall below support levels and decline when farm prices rise above support levels. Such a price-
contingent approach has long been part of U.S. farm policy, using programs with different names but related attributes. Since
2010, farm prices for most program crops have risen substantially above their statutorily fixed MAL loan rates, and the MAL
program has diminished in effectiveness as a floor price, particularly for corn and soybean producers. Total MAL program
outlays averaged $205 million per year during the five-year period (2014-2018) of the 2014 farm bill. In contrast, combined
payments under ARC and PLC averaged $5.2 billion per year during the same five-year period. This included substantial
combined payments during the first three years of the 2014 farm bill period—$5.3 billion in 2014, $7.9 billion in 2015, and
$7.0 billion in 2016—driven largely by strong ARC payments. By 2017, farm prices for most program crops had fallen below
their respective reference prices, and PLC payments had risen in importance relative to ARC. ARC and PLC payments fell to
$3.1 billion and $2.6 billion, respectively, in 2017 and 2018. Under the 2018 farm bill sign-up, producers shifted enrollment
of their eligible base acres away from ARC and to PLC. This enrollment shift, coupled with projections (U.S. Department of
Agriculture [USDA], February 2020) of weak farm prices for most program crops over the 2019-2023 period, suggest that
USDA will make substantially larger PLC payments than ARC payments under the 2018 farm bill.

ARC and PLC implementation and operational issues of potential interest to Congress include the delayed payment schedule
under both programs—payments do not occur until at least a year after the enrolled crop is harvested. Congress may also
want to consider potential inequities among program crops related to statutory reference prices relative to market conditions,
as some crops have received larger per-acre program payments with greater frequency than others. Finally, another potential
issue is the extent to which the general level of farm prices has moved above MAL loan rates, thus diminishing their
functionality as floor prices for eligible crops.

Congressional Research Service
U.S. Farm Policy: Revenue Support Program Outlays, 2014-2020
Contents
Introduction ................................................................................................................... 1
Two Tiers of Revenue Support .......................................................................................... 1
ARC and PLC Enrollment Under the 2014 and 2018 Farm Bills ....................................... 5
Participation Shifts from ARC to PLC Under 2018 Farm Bill ........................................... 6
Program Outlays Reflect Market Conditions ....................................................................... 9
MAL Program Support Levels Are Low Relative to Farm Prices....................................... 9
ARC and PLC Outlays Large in 2014-2016, Declined in 2017-2018................................ 11
Comparison Between ARC and PLC Outlays by Commodity .................................... 12
Comparison of ARC and PLC Outlays per Base Acre............................................... 12
ARC and PLC Have a Delayed Payments Structure ................................................. 14
Issues for Congress ....................................................................................................... 17
Figures
Figure 1. Price Loss Coverage (PLC) Payment Formula ........................................................ 2
Figure 2. PLC Low-Price Scenario for Rice......................................................................... 2
Figure 3. County-Level Agricultural Risk Coverage (ARC) Payment Formula.......................... 3
Figure 4. ARC Low-Revenue Scenario for Corn .................................................................. 3
Figure 5. Base Acres Enrolled Under 2014 and 2018 Farm Bills ............................................. 5
Figure 6. Enrollment of Base Acres by Program: PLC, ARC, and ARC-IC ............................... 7
Figure 7. PLC Participation Rate: 2014 Versus 2018 Farm Bills ............................................. 7
Figure 8. MYAP as % of Reference Price for Corn, Soybeans, and Wheat Since 2005................ 8
Figure 9. Monthly Farm Prices as % of MAL Loan Rate Since 1990 ..................................... 10
Figure 10. MAL, PLC, and ARC Program Outlays, 2014-2023F........................................... 11
Figure 11. Combined ARC and PLC Outlays by Commodity, 2014-2018............................... 12
Figure 12. Average Annual ARC and PLC Payment Rates per Base Acre ............................... 13
Figure 13. Schedule for 2020 Corn ARC and PLC Payments ............................................... 14
Figure 14. ARC and PLC Payments by Crop Year, Calendar Year, and Fiscal Year .................. 16
Tables
Table 1. Marketing Year and Payment Date for Major Covered Crops, 2020 Crop Year ............ 15
Table 2. Farm Prices, MAL Loan Rates, and Effective Reference Prices ................................ 19
Contacts
Author Information ....................................................................................................... 20
Congressional Research ServiceU.S. Farm Policy: Revenue Support Program Outlays, 2014-2020
Introduction
Provisions of Title I of the 2018 farm bill (Agriculture Improvement Act of 2018; P.L. 115-334)
authorize a set of revenue support programs for eligible crops for crop years 2019-2023 as part of
the so-called farm safety net. This includes three revenue support programs—Marketing
Assistance Loan (MAL), Agricultural Risk Coverage (ARC), and Price Loss Coverage (PLC)—
that are available for most grain, oilseed, and pulse crops in the United States. 1 Participation in
these revenue support programs is free. However, individuals must sign up their base acres for
ARC and PLC and comply with certain requirements to be eligible for payments. 2
Title I authorizes separate revenue support programs for dairy and sugar. 3 Specialty crops—such
as fruits, vegetables, and tree nuts—are not covered by revenue support programs.4
The revenue support programs are implemented by the Farm Service Agency within the U.S.
Department of Agriculture (USDA) and are funded through the Commodity Credit Corporation. 5
Producers must meet eligibility requirements to participate in the Title I commodity programs. 6 In
addition, producers that receive benefits under most of these programs are subject to annual
payment limits.
Although the ARC and PLC programs have been in existence since 2014, the delayed nature of
payments under these two programs has made it difficult for policymakers to assess their
effectiveness. This report examines available USDA program data to compare participation rates
and annual outlays for the three revenue support programs—MAL, ARC, and PLC—for 2014-
2018 based on historical data, along with projected outlays for 2019-2023 based on projections by
the Food and Agricultural Policy Research Institute (FAPRI) of the University of Missouri. The
report ends with a discussion of issues related to MAL, ARC, and PLC that may be of potential
interest to Congress.
Two Tiers of Revenue Support
Under the MAL, ARC, and PLC programs, most grain, oilseed, and pulse crop producers in the
United States are eligible for two tiers of revenue support (see text box below). 7
1 In addition to revenue support programs, T itle I authorizes the noninsured disaster assistance program for
commodities not eligible for crop insurance and modifies the permanent disaster assistance programs that are focused
on livestock and tree crops. See CRS In Focus IF11163, 2018 Farm Bill Primer: The Farm Safety Net.
2
See CRS Report R46248, U.S. Farm Programs: Eligibility and Payment Limits.
3 T he dairy and sugar programs are essential parts of the 2018 farm bill. However, because their programs differ
markedly from the MAL, ARC, and PLC programs, they are not discussed in this report. For more information on the
dairy and sugar programs, see CRS In Focus IF11188, 2018 Farm Bill Primer: Dairy Programs; and CRS In Focus
IF10689, Farm Bill Primer: Sugar Program .
4 However, many specialty crops qualify for certain disaster assistance progr ams and federal crop insurance. For
information on farm programs that support specialty crop agriculture, see CRS In Focus IF11317, 2018 Farm Bill
Primer: Specialty Crops and Organic Agriculture.
5
See CRS Report R44606, The Commodity Credit Corporation: In Brief.
6 CRS Report R45659, U.S. Farm Program Eligibility and Payment Limits Under the 2018 Farm Bill (P.L. 115-334).
7
For a list of eligible commodities under MAL, ARC, and PLC, see Table 2 at the end of this report or CRS In Focus
IF11164, 2018 Farm Bill Primer: Title I Commodity Programs.
Congressional Research Service 1U.S. Farm Policy: Revenue Support Program Outlays, 2014-2020
Figure 1. Price Loss Coverage (PLC) Payment Formula
Source: Compiled by CRS based on the 2018 farm bill (P.L. 115-334).
Notes: MAL = Marketing Assistance Loan program; MYAP = the national market-year average farm price. The
Olympic average (OA) is calculated by removing the high and low years then averaging across the remaining
years. Program yields are historical farm-level yields used to determine per-acre payment rates.
Figure 2. PLC Low-Price Scenario for Rice
Source: Compiled by CRS.
Notes: cwt. = hundredweight or 100 lbs. This example assumes a farm with 100 base acres enrolled in the rice
PLC program, a program yield for rice of 70 cwt./acre, and a national OA for MYAP for 2013-2018 of $12.20 per
cwt. In a declining market, the per-unit payment rate increases until the farm price drops below the loan rate
($7.00/cwt. for rice), at which point the PLC payment rate is fixed at $14.00 - $7.00 = $7.00/cwt. If market
prices decline further, benefits under the MAL program may become available.
Congressional Research Service 2U.S. Farm Policy: Revenue Support Program Outlays, 2014-2020
Figure 3. County-Level Agricultural Risk Coverage (ARC) Payment Formula
Source: Compiled by CRS based on the 2018 farm bill (P.L. 115-334).
Notes: See notes for Figure 1. All references to ARC refer to the county-level, not the individual-level, ARC
program. The ARC per-acre payment rate is capped at 10% of the ARC county benchmark revenue per acre.
Figure 4. ARC Low-Revenue Scenario for Corn
Source: CRS.
Notes: bu. = bushel. Assumes the five-year average price (excluding high and low years) is $3.70 per bushel and
five-year average yield (excluding high and low years) is 150 bushels per acre. In this example, the maximum
potential ARC payment rate is $55.50 per acre (10% of the benchmark revenue of $555 per acre).
Congressional Research Service 3U.S. Farm Policy: Revenue Support Program Outlays, 2014-2020
The first tier of support is provided by the MAL program in the form of a price floor and interim
financing—a nonrecourse, nine-month loan at statutory loan rates for harvested production of
eligible crops (referred to as loan crops). USDA’s nonrecourse loan program was originally
established in the 1930s as a government loan that did not need to be repaid if market prices
remained below statutory support levels and the crop was surrendered to the government. The
nonrecourse loan program was modified by the addition of special repayment benefits to become
the MAL program under the 1985 farm bill (P.L. 99-198). The MAL program provides a price
floor to producers of certain statutorily designated crops and sets a lower bound for per-unit
payment rates under both ARC and PLC (see Figure 1 and Figure 3). It has been modified and
extended by successive farm bills, including the 2018 farm bill. 8
The MAL program may be supplemented by a higher, second tier of revenue support comprised
of either (1) the PLC program, which provides price protection at the national level via statutorily
fixed “reference” prices for eligible crops, or (2) the ARC program, which provides revenue
protection via historical moving average revenue guarantees at the county or whole-farm level.
Two Tiers of Market-Based Revenue Support
Tier I: Market Assistance Loan (MAL) Program
First tier revenue protection—in the form of a price floor—is available under the MAL program, which offers
producers a commodity-specific, statutorily fixed loan rate that is available for all harvested production of eligible
commodities (referred to as loan crops). See Table 2 for a list of MAL loan rates by loan crop. A participating
producer may put a harvested loan crop under a nine-month nonrecourse loan valued at the statutory commodity
loan rate. Thus, the value of the loan is equal to the harvested crop (measured in bushels or pounds) times the
loan rate (statutorily set at a price per unit).
For a nonrecourse loan, USDA agrees to accept the crop as full payment for the loan if a producer forfeits. The
loan uses the crop as collateral (thus coupling MAL benefits to current production), and the loan rate, in effect,
establishes a price guarantee. If local market prices increase above the loan rate (plus int erest), a producer may
repay the MAL and reclaim the crop. If market prices are below the loan rate, then other program benefits are
available to producers, including repayment of the loan at a USDA-announced lower repayment rate, forfeiting the
crop and retaining the value of the loan, or taking a loan deficiency payment in lieu of a MAL.9
Tier II: Agricultural Risk Coverage (ARC) and Price Loss Coverage (PLC) Programs
A second, higher tier of support is available under the ARC and PLC programs. Producers choose between PLC
and ARC depending on their preference for protection against a decline in crop prices (PLC) or crop revenue
(ARC).
PLC provides price protection based on reference prices set in statute at levels above the MAL loan rates (Figure
1). The 2018 farm bill added an escalator provision that could raise a covered commodity’s effective reference
price to as much as 115% of the statutory PLC reference price based on market conditions.10
ARC provides revenue protection based on the product of five-year Olympic (excludes the high and low years)
moving averages of both (1) historical county yields and (2) the higher of the national market-year average farm
price or the PLC effective reference price (Figure 3).
Each farm’s historical program acres (referred to as “base” acres) and historical yields are associated with specific
program crops that are enrolled in either ARC or PLC on a crop-by-crop basis. Producers may choose to
participate in a mixture of both ARC and PLC for the base acres of different program commodities.
8
See CRS In Focus IF11162, 2018 Farm Bill Primer: Marketing Assistance Loan Program .
9
For a description of producer choices under the MAL program, see CRS Report R45730, Farm Commodity
Provisions in the 2018 Farm Bill (P.L. 115-334).
10T he effective reference price is determined by formula as the higher o f the statutory reference price (RP) or 85% of
the five-year Olympic average of the market-year average farm price for the five preceding years, capped at 115% of
the RP.
Congressional Research Service 4U.S. Farm Policy: Revenue Support Program Outlays, 2014-2020
Alternatively, instead of choosing commodity-specific ARC and PLC, a farmer could choose to combine all of the
farm’s base acres for covered commodities into a single, whole-farm revenue guarantee under the farm-level
“individual” ARC (ARC-IC) program.11
MAL Is Coupled; ARC and PLC Are Decoupled
MAL benefits are linked to current production—a producer must harvest an eligible crop to participate in the
MAL program. In contrast, ARC and PLC payments are made on a portion of enrolled base acres (85% under
ARC and PLC; 65% under ARC-IC) and are therefore decoupled from producer production choices. In other
words, a producer does not need to plant the crop to receive a payment. However, a producer must own or rent
base acres and must enroll those base acres for either PLC or ARC during USDA-announced sign-up periods.
ARC and PLC Enrollment Under the 2014 and 2018 Farm Bills
The ARC and PLC programs were first authorized under the 2014 farm bill (Agricultural Act of
2014; P.L. 113-79) for the crop years 2014-2018. At the start of the 2014 farm bill, participating
producers were offered a one-time opportunity to enroll their historical program (or “base”) acres,
on a crop-by-crop basis, for either ARC or PLC. The enrollment choice w as to remain unchanged
for the duration of the 2014 farm bill—that is, through the 2018 crop year. Under the 2014 sign-
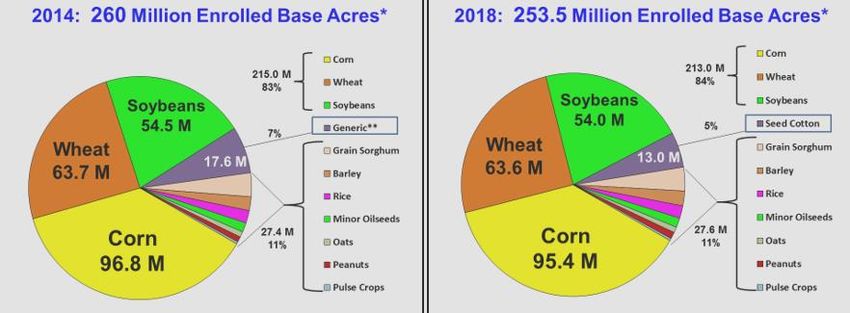
up, producers enrolled 260 million base acres for 20 covered commodities (see Figure 5). The
three largest crops in terms of base acres—corn, soybeans, and wheat—accounted for 83% of
enrolled base acres.
Figure 5. Base Acres Enrolled Under 2014 and 2018 Farm Bills
Base acres signed up for ARC or PLC by covered commodity
Source: Compiled by CRS from U.S. Department of Agriculture (USDA), Farm Service Agency (FSA) data.
Notes: Program crops eligible for ARC and PLC are referred to as “covered commodities.” Under the 2014
farm bill, a producer with base acres made a one-time choice for either ARC or PLC for each relevant covered
commodity for the entire 2014-2018 period. Under the 2018 farm bill, the initial base acre sign-up was for the
2019 and 2020 crop years, with an annual sign-up each year thereafter—2021, 2022, and 2023. *Base acres are
historical average acres on a farm that have been planted to program crops, defined under the 2002 farm bill
(P.L. 107-171; §1101). Each base acre is associated with a particular program crop. Not all base acres are
enrolled in ARC and PLC programs. Under the 2018 farm bill, producers had the option to reallocate their base
acres among program crops. For details, see CRS Report R45730, Farm Commodity Provisions in the 2018 Farm Bill
(P.L. 115-334). **Generic base is former upland cotton base. Upland cotton was removed from eligibility as a
covered commodity by the 2014 farm bill (P.L. 113-79). However, it indirectly regained its status as a covered
commodity, via seed cotton, under the Bipartisan Budget Act of 2018 ( P.L. 115-113). For details, see CRS Report
R45143, Seed Cotton as a Farm Program Crop: In Brief.
11
See CRS In Focus IF11161, 2018 Farm Bill Primer: ARC and PLC Support Programs.
Congressional Research Service 5U.S. Farm Policy: Revenue Support Program Outlays, 2014-2020
The 2018 farm bill extended both programs with several modifications intended to increase
flexibility in how producers use the programs.12 Producers could choose to reallocate their
existing base acres between ARC and PLC on a commodity-by-commodity basis, effective for the
2019 and 2020 crop years. 13 If no initial choice was made, then the default was whichever
program was in effect under the 2014 farm bill. Beginning in 2021, producers can again choose
between ARC and PLC annually for each of the 2021, 2022, and 2023 crop years.
Under the 2019 sign-up and reallocation, producers enrolled 253.5 million base acres in ARC and
PLC—a decline of 6.5 million acres from the 2014 enrollment. A large portion of the difference
in base acres was the result of the reassignment of generic base acres. Generic base acres were
created in 2014 when upland cotton was removed from eligibility for ARC and PLC payments. In
2018, when the Bipartisan Budget Agreement (P.L. 115-123) added seed cotton as a covered
commodity, generic base acres needed to be either assigned to a covered commodity or
eliminated. 14 Of the 17.6 million acres of former generic base, 13 million were reallocated to seed
cotton with the balance either enrolling under other covered commodities or dropping out of
participation—likely accounting for a substantial portion of the decline in total enrolled base
acres. The share of total base acres for the top three crops—corn, soybeans, and wheat—increased
from 83% to 84%.
Participation Shifts from ARC to PLC Under 2018 Farm Bill
Under the 2014 farm bill, most base acres (76.4%) were enrolled in the county-level ARC
program, compared with 22.8% base acres enrolled in PLC (Figure 6).
The preference for ARC under the 2014 sign-up was driven by the three largest crops—corn,
soybeans, and wheat—which enrolled major portions of their base acres under the county-level
ARC program, including 93.4% of corn base acres, 96.9% of soybeans, and 57.5% of wheat. The
high ARC participation implies a low PLC participation for these three crops , as shown in Figure
7.
The high enrollment share for ARC under the 2014 sign-up for corn, soybeans, and wheat was
due to their high farm prices during the 2010-2013 period (Figure 8). The prices for these years
factored into the ARC revenue guarantee formula (which looked back over the five years from
2009 to 2013) and assured producers of receiving payments for at least the first three years of the
program (i.e., for 2014-2016).
The 2018 farm bill’s first sign-up (for the crop years 2019 and 2020) allowed producers to
reallocate base acres between ARC and PLC. Enrollment results revealed that producers
overwhelmingly shifted away from ARC and to PLC for all crops (Figure 6). Total ARC
participation fell from 76.4% under the 2014 sign-up to 26.3% under the 2019-2020 sign-up,
while PLC participation rose from 22.8% to 69.9%.
12
See CRS Report R45730, Farm Commodity Provisions in the 2018 Farm Bill (P.L. 115 -334).
13
Producers had until March 16, 2020, to complete their sign -up for the 2019 and 2020 crop years. ARC and PLC
payments for the 2019 crop year are made after October 1 following the end of each crop’s marketing year. See Table
1 and Figure 14 later in this report for a discussion of the ARC and PLC payment schedule.
14 For details on the addition of seed cotton as a covered commodity and the reassignment of generic base acres, see
CRS Report R45143, Seed Cotton as a Farm Program Crop: In Brief.
Congressional Research Service 6U.S. Farm Policy: Revenue Support Program Outlays, 2014-2020
Figure 6. Enrollment of Base Acres by Program: PLC, ARC, and ARC-IC
Share of enrolled base by program for each sign-up period
Source: FSA data on enrollment in ARC and PLC by program crop base acres for the 2014 and 2018 farm bills.
The 2018 farm bill enrollment shown in this chart is for the crop years 2019 and 2020.
Figure 7. PLC Participation Rate: 2014 Versus 2018 Farm Bills
Share of base acres enrolled in PLC for selected covered commodities
Source: FSA data on enrollment in ARC and PLC by program crop base acres for the 2014 and 2018 farm bills.
The 2018 farm bill enrollment shown in this chart is for the crop years 2019 and 2020.
Notes: *Minor oilseeds include sunflower, flaxseed, canola, rapeseed, mustard, safflower, crambe, and sesame.
The ARC participation rate may be derived by subtracting the PLC participation rate from 100%. For example,
the soybean PLC participation rate under the 2014 farm bill is 3.1%, and its ARC participation rate is 96.9%.
Congressional Research Service 7U.S. Farm Policy: Revenue Support Program Outlays, 2014-2020
The largest shift occurred for corn base acres, which rose from 6.6% participation in PLC under
the 2014 farm bill to 75.5% enrollment in PLC under the 2019-20 sign-up (Figure 7). In addition,
over 90% of base acres for wheat, sorghum, barley, pulses, minor oilseeds, rice, and peanuts
enrolled in PLC under the 2019-2020 sign-up. The major exception was soybeans base acres,
where 85.9% of producers preferred to stick primarily with ARC.
The shift from ARC to PLC reflects expectations about the relationship between each
commodity’s market-year average farm price (MYAP) relative to its reference price. When
MYAPs are expected to remain above the reference price, the revenue-based ARC program offers
a higher probability of making a payment than does the PLC program. The PLC program will not
make a payment so long as the MYAP remains above the reference price. In contrast, the ARC
program uses a moving average revenue guarantee that rises with higher MYAPs and yields. A
substantial drop in the national average yield in the current year may be sufficient to trigger an
ARC payment, even if the MYAP remains above the commodity’s reference price. This is
particularly true for crops that have strong upward trends in their yields, such as corn and
soybeans. This was clearly the case in 2014 when producers used the previous five years as a
guide for the future and enrolled large percentages of their corn, soybean, and wheat base acres in
ARC.
In contrast, if a commodity’s MYAP is projected at levels below the reference price, then the PLC
program may appear more attractive to many producers as a safety net against low prices.
Accordingly, the preference for PLC under the 2018 farm bill is supported by the projected
outlook through 2025 for MYAPs to be below reference prices for many covered commodities,
including corn and wheat (Figure 8). Soybeans are the notable exception, as FAPRI projects the
MYAP for soybeans to trend from slightly below the soybean reference price of $8.40 per bushel
in 2020 to slightly above by 2025. Thus, many soybean producers continued to enroll their
soybean base acres in ARC during the 2018 farm bill’s initial sign-up.
Figure 8. MYAP as % of Reference Price for Corn, Soybeans, and Wheat Since 2005
Sources: Calculations by CRS using reference prices from the 2018 farm bill; historical prices for 2005-2019 are
from USDA, National Agricultural Statistics Service (NASS); projected prices for 2020 are from USDA, World
Congressional Research Service 8U.S. Farm Policy: Revenue Support Program Outlays, 2014-2020
Agricultural Supply and Demand, September 11, 2020; and projected prices for 2021-2025 are from FAPRI, Baseline
Update for U.S. Farm Income and the Farm Balance Sheet, University of Missouri, Report #04-30, August 2020.
Notes: Reference prices did not exist prior to the 2014 farm bill. However, prior year farm prices are included
in this chart to demonstrate their high levels relative to reference prices. *The All Wheat price is a composite
price of the major wheat varieties—Hard Red Winter, Soft Red Winter, White, Hard Red Spring, and Durum
wheat. MYAPs for each crop have been divided by their respective reference price and multiplied by 100 to
facilitate relative comparisons.
Program Outlays Reflect Market Conditions
Payments under MAL, as well as ARC and PLC, vary countercyclically with market conditions ;
that is, payments are contingent on relative prices—they tend to increase when farm prices fall
below support levels and decline when farm prices rise above support levels.
MAL Program Support Levels Are Low Relative to Farm Prices
Prior to 2010, the MAL program played a major role in providing revenue support to producers of
loan-eligible crops (Figure 9). From 1998 through 2009, outlays under the MAL program
averaged $3.6 billion annually, including $7.9 billion in each of 2000 and 2001.
The MAL program began to diminish in effectiveness as a floor price, particularly for corn and
soybeans producers, from 2010 to 2013. During this period, U.S. farm prices for most program
crops reached record levels and rose substantially above their statutorily fixed MAL loan rates.
The 2014 farm bill extended the MAL program with no changes to the statutory loan rates. The
2018 farm bill raised MAL rates for most loan commodities starting in 2019. The percentage
increases in MAL rates varied across program crops—from a low of 7.7% for rice to a high of
43.9% for oats—in an attempt to provide greater equity across program commodities. 15 Prior to
the rate increases under the 2018 farm bill, MAL rates had been left unchanged since the early
2000s when provisions in the 2002 farm bill (P.L. 107-171) made modest adjustments to several
commodities. 16
More than $1 billion in total MAL benefits were incurred during the five-year 2014 farm bill
period (2014-2018) (Figure 10). Three commodities accounted for all of the MAL outlays during
this period: upland cotton ($718.3 million, 70.1%); peanuts ($169.0 million, 16.5%); and wheat
($137.0 million, 13.4%).
MAL program outlays are not expected to play a major role in USDA program support during the
2018 farm bill period—crop years 2019-2023—as the current outlook projects farm prices for
most program crops to remain above their MAL loan rates throughout the period. 17
15
T he loan rates for minor oilseeds, peanuts, wool, mohair, an d honey were left unchanged by the 2018 farm bill. For
more information, see CRS Report R45730, Farm Commodity Provisions in the 2018 Farm Bill (P.L. 115 -334).
16
T he 2008 farm bill adjusted the MAL rates upwards slightly for barley, oats, wheat, minor oilseeds, graded wool, and
honey.
17 For example, see the price projections from USDA’s most recent baseline report at Erik Dohlman, James Hansen,
and David Boussios, USDA Agricultural Projections to 2029, OCE-2020-1, USDA, Economic Research Service (ERS),
February 2020; FAPRI, Baseline Update for U.S. Agricultural Markets, FAPRI-MU Report #04-30, August 2020.
Congressional Research Service 9U.S. Farm Policy: Revenue Support Program Outlays, 2014-2020
Figure 9. Monthly Farm Prices as % of MAL Loan Rate Since 1990
Sources: Calculations by CRS using MAL program loan rates from the 1990, 1996, 2002, 2014, and 2018 farm
bills. Historical monthly farm prices for corn, soybeans, and all wheat for 1990 to 2020 and peanuts for 2002 to
2020 are from USDA, NASS, Agricultural Prices. Historical monthly average world prices for cotton and rice are
used in lieu of farm prices to capture potential MAL loan repayment rates. Average world price data are from
ERS, commodity yearbook data tables for cotton and rice.
Notes: *The All Wheat price is a composite price of the major wheat varieties—Hard Red Winter, Soft Red
Winter, White, Hard Red Spring, and Durum wheat. Calculations for upland cotton and rice compare their
average world prices, as announced by USDA for purposes of MAL loan repayment, with each commodity’s
statutory loan rate. Peanuts were added as a loan crop in 2002. This chart is indicative of potential MAL benefits.
It likely understates the extent of actual MAL benefits, which are based on daily or weekly announced repayment
rates that have more variation than monthly averages.
Congressional Research Service 10U.S. Farm Policy: Revenue Support Program Outlays, 2014-2020
ARC and PLC Outlays Large in 2014-2016, Declined in 2017-2018
As mentioned earlier, the high commodity prices of the 2010-2013 period resulted in attractive
ARC revenue guarantees under the Olympic average of prices from the preceding five years
(Figure 8). This resulted in both high participation rates in ARC for corn, soybeans, and wheat
base acres and substantial ARC payments during the first three years of the 2014 farm bill period:
$4.5 billion in 2014, $6.0 billion in 2015, and $3.8 billion in 2016 (Figure 10). By 2017,
declining MYAPs from the 2014-2016 period had dampened the price component of the ARC
revenue guarantee and reduced ARC payments in 2017 and 2018.
Figure 10. MAL, PLC, and ARC Program Outlays, 2014-2023F
Crop-year data; not adjusted for inflation
Sources: Data for 2014-2018 are actual outlays compiled by CRS on a crop-year basis from FSA, farm program
data, March 12, 2020. Data for 2019 includes likely PLC payments based on FSA base sign-up and announced
PLC payment rates as of September 11, 2020. All other data for 2019-2023 are crop-year projections derived by
CRS using FAPRI’s “Baseline Updated for U.S. Agricultural Markets,” University of Missouri, Report #03 -20, June
2020. Nominal values are not adjusted for inflation.
Notes: ARC and PLC program outlays correspond to the crop year for which the payment was triggered, not
the year the payment was made. MAL benefits include marketing loan gains, loan deficiency payments, and gains
from forfeiture.
MYAPs remained above reference prices for most program crops in 2014, thus limiting PLC
outlays that year. Starting in 2015, wheat and corn MYAPs fell below reference prices, and PLC
payments began to rise. In 2016, PLC outlays reached $3.3 billion. MYAPs remained below
reference prices for most commodities during 2017 and 2018, and PLC payments surpassed ARC
payments in both of those years.
Producers took notice of the higher payments under PLC compared with ARC, when MYAPs fall
below reference prices. Looking forward, USDA’s most recent annual baseline report (February
Congressional Research Service 11U.S. Farm Policy: Revenue Support Program Outlays, 2014-2020
2020) projects MYAPs for most major program crops to remain below reference prices through
2029, thus favoring PLC over ARC in terms of the potential for receiving payments. 18
Comparison Betw een ARC and PLC Outlays by Commodity
During the 2014 farm bill’s five-year period, corn accounted for $11.3 billion (or 44%) of total
combined ARC and PLC payments. Wheat accounted for $5.0 billion (19%), rice for $2.8 billion
(11%), soybeans for $2.0 billion (8%), peanuts for $2.0 billion (8%), other feed grains for $1.5
billion (6%), and the remainder for $1.4 billion (5%). However, the payments were not evenly
distributed over time—most of the payments to corn base acres came during the first three years
of the 2014 farm bill (2014-2016), when corn received $10.7 billion in combined ARC and PLC
outlays (Figure 11).
Figure 11. Combined ARC and PLC Outlays by Commodity, 2014-2018
Crop-year data; not adjusted for inflation
Source: Compiled by CRS from FSA, official program data, as of March 12, 2020. Outlays are for combined
ARC and PLC payments by commodity.
Notes: *Other includes minor oilseeds and pulses for 2014-2018 and seed cotton for 2018. **Other feed grains
include grain sorghum, barley, and oats. ARC and PLC program outlays correspond to the crop year for which
the payment was triggered, not the year the payment was made. MAL benefits are not included in this chart.
Comparison of ARC and PLC Outlays per Base Acre
When the ARC and PLC outlays are compared as payments per base acre for the entire 2014-
2018 period, the average PLC payment is $29 per acre, and the ARC payment is $17 per acre
18For USDA’s most recent baseline report, see Erik Dohlman, James Hansen, and David Boussios, USDA Agricultural
Projections to 2029, OCE-2020-1, ERS, February 2020. See ERS, “Agricultural Baseline,” https://www.ers.usda.gov/
topics/farm-economy/agricultural-baseline/ for this and earlier reports.
Congressional Research Service 12U.S. Farm Policy: Revenue Support Program Outlays, 2014-2020
(Figure 12). However, there is substantial variation among the program commodities. Peanuts
had the highest PLC payment rate at $147 per acre. Long- and medium-grain rice also had large
PLC payment rates at $133 and $66 per acre, respectively.
Figure 12. Average Annual ARC and PLC Payment Rates per Base Acre
Averages for 2014-2018 crop years
Source: Compiled by CRS from FSA, farm program data, as of March 12, 2020.
Notes: The averages are for enrolled base acres and have been adjusted for payments to generic acres during
the 2014-2017 crop years. Seed cotton estimates are for 2018 only.
The three largest program crops in terms of total base acres—corn, soybeans, and wheat—had
relatively modest ARC and PLC payment rates per acre: For corn, the ARC and PLC payment
rates were $24 and $16 per acre, respectively; for soybeans, the rates were $7 and $0; and for
wheat, $13 and $19. Seed cotton had the highest ARC payment rate at $44 per acre, but this may
be misleading for two reasons. First, seed cotton was not eligible for ARC and PLC payments
during 2014-2017, thus only payments for 2018 are included in the payment rate calculation.
Second, 80% of seed cotton base was enrolled in PLC. 19 Seed cotton’s PLC payment rate was $30
per acre.
Many farmers contend that higher-valued crops—such as peanuts, rice, and cotton, which also
have higher costs of production—should necessarily receive higher subsidy rates. Farmers have
long endorsed the concept of basing support on costs of production rather than dollars per acre,
because costs have to be covered to stay in business and because costs of production vary widely
19
According to USDA data, in 2018, 11.9 million acres of seed cotton base were enrolled in PLC (9.5 million acres),
county-level ARC (2.1 million), or individual farm-level ARC (0.3 million).
Congressional Research Service 13U.S. Farm Policy: Revenue Support Program Outlays, 2014-2020
across program crops. Economists, on the other hand, would generally use trend (or a moving
average of) market prices as the basis for setting support prices in order to avoid market
distortions and resource misallocations. Both of these alternative measures of payment rates
across program commodities produce different outcomes. 20
ARC and PLC Have a Delayed Payments Structure
An important consideration in evaluating the effectiveness of ARC and PLC as farm revenue
safety net programs is the timeliness of program payments. In particular, ARC and PLC program
payments are made with a lag of at least one year from each crop’s harvest. This is because a full
12-month marketing year must be completed to compile the annual price and yield data necessary
for USDA’s payment calculations (Figure 13). According to statute, USDA is to announce
payments no later than 30 days after the end of each marketing year, but the payments cannot be
made prior to October 1 following the end of the applicable marketing year for each covered
commodity. 21 The marketing year varies by crop (Table 1). For example, the marketing year for
corn or soybeans harvested in the fall of 2020 ends on August 31, 2021. Thus, corn and soybean
payments for the 2020 crops must be announced by September 30, 2021, but may not be made
before October 1, 2021.
Figure 13. Schedule for 2020 Corn ARC and PLC Payments
Source: Compiled by CRS.
A result of the delayed payment protocol associated with ARC and PLC is that it makes tracking
the payments associated with a particular crop more difficult. Consider the 2020 corn crop: It was
planted in the spring of 2020—during the 2020 calendar and fiscal year—but any ARC and PLC
payments will not be made until after October 1, 2021—during calendar 2021 and FY2022—
about when the following year’s (i.e., 2021) crop is being harvested.
20 For a discussion of the issues related to basing support rates on costs of production and for a historical comparison of
support rates relative to costs of production and market price trends, see archived CRS Report RL34053, Measuring
Equity in Farm Support Levels, July 20, 2010 (available to congressional clients upon request).
21 2018 farm bill (P.L. 115-334; §1106 for PLC, §1107 for ARC).
Congressional Research Service 14U.S. Farm Policy: Revenue Support Program Outlays, 2014-2020
Table 1. Marketing Year and Payment Date for Major Covered Crops, 2020 Crop Year
For payments under either the ARC or PLC program
2020 (or equivalently 2020/2021) 1st Potential Fiscal
Covered Crop Marketing Year Payment Date Year
Wheat, barley, oats, canola, mustard, June 1, 2020, to May 31, 2021 Oct. 1, 2021 2022
flaxseed, rapeseed, safflower
Rice, peanuts, seed cotton, sunflower Aug. 1, 2020, to July 31, 2021 Oct. 1, 2021 2022
Corn, sorghum, soybeans Sept. 1, 2020, to Aug. 31, 2021 Oct. 1, 2021 2022
Source: Compiled by CRS.
This timing shift in ARC and PLC payments across crop, calendar, and fiscal years can be seen in
Figure 14, where the total payments do not change, but the timing results in a visible shift
rightward as the data are tracked. In Figure 14,
the first (top) chart assigns payments to the crop year when they are triggered;
the second (middle) chart shows the actual timing of the payments by calendar
year; and
the third (bottom) chart shows the timing of the payments by fiscal year—that is,
from a federal budgetary perspective.
Farm program spending data for each of these three time periods is used for different purposes.
Crop-year program outlays are reported by USDA as part of U.S. domestic farm support in its
annual notifications to the World Trade Organization. Calendar year farm program outlays are
used by USDA’s Economic Research Service in calculating annual U.S. net farm income. Fiscal
year program outlays are used by the Administration and Congress in the annual federal budget
process.
Congressional Research Service 15U.S. Farm Policy: Revenue Support Program Outlays, 2014-2020
Figure 14. ARC and PLC Payments by Crop
Year, Calendar Year, and Fiscal Year
Sources: Crop-year data for 2014-2018 are FSA farm program data, March 12, 2020; 2019-2020 data are crop-
year forecasts derived by CRS from FAPRI (June 2020); data for 2019 includes likely PLC payments based on FSA
base sign-up and announced PLC payment rates as of September 11, 2020. Calendar year data for 2014-2018 are
from the ERS farm income data base; calendar year projections for 2019-2020 are from FAPRI (September
2020). Fiscal year data for FY2014-FY2018 are from the Congressional Budget Office (CBO), USDA Baseline
Congressional Research Service 16U.S. Farm Policy: Revenue Support Program Outlays, 2014-2020
Projections, various years; projections for FY2019-FY2020 are from CBO’s USDA Baseline Projections, March
2020. Nominal values are not adjusted for inflation.
Note: MAL benefits include marketing loan gains, loan deficiency payments, and gains from forfeiture.
Some say that an effective safety net would link the payments closely to the circumstances that
triggered them, as shown in the first (top) chart. The second and third charts show payments
shifted substantially to the right of the crop-year chart, which suggests that the actual “safety net”
link is weak. The importance of this link for an individual farm operation would depend on its
financial situation: Can the farm wait one year or possibly longer for federal payments that are
intended to partially offset the economic losses as measured by the ARC or PLC program? For
example, most producers would have to repay operating loans for the 2020 corn crop and
purchase inputs for planting the 2021 crop nearly a year before ARC or PLC payments for the
2020 crop would be received.
One can also ask whether the ARC or PLC programs have reasonably estimated the economic
damage that producers might have incurred. For example, under the decoupled nature of the ARC
and PLC programs, a farm may not have even planted the crop that triggered the payment: Has
the farm incurred a loss, or is the payment simply a taxpayer-funded income transfer? ARC and
PLC were designed to accomplish multiple policy goals. Program attributes that contribute to
meeting those multiple goals can make some results seem inconsistent with one-dimensional
views of the program. ARC and PLC serve as a principal component of the farm safety net (along
with crop insurance and disaster assistance), but they also comply with international trade
commitments. The decoupling of ARC and PLC payments attempted to satisfy the international-
trade-compliance policy goal while minimally compromising their safety net function.
From a budget perspective and for taxpayer accountability, the government’s policy is to wait to
make payments until evidence of a loss is finalized. In the 1980s, the target-price deficiency
payment (TPDP) program—a predecessor of ARC and PLC—was also tied to the marketing year
price. However, the TPDP program provided advanced deficiency payments (equal to a portion of
a preliminary estimate of the program’s total payment) based on USDA supply and demand
estimates made early in the marketing year. 22 The final TPDP payment amount was determined
after the end of the marketing year, with the possibility that some of the advance payment would
need to be returned. The advance payments were eliminated in the 2000s as a budget cutting
measure, which maintained payments but scored budgetary savings by delaying the fiscal year
timing.
Issues for Congress
This report provides an initial assessment on the implementation of the revenue support programs
of the 2014 and 2018 farm bills. It is a starting point for a discussion of how well the MAL, ARC,
and PLC programs have performed as farm safety net programs. It is intended to provide some
context for future congressional consideration of farm policy, particularly in light of the
substantial volume of ad hoc farm support payments that have been paid out in recent years,
which are independent of farm-bill-authorized farm safety net programs. During the past three
years (2018-2020), USDA has been expected to pay as much as $39 billion over and above the
farm bill’s traditional support through MAL, ARC, and PLC, including $8.6 billion under the
22ERS, Provisions of the Food, Agriculture, Conservation, and Trade Act of 1990 , Agricultural Information Bulletin
no. 624, June 1991.
Congressional Research Service 17U.S. Farm Policy: Revenue Support Program Outlays, 2014-2020
2018 Market Facilitation Payment program, 23 $14.5 billion under the 2019 Market Facilitation
Payment program, 24 and potentially $16 billion under the 2020 Coronavirus Food Assistance
Program. 25 This is in comparison to an estimated $11.5 billion in MAL, ARC, and PLC payments
over the same 2018-2020 period.
Several policy issue related to the MAL, ARC, and PLC programs may be of potential interest to
Congress. They include the delayed payment schedule under both ARC and PLC programs—
payments do not occur until at least a year after the affected crop is harvested. Another perennial
issue that challenges policymakers is maintaining equity of support—for example, when
considering statutory reference prices—across different program commodities under changing
market conditions. Another potential policy issue is the extent to which the general level of farm
prices has moved above MAL loan rates, thus diminishing their functionality as floor prices for
eligible crops.
With respect to the implementation of the ARC and PLC programs, policymakers are challenged
by trade-offs between the dual policy objectives of complying with international trade
commitments (thus, the decoupled nature of payments from production) and providing safety net
support relative to market conditions. Also, there are trade-offs between linking payments to
losses and the speed with which payments are made in response to market or production losses.
Designing a farm safety net program clearly involves policy trade-offs. Policy designs of a farm
safety net program might consider the many potential aspects of what constitutes an “effective”
safety net program. The following questions suggest some of the different types of difficult policy
trade-offs policymakers may confront if designing a farm safety net program:
To what extent should safety net payments be triggered by the occurrence of a
bona fide “loss”—whether it be an unexpected decline in farm prices or an
unexpected drop in yields per acre from historical trend levels—and what portion
of a loss should the safety net payment be expected to offset?
What is the optimal balance between fully measuring a loss (some losses may
take months to fully assess) and making a timely safety net payment in response
to the loss?
How can a reasonable level of program equity be measured and achieved in
terms of safety net loss compensation across different program crops and
regions?
How can a safety net payment respond meaningfully to a loss without providing
an incentive to favor the production of one particular crop relative to other crops
or relative to market conditions of supply and demand?
Are farm safety net programs providing a “fair” measure of safety net support to
the U.S. agricultural sector relative to federal support in other sectors of the
economy?
23
CRS Report R45310, Farm Policy: USDA’s 2018 Trade Aid Package.
24CRS Report R45865, Farm Policy: USDA’s 2019 Trade Aid Package.
25
As of September 27, 2020, USDA had made payments of $10.2 billion out of a potential $16 billion appropriation.
See CRS Report R46395, USDA’s Coronavirus Food Assistance Program (CFAP) Direct Payments.
Congressional Research Service 18U.S. Farm Policy: Revenue Support Program Outlays, 2014-2020
Table 2. Farm Prices, MAL Loan Rates, and Effective Reference Prices
TIER II: Effective RP =
Olympic
TIER I: 5-Year Max of: Subject
MAL Average 2020 to a
Program Loan (OA)b MYAP Reference 85% OA CAP of
Commoditiesa Unit Rate MYAPc Forecastd Price (RP) MYAP 115% RP
($/unit) ($/unit) ($/unit) ($/unit) ($/unit) ($/unit)
Corn bu. $2.20 $3.52 $3.50 $3.70 $2.99 $4.26
Soybeans bu. $6.20 $8.94 $9.25 $8.40 $7.66 $9.66
Wheat, all bu. $3.38 $4.73 $4.50 $5.50 $4.02 $6.33
Peanuts cwt. $17.75 $20.83 $20.73* $26.75 $17.71 $30.76
Sorghum bu. $2.20 $3.26 $3.50 $3.95 $2.20 $4.54
Barley bu. $2.50 $4.76 $4.45 $4.95 $2.50 $5.69
Oats bu. $2.00 $2.46 $2.70 $2.40 $2.09 $2.76
Rice, long grain cwt. $7.00 $11.17 $11.30 $14.00 $9.49 $16.10
Rice, medium grain cwt. $7.00 $13.57 $11.50 $16.10 $11.53 $18.52
Dry peas cwt. $6.15 $11.10 $9.39* $11.00 $9.44 $12.65
Lentils cwt. $13.00 $24.03 $17.10* $19.97 $20.43 $22.97
Chickpeas, large cwt. $14.00 $28.30 $18.41* $21.54 $24.06 $24.77
Chickpeas, small cwt. $10.00 $23.80 $15.34* $19.04 $20.23 $21.90
Cotton, upland e cwt. $52.00 f $61.06 $49.50* n/a n/a n/a
Seed Cotton g cwt. n/a $33.37 n/a $36.70 $28.65 $42.21
Sugar, refined beet cwt. $25.37 $33.43 h $44.00* n/a n/a n/a
Sugar, raw cane cwt. $19.75 $26.20 i $26.30* n/a n/a n/a
Wool, graded cwt. $115.00 $156.00 j n/a n/a n/a n/a
Wool, nongraded cwt. $40.00 n/a n/a n/a n/a n/a
Mohair cwt. $420.00 $516.67 k n/a n/a n/a n/a
Honey cwt. $69.00 $211.93 l n/a n/a n/a n/a
Minor oilseedsm cwt. $10.09 n/a n/a $20.15 n/a $23.17
Sunflower cwt. $10.09 $17.53 $20.87* $20.15 $14.90 $23.17
Flaxseed cwt. $10.09 $16.27 $9.792* $20.15 $13.83 $23.17
Canola cwt. $10.09 $16.00 $15.34* $20.15 $13.60 $23.17
Rapeseed cwt. $10.09 $21.50 n/a $20.15 $18.28 $23.17
Mustard cwt. $10.09 $30.17 n/a $20.15 $25.64 $23.17
Safflower cwt. $10.09 $20.23 n/a $20.15 $17.20 $23.17
Sources: MAL loan rates and reference prices are from the 2018 farm bill (P.L. 115-334). Farm price data are
from NASS and ERS, Farm Income and Wealth Statistics.
Notes: MYAP = market-year average farm price, n/a = not applicable, bu. = bushel, cwt. = hundredweight or
100 lbs. *Simple average of monthly prices (January-July) for 2020. Tier II support also includes ARC revenue
protection not listed in this table.
Congressional Research Service 19U.S. Farm Policy: Revenue Support Program Outlays, 2014-2020
a. Tier I commodities are referred to as “loan” commodities; Tier II commodities are known as
“covered” commodities. Commodities with a Reference Price are covered commodities eligible for
PLC or ARC.
b. The Olympic average excludes the high and low values then calculates the average from the remaining
values.
c. The Olympic average for crop years 2015-2019 of MYAPs. Average adjusted world prices are used for
comparison of upland cotton and rice MAL loan rates instead of farm prices.
d. Unless marked with an asterisk (*), the reported 2020 MYAP is a USDA projection as reported in the
World Agricultural Supply and Demand Estimates, September 11, 2020. If marked with an asterisk, the
price shown in the column is the simple average of monthly prices (January-July) for 2020.
e. Upland cotton was removed from eligibility by the 2014 farm bill due to a ruling from a World Trade
Organization dispute settlement case successfully brought by Brazil against U.S. cotton support
programs (CRS In Focus IF10193, The WTO Brazil-U.S. Cotton Case).
f. The loan rate for upland cotton is the average MYAP for the preceding two years but within a range of
$45/cwt. and $52/cwt.
g. Seed cotton was added as a covered commodity, but not a loan commodity, by the Bipartisan Budget
Act of 2018 (P.L. 115-123). Seed cotton is “deemed” to have a MAL loan rate of $25/cwt. for purposes
of calculating the applicable ARC or PLC payment rate.
h. Olympic average of fiscal year prices for 2015-2019; U.S. wholesale refined beet sugar price, Midwest
markets, Milling and Baking News, as reported by ERS.
i. Olympic average of fiscal year prices for 2015-2019; U.S. raw sugar price, Contract No. 14/16, duty fee
paid New York, as reported by ERS.
j. Olympic average farm price received for calendar years 2015-2019, with no distinction for graded or
ungraded, as reported by NASS.
k. Olympic average of calendar year prices for 2015-2019.
l. Olympic average of calendar year prices for 2015-2019.
m. Minor oilseeds include the six listed oilseeds (sunflower, flaxseed, canola, rapeseed, mustard, and
safflower) as well as crambe and sesame—but these latter two are excluded due to insufficient data.
Author Information
Randy Schnepf
Specialist in Agricultural Policy
Disclaimer
This document was prepared by the Congressional Research Service (CRS). CRS serves as nonpartisan
shared staff to congressional committees and Members of Congress. It operates solely at the behest of and
under the direction of Congress. Information in a CRS Report should not be relied upon for purposes other
than public understanding of information that has been provided by CRS to Members of Congress in
connection with CRS’s institutional role. CRS Reports, as a work of the United States Government, are not
subject to copyright protection in the United States. Any CRS Report may be reproduced and distributed in
its entirety without permission from CRS. However, as a CRS Report may include copyrighted images or
material from a third party, you may need to obtain the permission of the copyright holder if you wish to
copy or otherwise use copyrighted material.
Congressional Research Service R46561 · VERSION 1 · NEW 20You can also read


