REPORT - An investment in your municipal future - One Investment
←
→
Page content transcription
If your browser does not render page correctly, please read the page content below
2 0
                       1 5        R E P OR T

An investment in your municipal future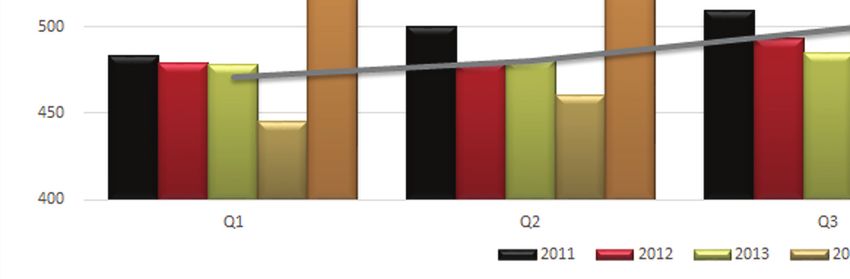
THE
                                TABLE OF CONTENTS
    About One.............................................................................................................................................................................................2
    The One Advantage .............................................................................................................................................................................3
    Five Investment Options ...................................................................................................................................................................4
    Historic Program Returns ..................................................................................................................................................................5
    2015 Review .......................................................................................................................................................................................6
    Program Balance and Participation..................................................................................................................................................7
    Money Market Portfolio Performance ........................................................................................................................................... 11
    High Interest Savings Accounts .................................................................................................................................................... 13
    Bond Portfolio Performance ........................................................................................................................................................... 14
    A Comparison of Bond vs. Money Market ..................................................................................................................................... 16
    Universe Corporate Bond (UCB) Portfolio Performance ............................................................................................................. 17
    Canadian Equity Portfolio Performance........................................................................................................................................ 18
    About the the One Canadian Equity Portfolio .............................................................................................................................. 19
    From Guardian Capital .................................................................................................................................................................... 20
    Looking Ahead to 2016 ................................................................................................................................................................... 21
    Appendix One .................................................................................................................................................................................... 23
    Appendix Two .................................................................................................................................................................................... 24

    ABOUT THE ONE
                                                                                                     PROGRAM OVERSIGHT
    INVESTMENT PROGRAM
                                                                                                           Program review and oversight is provided by a group
    The One Investment Program is a co-mingled
                                                                                                           of Ontario municipal finance professionals through
    investment program designed specifically for the
                                                                                                           the One Investment Program Advisory Committee.
    municipal and broader Ontario public sector that
                                                                                                           Current membership includes:
    provides competitive rates of return over both the
    short and longer term.
                                                                                                                  •   Liz Araujo,
                                                                                                                          Araujo Town of Whitchurch-Stouffville
    Established in 1993, One is operated jointly by                                                               •   Michael Coffey,
                                                                                                                               Coffey Tbaytel
    Local Authority Services (LAS), an affiliate of the                                                           •   Dan Cowin,
                                                                                                                           Cowin MFOA/CHUMS
    Association of Municipalities of Ontario (AMO), and                                                           •   Vince Grillo,
                                                                                                                             Grillo City of Windsor
    The CHUMS Financing Corporation, a wholly owned                                                               •   Ed Hankins,
                                                                                                                          Hankins Region of York
    subsidiary the Municipal Finance Officers’ Association                                                        •   Mark Martin,
                                                                                                                            Martin City of Ottawa
    of Ontario (MFOA).                                                                                            •   Ken Nix, Town of Whitby
                                                                                                                  •   Nancy Plumridge,
                                                                                                                             Plumridge LAS/AMO
                                                                                                                  •   Steve Rettie,
                                                                                                                             Rettie Town of Bracebridge
                                                                                                                  •   Janice Sheehy,
                                                                                                                              Sheehy City of Guelph
                                                                                                                  •   Ed Stankiewicz,
                                                                                                                          Stankiewicz City of Greater Sudbury

                                                                                                     Additional oversight is provided by both the LAS and MFOA/
                                                                                                     CHUMS Board of Directors.

2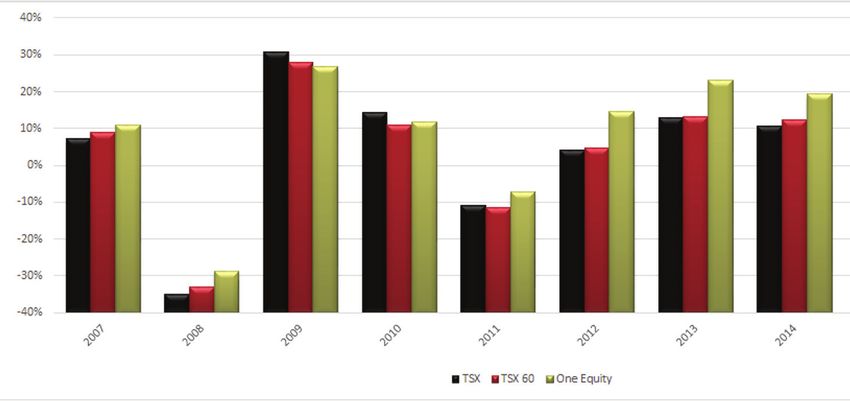
THE
                     THE ONE ADVANTAGE
    The size of the One Investment Program allows fixed costs (legal, accounting, reporting), to be spread over a much larger
    base than any one participant could achieve independently. Through participation with the One Investment Program,
    Ontario municipalities receive investment advantages not currently available to them should they choose to operate
    their investment portfolios independently. Those advantages include:

    Competitive returns
       • Net of investment management fees
       • Net of custodial/record keeping expenses
       • Net of administrative/accounting fees

    Oversight by municipal finance officials from both large and small municipalities
       • One Advisory Committee
       • MFOA/CHUMS and LAS Board of Directors

    Guaranteed regulatory compliance

    Enhanced returns from economies of scale transactions
    Low cost access to professional portfolio management and legal advice

    Reduced risk through
       • Diversification
       • Peer committee oversight
       • Technical expertise from 3rd party CFA consultant

    Flexibility and Liquidity
        • Quick and easy investment and redemption process
        • No lock-in requirements for investments

    Professional accounting and performance reporting of your investment activity

    Access through a password protected website to the municipality’s investment accounts
       • Account balances updated and posted daily
       • Monthly Statements

3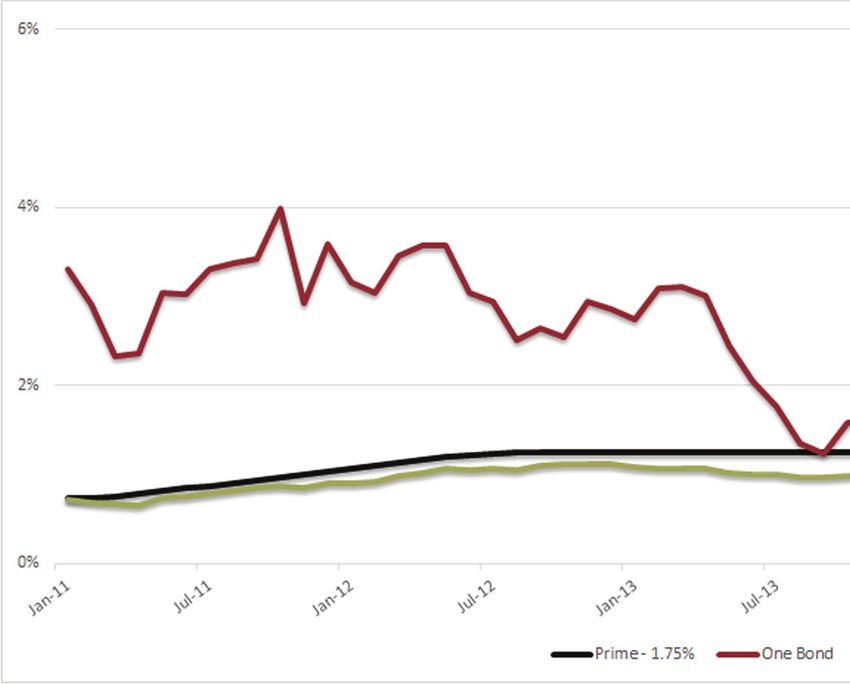
THE
                      FIVE INVESTMENT OPTIONS
    HISA (High Interest Savings Account) – For investment durations of 1 1+ month
                                                                             months
    Offered through CIBC, the HISA preserves capital and maintains liquidity while maximizing short-term income via secure
    deposits with a Schedule One Canadian Bank under a master LAS/CHUMS savings account.

    Money Market Portfolio: For investment durations of up to 18 months
    Portfolio Manager: MFS Investment Management Canada
    The One Money Market Portfolio preserves capital and maintains liquidity while maximizing short-term income through
    a diversified portfolio of Canadian Treasury Bills and high quality commercial paper.

    Bond Portfolio: For investment durations of 18 months – 3 years
    Portfolio Manager: MFS Investment Management Canada
    The One Bond Portfolio is intended to provide a higher return over longer investment horizons than would the Money
    Market Portfolio or HISA option. These higher returns are garnered primarily through investment in a diversified selection
    of federal, provincial and municipal bonds maturing within five years, as well as high quality bank paper.

    Universe Corporate Bond Portfolio: For investment durations of 4+ years
    Portfolio Manager: MFS Investment Management Canada
    Launched in 2008, the One Portfolio allows municipalities to invest in highly rated corporate bonds maturing in the five
    to ten year range, which historically have produced greater investment returns with only incremental additional risk. This
    investment type is available to most municipalities only through the One Program, as per current municipal regulation.

    Canadian Equity Portfolio: For investment durations of 5+ years
    Portfolio Manager: Guardian Capital LP
    Launched in 2007, the One portfolio is the only opportunity for Ontario municipalities to invest their long-term investment
    dollars in the equity market, as per current municipal regulation. The portfolio has outperformed the major Canadian
    stock indices since inception as well as other investment vehicles available to the sector.

                                      One Program Balances - December 31, 2015 ($ Millions)
                                 MM                  HISA                Bond                 UCB                Equity
       Participants              60                  20                   83                  37                   33
       Avg. Balance             $0.9                 $2.2                $3.2                $4.8                 $6.1
          Balance              $54.8
                               $54.8                $43
                                                    $43.6               $266.
                                                                        $26 6.0             $177.1
                                                                                            $177.1              $200..3
                                                                                                                $200

    The number of investors participating in each of the five availab
                                                               available
                                                                      le One Program offerings, as well as the average and
    total deposit in each portfolio/account
                           portfolio/account as at December 31, 2015 are noted above. Year-over-year the number of active
    investors has increased by seven in both the Equity and Universe Corporate Bond portfolios, thirteen in the Bond
    portfolio,, and two in the Money
    portfolio                  Money Market
                                       Market portfolio.
                                              portfolio. The new HISA offering saw modest uptake in its first year
                                                                                                              year,, with 20
    eligible
    eligible investors beginning to make use of it.

4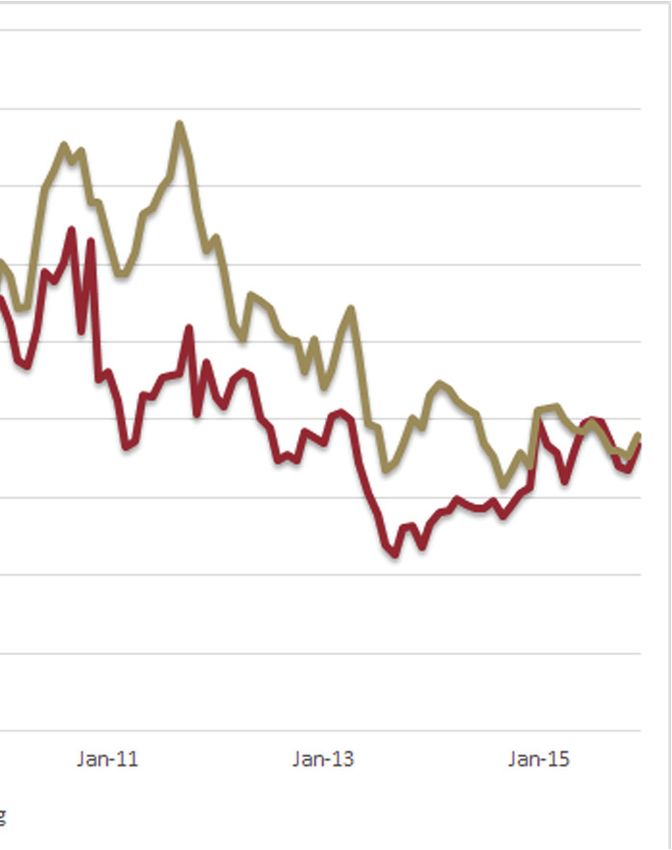
THE
                          HISTORIC PROGRAM RETURNS
                             Intended
          Portfolio                                         Investment Approach                                                Holdings
                             Duration
           HISA
                              1+    Deposits with a Schedule I Canadian Bank under a
      (High Interest                                                                 •                           Bank Deposits
                             months master LAS/CHUMS accounts
     Savings Account)
                                                                                                         •       Canadian treasury bills
                             1 - 18 Preserve capital and maintain liquidity while                        •       High quality commercial papers
       Money Market
                             months maximizing short-term income                                         •       Banker’s acceptances
                                                                                                         •       Floating rate notes
                         18                                                                              •       Federal, provincial and municipal bonds
                               Provide a higher return over longer investment
             Bond     months -                                                                           •       High quality bank paper
                               horizons through diversified investments
                       3 years                                                                           •       Bank guaranteed debt
         Universe              Investment in highly rated corporate bonds                                •       Canadian corporate bonds
                      4+ years
     Corporate Bond*           maturing over a wide time frame                                           •       Federal, provincial and municipal bonds
                               A diversified conservatively managed portfolio of
     Canadian Equity* 5+ years equity securities issued by Canadian corporations                         •       Canadian equity securities
    * These asset classes (Canadian equities and Canadian Corporate Bonds with maturities longer than five years) are available for investment by municipalities
    only through One Program as per the Municipal Act Eligible Investment regulation.

    ONE INVESTMENT PROGRAM ANNUALIZED PORTFOLIO RETURNS & COMPARATORS
      (as at December 31, 2015)                                   6 month            1 year              2 year              3 year               5 year
     HISA (High Interest Savings Account)*
                                                                   1.0%                 -                    -                   -                   -
     (1-18 month investments)
     Money Market Portfolio*
                   Portfolio
                                                                  0.43%              0.67%               0.77%                   -                   -
     (1-18 month investments)
     Bond Portfolio*
          Portfolio
                                                                     -               1.94%               2.42%               1.99%               2.34%
     (18 month - 3 year investments)
     Universe Corporate Bond Portfolio*
                             Portfolio
                                                                     -               2.95%               5.94%               3.41%               4.46%
     (4+ Year investments)
     Canadian Equity Portfolio **
                                                                     -              -0.63%               8.90%              13.46%               9.18%
     (5+ Year Investments)
     COMPARATOR INVESTMENT RETURNS***
     Bank Prime less 1.75%
                                                                  0.97%              1.02%                   -                   -                   -
     (Source: Bank of Canada)
     Guaranteed Investment Certificate (GIC)
                                                                                     1.20%                   -               1.15%               1.88%
     (Source: Bank of Canada)
     Canada Bond
                                                                     -                                   1.13%               1.23%               2.50%
     (Source: Bank of Canada)
     TSX Composite Index
                                                                     -              -8.32%               0.68%               4.62%               2.30%
     (unmanaged without fees)
    * All One Investment Program returns shown are net of fees.                    *** Comparator Returns have no adjustment included should any fees apply
    ** 9-year return (since Jan 2007) is 6.31%

5
THE
                 2015 REVIEW
    •    At year-end 2015, 108 Ontario municipalities and broader public sector investors had investments with The One
         Investment Program.

    •    As was the case in 2014, 2015 saw significant growth in average program balances on a year-over-year basis.

    •    The total One Investment Program balance at December 31, 2015 was $740M, or 24% higher than the total
         balance one year prior.

    •    The One Program High Interest Savings Account (HISA) was launched in May 2015.

    •    The total One Investment Program balance for the four traditional portfolios at year-end 2015 was $698M, up
         $98M, a 14% increase. HISA added an additional $43M.

    •    The Universe Corporate Bond Portfolio balance at year-end 2015 was $177.1M, 77% higher than the 2014
         closing balance.

    •    The One Equity Portfolio ended 2015 with a balance of $200.3M, surpassing the $200M threshold for the first
         time, and 23% higher than the 2014 closing balance.

    •    At December 31, 2015 the UCB Portfolio has realized one, two and three annualized returns of 2.95%, 5.94%
         and 3.41% respectively

    •    LAS and CHUMS offered 6 Investment Basics seminars in 2015 to educate 69 municipal staff about the rules,
         opportunities, and benefits of investments for municipalities.

6
THE
PROGRAM BALANCE & PARTICIPATION
The average 2015 balance across all One Program portfolios was $643M, up 29.1% from the average 2014 program
balance of $498M. Average total program balances for 2015 were higher than any other year since the inception of the
One Investment Program in 1993.
Figure 1 illustrates average quarterly One Program balances for the last five years of operation.
FIGURE 1: OÄ PÙʦÙà AòÙ¦ QçÙãÙ½ù B½ÄÝ ($ M®½½®ÊÄÝ)
Figure 2 provides an overview of total One Program balances and portfolio activity for the years 2008 to 2015. Note that
HISA was only added in 2015 so is not included in this historic comparison table.
FIGURE 2: OÄ IÄòÝãÃÄã PÙʦÙà IÄòÝãÃÄã SçÃÃÙù ($ M®½½®ÊÄÝ)
2008 2009 2010 2011 2012 2013 2014 2015 TOTAL
OPENING BALANCE $342.9 $409.3 $527.2 $483.1 $482.8 $492.1 $437.1 $600.8
NET DEPOSIT/REDEMPTION $62.1 $97.2 -$60.8 -$7.2 -$6.9 -$76.8 130.5 $90.8 $229.1
INVESTMENT INCOME $4.3 $20.7 $16.7 $6.8 $16.2 $21.8 $33.2 $6.5 $126.2
CLOSING BALANCE $409.3 $527.2 $483.1 $482.8 $492.1 $437.1 $600.8 $698.1
The total program balance at year-end 2015 was $698M, and higher than any year-end balance since the inception of
the One Investment Program. Including HISA, which was launched part way through 2015, the 2015 year-end program
balance was $740M.
The increase of $97.3M was comprised of $90.8M in net new deposit and $6.5M in investment income.
7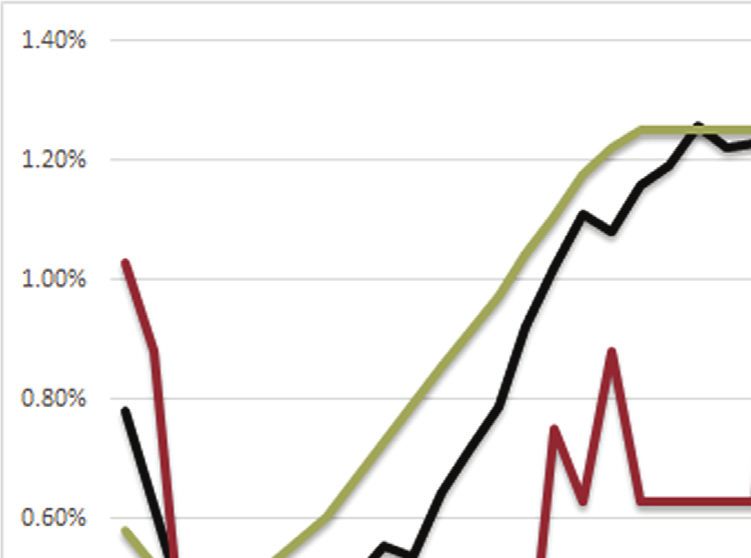
THE
PROGRAM BALANCE & PARTICIPATION
Figure 3 shows an analysis of the 2015 activity within each of the 4 traditional One Program portfolio investment
options. On a year-over-year basis, only the Money Market portfolio balance decreased, although it was partially offset
by initial positions in the HISA account. Total net client transactions of $90.8M in the four traditional portfolios were
largely the result of:
• One new investor establishing a “Legacy Fund” for $30M following the sale of a municipal electric utility.
• A municipality opening position in the UCB portfolio of $35M
• An existing One Program investor adding $15M to their Bond Portfolio position late in 2015
FIGURE 3: OÄ IÄòÝãÃÄã PÙʦÙà Aã®ò®ãù ù PÊÙã¥Ê½®Ê
Money Market Bond UCB Equity
Balance $M $128.4 $209.2 $100.7 $162.6
at 31st December, 2014 Units 132,645 226,192 91,665 9,312,432
Price $ $967.74 $924.70 $1,098.47 $17.46
2015 Activity (Net Transactions) Total $M -$74.2 $52.5 $73.0 $39.5
Balance $M $54.8 $266.0 $177.1 $200.3
at 31st December, 2015 Units 56,656 289,552 160,769 11,545,846
Price $ $966.60 $918.54 $1,101.74 $17.35
Balance $M -$73.6 $56.8 $76.4 $37.7
Difference
Units -75,989 63,360 69,104 2,233,414
Price $ -0.12% -0.67% 0.30% -0.63%
Investment Income Total $M $0.6 $4.3 $3.4 $-1.7
8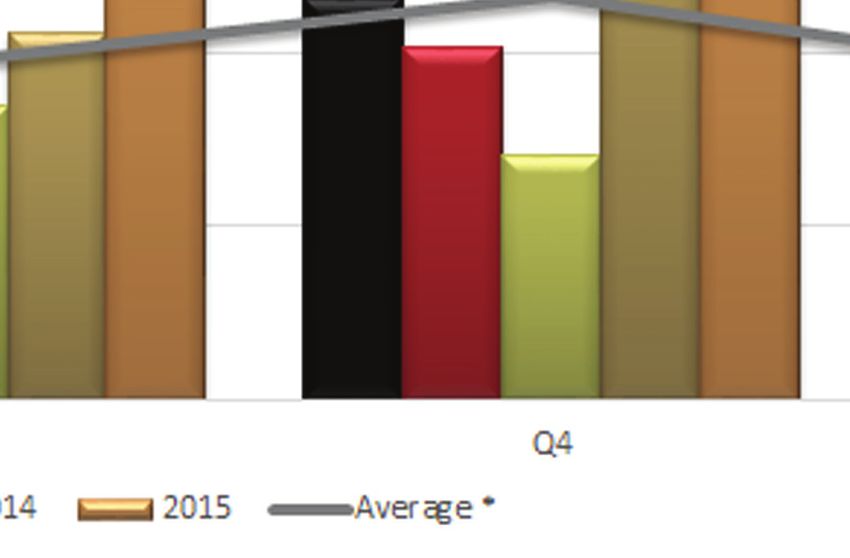
THE
PROGRAM BALANCE & PARTICIPATION
Figure 4 represents the total Program investment per participant and compares year-end 2015 to 2014 balances. The
number of active program investors through 2015 increased by eleven as at year end. This is an 11% increase in the
total number of One Program investors.
FIGURE 4: TÊã½ DÖÊÝ®ãÝ ÖÙ PÙã®®ÖÄã AÙÊÝÝ ½½ PÙÊçãÝ, Ý ã DÃÙ 31, 2015
MUNICIPAL TOTAL DEPOSIT AVG. DEPOSIT % OF TOTAL DEPOSIT
INVESTMENT
PARTICIPANTS IN RANGE IN RANGE
LESS THAN $100K 10 $417,574 $41,757 0.06%
$100K TO $500K 17 $5,066,705 $298,041 0.73%
$500K TO $1M 12 $8,495,534 $707,961 1.22%
$1M TO $5M 48 $123,010,009 $2,562,709 17.62%
GREATER THAN $5M 21 $561,145,764 $26,721,227 80.38%
TOTALS 108
108 $698,13
,135,586 100.00%
100.
TÊã½ DÖÊÝ®ãÝ ÖÙ PÙã®®ÖÄã AÙÊÝÝ ½½ PÙÊçãÝ, Ý ã DÃÙ 31, 2014
MUNICIPAL TOTAL DEPOSIT AVG. DEPOSIT % OF TOTAL
INVESTMENT
PARTICIPANTS IN RANGE IN RANGE DEPOSIT
LESS THAN $100K 10 $441,568 $44,157 0.07%
$100K TO $500K 17 $4,800,457 $282,380 0.80%
$500K TO $1M 8 $5,639,591 $704,949 0.94%
$1M TO $5M 40 $96,942,612 $2,423,565 16.14%
GREATER THAN $5M 22 $492,955,113 $22,407,051 82.05%
TOTALS 97 $600,
600,779
779,,341 100.00%
Appendices 1 and 2 show investment as at year-end 2015 and 2014 in the One Program broken out for each of the
offered products.
9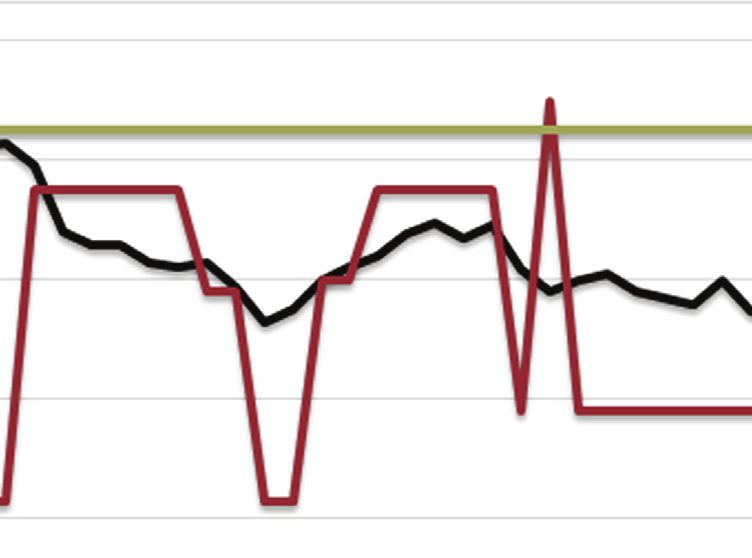
THE
PROGRAM BALANCE & PARTICIPATION
Figure 5, below looks at Program participation sorted by municipal population for year-end 2014 and 2015. On a percentage
basis, the largest total balance increases are in the 5,001 to 25,000 and 25,001 to 50,000 municipal population categories.
The growth in the 5,001 to 25,000 range is largely due to the increase in the number of participants. The increase in the
25,001 to 50,000 range is for the most part the result of a third hydro legacy investment added in late 2015. With respect to
the number of investors within the population ranges, the three smallest population ranges added fourteen net investors
while the two largest ranges lost three participants, which is the result of the removal of money market investment positions.
FIGURE 5: TÊã½ OÄ IÄòÝãÃÄã PÙã®®Öã®ÊÄ ù PÊÖç½ã®ÊÄ Ý ã DÃÙ 31, 2015
# OF % OF % OF TOTAL
POPULATION INVESTMENT (MILLIONS)
MUNICIPALITIES MUNICIPALITIES INVESTMENT
PER MUNI TOTAL
< 5,000 35 32.4% $1.1 $37.2 5.3%
5,000 TO 25,000 43 39.8% $2.3 $100.1 14.3%
25,001 TO 50,000 10 9.3% $19.6 $195.9 28.1%
50,001 TO 100,000 6 5.6% $21.2 $126.9 18.2%
100,000 + 14 13.0% $17.0 $238.0 34.1%
TOTAL 108 100.00% $6.5 $698.1 100.00%
TÊã½ OÄ IÄòÝãÃÄã PÙã®®Öã®ÊÄ ù PÊÖç½ã®ÊÄ Ý ã DÃÙ 31, 2014
# OF % OF % OF TOTAL
POPULATION INVESTMENT (MILLIONS)
MUNICIPALITIES MUNICIPALITIES INVESTMENT
PER MUNI TOTAL
< 5,000 30 30.9% $1.1 $33.1 5.5%
5,000 TO 25,000 36 37.1% $2.3 $83.2 13.8%
25,001 TO 50,000 8 8.2% $19.5 $155.6 25.9%
50,001 TO 100,000 7 7.2% $16.2 $113.2 18.8%
100,000 + 16 16.5% $13.5 $215.7 35.9%
TOTAL 97 100.0% $6.2 $600.8 100.0%
10THE
MONEY MARKET PORTFOLIO PERFORMANCE
Coming into 2015, the Bank of Canada (BOC) overnight interest rate had been static since September 2010, but the
BOC cut the overnight rate twice in 2015, with the year-end rate being 0.50%. Canadian banks did not move in lock step
with the BOC cuts as they lowered their prime rates by only 30 basis points (0.3%) to 2.70%. That left the ‘Bank Prime
less 1.75%’ return at 0.95%. The Money Market sector continued to struggle, and the One Money Market Portfolio return
was only 0.67% for the year ending December 31, 2015, compared to the 1.02% return of the bank prime less 1.75%
alternative. On a monthly basis, the one-year Money Market Portfolio has trailed the Bank Prime comparator in 69 of 72
month ends in the six years of data ending December 31, 2015, with an average underperformance of 21 basis points
(0.21%) for the period.
FIGURE 6: OÄ YÙ RãçÙÄÝ GIC òÝ. BÄ» Pٮà LÝÝ 1.75% òÝ. OÄ MÊÄù MÙ»ã (JÄ. 2010 - D, 2015)
Figure 6 illustrates one year returns for various short term investment alternatives for every month ending in the period
of January 2010 to December 2015. The average returns over the six-year period were 0.90% for the One Money Market
portfolio, 1.11% for the Prime less 1.75% return, and 0.81% for the GIC alternative.
“The Bank of Canada maintained its policy rate at 0.50%, while the US Federal Reserve initiated its first rate hike in close to a
decade. Given the soft domestic economic backdrop and the poor outlook for commodity prices, we believe the Bank of Canada is
unlikely to follow the Fed anytime soon, especially as inflation pressures remain weak.”
MFS Investment Management Canada
Canadian Money Market Fourth Quarter 2015 Investment Report
“All things considered… the risks to the profile for inflation are roughly balanced. Meanwhile, financial vulnerabilities continue to
edge higher… The Bank [of Canada’s] Governing Council judges that the current stance of monetary policy is appropriate, and the
target for the overnight rate remains at 1/2 per cent.”
Bank of Canada | Joana Taborda | tradingeconomics.com | January 20 , 2016
“By not cutting rates in January or even giving much of a hint that a cut could be coming, it looks as if the [Bank of Canada] is happy
to wait on the sidelines and let fiscal policy do the heavy lifting from here.”
CIBC WORLD MARKETS INC. | Economic Insights | January 28, 2016
11THE
MONEY MARKET PORTFOLIO PERFORMANCE
To further complicate the money market situation, four of the five major Canadian banks are also forecasting the Bank
of Canada overnight rate to stay static through 2016. The rate forecasts from the banks are in Figure 7, with the date
the forecast was issued in brackets.
FIGURE
FIG 7: BÄ» Ê¥ CÄ 2016 OòÙÄ®¦«ã Rã FÊÙÝãÝ
Q1 Q2 Q3 Q4
RBC (January 8, 2016) 0.50 0.50 0.50 0.50
CIBC (JANUARY 28, 2016) 0.50 0.50 0.50 0.50
SCOTIA (JANUARY 5, 2016) 0.50 0.50 0.50 0.50
BMO (JANUARY 29, 2016) 0.50 0.25 0.25 0.25
TD (DECEMBER 17, 2015) 0.50 0.50 0.50 0.50
Average 0.50 0.45 0.45 0.45
Median 0.50 0.50 0.50 0.50
Figure 8 illustrates the spread between 3 Month T-bills and 3 Month Bankers’ Acceptances. In 2015 the spread between
the products continued to rise slightly from the 2010-2013 period. The spread has still not returned to pre-2007 values.
What this means is that for short-term money, Canadian businesses are paying 15 to 20 basis points more in comparison
to the Bank of Canada rate than they had before the 2008 credit crisis.
FIGURE 8: S«ÊÙã TÙà IÄãÙÝã Rã SÖÙÝ (SÊçÙ: BÄ» Ê¥ CÄ WÝ®ã)
Year 3-Month T-Bill 3-Month BA BA T-Bill
2015 0.50% 0.83% 0.33%
2014 0.91% 1.21% 0.30%
2013 0.97% 1.20% 0.23%
2012 0.95% 1.19% 0.24%
2011 0.91% 1.19% 0.28%
2010 0.56% 0.80% 0.24%
2009 0.36% 0.44% 0.08%
2008 2.32% 3.17% 0.85%
2007 4.13% 4.57% 0.44%
2006 4.02% 4.17% 0.15%
2005 2.71% 2.82% 0.11%
2004 2.22% 2.31% 0.09%
12THE
HIGH INTEREST SAVINGS ACCOUNT (HISA)
The One investment Program continues to evolve to meet the changing needs of municipalities with the introduction of
a new High Interest Savings Account (HISA) option. The HISA is a fully liquid and secure short-term investment option
for every municipality.
Following the global financial crisis of 2008, the market has experienced near record low interest rates, leaving many
municipalities struggling to find short-term investments that provide adequate rates of return. Some larger municipalities
can secure a rate of ‘Prime less 1.75%’ on their short-term bank deposits, but many smaller municipalities are getting
far less than 1%. This is why LAS and CHUMS created the One Investment Program HISA.
The HISA is offered through CIBC and provides better interest rates than are typically offered to municipalities. HISA
is fully liquid, and provides investors a guaranteed variable rate of return that is based on the aggregate balance of all
sub-accounts. Simply put, the larger the HISA balance, the higher the rate of return.
Aggregate Balance Interest Rate for all Deposits Effective Interest Rate
Less than $100M Bank Prime Less 1.7% 1.0%
>$100M, but $150M Bank Prime Less 1.6% 1.1%
*As of January 20, 2016
The graph below displays the expected future 1-year return for the One HISA compared to the most commonly used
vehicles for short-term deposits - ‘Bank Prime less 1.75%,’ a 1-year cashable GIC, and a 1-year locked-in GIC. Note the
HISA and Bank Prime less 1.75% options assume the Bank Prime rate remains constant throughout 2016.
A $1 million One HISA investment made at January 1, 2016 and “maturing” at December 31, 2016 would yield $1,000
more than a cashable GIC investment. And while it’s true that the locked-in GIC would return more than the One HISA,
the municipality would not be able to access the money in the locked-in GIC until it comes to term, without possibly
incurring an early redemption penalty. Conversely, the One HISA investment is fully liquid and the municipality can have
access to all of their money typically within one business day.
*Average One Money Market Return over the past 2 years
** Assuming investment is held for full one-year period (not liquid)
13THE
BOND PORTFOLIO PERFORMANCE
Average one-year One Bond Portfolio returns in 2015 were 2.74% compared to 2.33% in 2014 and 1.36% in 2013. As
illustrated in Figure 9, the average one-year One Bond Portfolio return for 2015 continued to recover from record low
2013 results.
FIGURE 9: OÄ BÊÄ PÊÙã¥Ê½®Ê AòÙ¦ OÄ YÙ RãçÙÄ ¥ÊÙ MÊÄã«Ý EĮĦ ®Ä T« YÙ
Figure 10 illustrates two-year One Bond Portfolio returns compared to other investment alternatives available to the
sector for all month-ends from January 2011 to December 2015. For two-year investment durations, the One Bond
Portfolio has outperformed the prime less 1.75% and the One Money Market Portfolio in all but one observation in 60
month ends reviewed in Figure 11. Average returns for the two-year rolling periods examined were 2.53% for the One
Bond Portfolio, 1.15% for the Bank Prime, and 0.94% for the One Money Market comparators.
FIGURE 10: TóÊ-YÙ AÄÄç½®þ RãçÙÄ CÊÃÖÙ®ÝÊÄ: Pٮà LÝÝ 1.75% òÝ. OÄ BÊÄ òÝ. OÄ MÊÄù
MÙ»ã (MÊÄã«Ý EĮĦ JÄ 2011 ã«ÙÊ禫 D 2015)
14THE
BOND PORTFOLIO PERFORMANCE
Figure 11 compares three-year returns achieved through both GIC investments and the One Bond Portfolio, for all month
ends between January 2010 and December 2015. The One Bond Portfolio average return was 3.21% compared to 1.81%
for the GIC investment. Over an average three-year period, the One Bond Portfolio would have returned an additional
$4,413 in investment income on each $100,000 invested.
FIGURE 11: AÄÄç½®þ RãçÙÄ CÊÃÖÙ®ÝÊÄ GIC Ι OÄ BÊÄ PÊÙã¥Ê½®Ê
(MÊÄã«Ý EĮĦ JÄçÙù 2010 ã«ÙÊ禫 DÃÙ 2015)
If your investment monies are not required in the next 18 months, there is a marked benefit to invest them in a product
like the One Bond Portfolio, rather than a bank account, or short-term deposit type product.
The Canadian bond market delivered strong returns during the fourth quarter as Government of Canada yields edged
lower across all but the shortest maturities on the yield curve, largely due to softer domestic economic data and
further weakening in oil prices. Despite a subdued view of the business cycle, we continue to view the macro
backdrop as inconsistent with a global or US recession.
MFS Investment Management Canada
Fourth Quarter 2015 One Bond Portfolio Report
15THE
A COMPARISON OF BOND VS. MONEY MARKET
Given the longer-term outperformance of the One Bond Portfolio over the One Money Market Portfolio, staff developed
Figure 12 to illustrate ‘lost’ investment income for a municipality that has medium-term investment money (i.e. money
that has been sitting idle for more than 18 months) invested in the One Money Market Portfolio instead of the One Bond
Portfolio. The graph presents the difference in the value of a single $10M investment in the One Money Market and One
Bond portfolios for 2 and 3-year rolling year-end periods from January 2001 to December 2015.
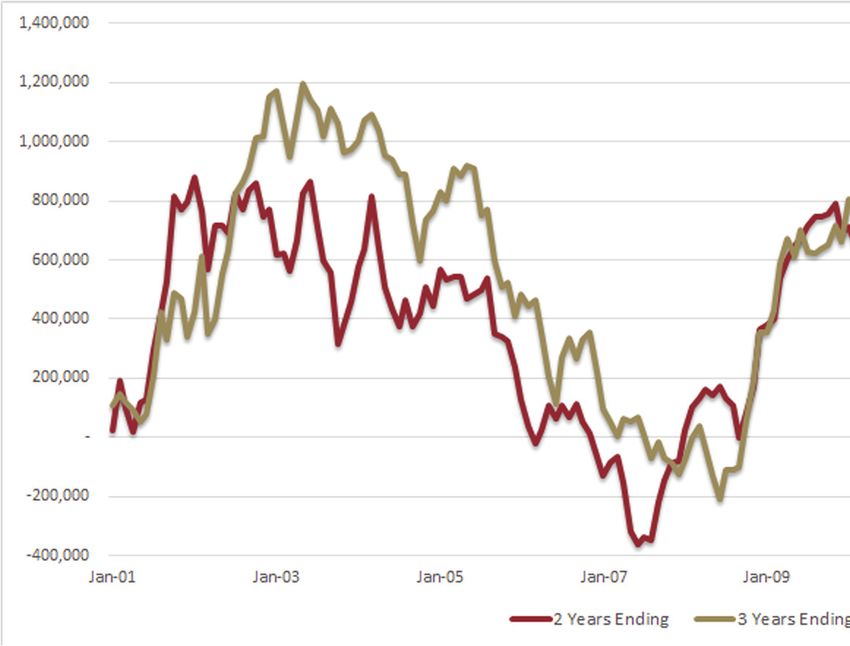
FIGURE 12: Rʽ½®Ä¦ 2 Ι 3 YÙ PÙ®Ê CÊÃÖÙ®ÝÊÄ OÄ BÊÄ PÊÙã¥Ê½®Ê ®Ä EøÝÝ Ê¥ MÊÄù MÙ»ã ÊÄ
$10M IÄòÝãÃÄã
On a $10 million investment, the average extra benefit of the One Bond Portfolio for 2 year periods is $374,560, and
$552,360 for three year periods.
In 8% of instances for 2 year returns, and 7% of the instances for three year returns, the Bond Portfolio underperformed
the Money Market Portfolio, but on the whole the potential for additional investment return from the Bond Portfolio
makes for a compelling argument if your municipality has longer-term monies invested in the One Money Market Portfolio,
or other short term investment on a regular basis. It may be worthwhile to place a portion of that money in the Bond
Portfolio to potentially increase your investment return.
NOTE that past portfolio performance is not a guarantee of future returns.
16THE
UNIVERSE CORPORATE BOND (UCB) PORTFOLIO
The One UCB Portfolio grew by $76.4M in 2015, ending the year with a balance of $177.1M, which is a 76% increase
over the 2014 closing balance. This increase represents $73.0M in new investment and $3.4M in investment income
earned. As at December 31, 2015, the UCB Portfolio has realized one, two and three annualized net returns of 2.95%,
5.94% and 3.41%, respectively.
5 YÙ BÄ» SÖÙÝ: AòÙ¦ SÖ٠ʥ A½½ M¹ÊÙ BÄ» DÖÊÝ®ã NÊãÝ
This graph shows interest spreads that the major
5 YEAR BANK SPREADS Canadian banks pay in excess of similar term Bank
Average Spread of All Major Bank Deposit Notes
of Canada bonds to borrow money - in this case
275 over five years. Effectively, this graph shows the
250 added return opportunity for corporate debt as
225
credit spreads begin to narrow to more historic
200
175
levels. As MFS noted below in their Q4 Report,
BASIS POINTS
150 Canadian corporate spreads have widened, which
125 is an opportunity for corporate bonds in the longer-
100
term. As the global economy improves credit
75
50
spreads should again narrow, adding value to bonds
25 held in the portfolio that were purchased at a time
99 00 01 02 03 04 05 06 07 08 09 10 11 12 13 14 15 16
Source: RBCCM, MFS
when the spread was more pronounced.
S½ã OÄ UCB PÊÙã¥Ê½®Ê Hʽ®Ä¦Ý (ã DÃÙ 2015)
• 407 INTERNATIONAL • ENBRIDGE PIPELINES INC • NAV CANADA
• BANK OF MONTREAL • FORD AUTO SECURITIZATION • POWER FINANCIAL GROUP
• BANK OF NOVA SCOTIA • HONDA CANADA FINANCE INC • ROYAL BANK OF CANADA
• BMW CANADA INC. • HSBC BANK CANADA • TMX GROUP LTD
• CANADIAN IMPERIAL BANK • JOHN DEERE CANADA FUNDING • TORONTO DOMINION BANK
• CATERPILLAR FINANCIAL INC • TOYOTA CREDIT CANADA
• CANADIAN UTILITIES INC • MANULIFE BANK OF CANADA • TRANSCANADA PIPELINES LTD
• ENBRIDGE INC • NATIONAL BANK OF CANADA • WELLS FARGO CANADA
Corporate spreads widened, particularly within lower-rated credit tiers and especially within energy. Given that a lot of
pain has already been priced into the corporate bond market, we see very good value in overweighting credit assuming
the current backdrop of slow global growth, low inflation, and easy policy remains intact, but we remain selective as
the credit cycle matures.
MFS Fourth Quarter 2015 One Investment Program Report
We are overweight investment grade corporate bonds versus government bonds as corporates offer a combination of
incremental yield and shorter duration.
TD Wealth – Market Outlook Q1 2016
17THE
CANADIAN EQUITY PORTFOLIO PERFORMANCE
Although not an ideal year for equity returns, in 2015 the One Equity Portfolio helped to reduce the risk faced by our
municipal investors. The One Equity Portfolio outperformed the TSX Composite and TSX 60 indices returning -0.63%
compared to -8.32% and -7.76%, respectively. This is a significant outperformance by the One Equity product in a tough
investment climate. As at December 31, 2015, on an annualized basis, the One Equity Portfolio net return was 6.31%
since its January 2007 inception.
FIGURE 13: OÄ EØç®ãù RãçÙÄ òÝ. BÄ«ÃÙ» TSX CÊÃÖÊÝ®ã Ä TSX 60 IÄ®Ý S®Ä JÄ 2007 IÄÖã®ÊÄ
Annual returns as well as cumulative returns since inception for the One Equity Portfolio, the S&P TSX Composite and
the S&P TSX 60 Indices are shown in Figure 13.
Figure 14 illustrates One Equity Portfolio balances for each year-end since the 2007 inception. Through 2015 the
portfolio balance increased $37.7.4M to $200.3M. That increase in the portfolio total balance was comprised of -$1.7M
in investment gains and $39.5M in net additional deposits. The December 2015 closing balance exceeded the 2014
closing balance by 23%. In 2015 the number of participating investors in the portfolio grew by 7 to 33.
FIGURE 14: OÄ EØç®ãù PÊÙã¥Ê½®Ê YÙ EÄ B½ÄÝ (IÄÖã®ÊÄ ãÊ DÃÙ 31, 2015 ®Ä $M®½½®ÊÄÝ)
18THE
ABOUT THE ONE CANADIAN EQUITY PORTFOLIO
Although volatile in the short term, One staff and our portfolio manager, Guardian Capital LP, firmly believe that the
One Equity portfolio can be of tremendous value to your organization in producing incremental additional investment
income for any long term capital project that may be planned. If you are interested in learning more about the One Equity
portfolio, it composition, or other period returns, please contact One Program staff.
The One Equity Portfolio is intended for investment durations of 5+ years
You should consider it suitable for:
• Long-term infrastructure funding
• Capital asset maintenance and remediation reserves
The Portfolio invests in a diversified, conservatively managed portfolio of high quality equity securities issued by
Canadian corporations.
Performance benchmark:
• Based on world-wide sector weightings as opposed to TSX weightings. This avoids the TSX heavy weighting in
the oils, mining and financial industries.
19THE
FROM GUARDIAN CAPITAL
2015 Fourth Quarter Report for the One Investment Equity Program
Outlook & Positioning:
The outlook has been uncertain for most of 2015 and is arguably more uncertain as we enter 2016. This is best
evidenced by extreme volatility, as well as declines in global financial and commodity markets. Softening economic
growth in China and other developing economies has served as a catalyst to declining commodity prices - and in turn
resulted in considerable share price weakness. Oil and natural gas have captured the most headlines, however, prices
for base metals, iron ore and gold all experienced declines during the fourth quarter of 2015. The result was a double
digit decline for the full calendar year. Lumber, tied to healthy U.S. housing demand, rallied during the quarter but still
had a double digit full year decline. It is difficult to determine when Chinese economic strength and associated demand
for commodities will resume. Nonetheless, there is still considerable stimulus in the system. Economic performance
in Canada is a question mark, especially because of the importance of the Energy sector to overall economic growth.
Oil (WTI) has corrected to the mid $30’s and companies are assuming continued low prices when making business
decisions.
Notwithstanding an uncertain outlook for many commodities, the portfolio’s commodity exposure is prudently diversified.
Guardian has used recent market weakness to reduce underweights in commodity based sectors, while at the same time
remaining disciplined on quality. Energy holdings in the portfolio have been focused on senior integrated, exploration and
production companies that are characterized by financial strength. Resource holdings that demonstrated deteriorating
financials were culled from the portfolio. Guardian increased exposure to gold equities as well.
Given the uncertain economic backdrop for most countries outside of the United States, equity markets are expected
to remain volatile. Within Canadian equities, the outlook for commodity prices, and in turn resources, remains uncertain,
however we are becoming more comfortable with the outlook for oil at recent levels. Our focus continues to be on high
quality companies that generate internal cash flow, even in depressed commodity price environments. The portfolio
remains overweight in the defensive consumer stocks and has no exposure to Healthcare.
20THE
LOOKING AHEAD TO 2016
• In an effort to further assist other portions of the MUSH sector, staff will continue to promote the One Investment
program to conservation authorities and other municipal boards. If your organization is interested in learning
more about the One Investment Program, please let us know.
• The One Investment Program will continue to market our High Interest Savings Account (HISA) to Ontario
municipalities to help them earn more on their short term investment reserves. HISA currently earns 1% with
full investment liquidity
• Investment education seminars are planned for venues across the province again in 2016. Sessions are planned
for the following locations and dates:
• September 9, London
• September 30, Owen Sound
• October 6, Sudbury
• October 13, Kingston
• October 27, Peterborough
• One will complete an annual performance review of all portfolio managers via our third party investment
consultant and will provide a summary of the review results to interested investors in spring 2016.
• LAS/AMO and MFOA/CHUMS will continue to lobby for broader investment powers for the One Investment Program
to allow for better investment opportunities for Ontario municipalities.
21THE
APPENDIX ONE
MONEY MARKET PORTFOLIO PARTICIPANTS BY MUNICIPAL DEPOSIT AT DEC. 31, 2015
INVESTMENT MUNICIPAL TOTAL DEPOSIT AVG. DEPOSIT % OF TOTAL
PARTICIPANTS IN RANGE IN RANGE DEPOSIT
LESS THAN $100K 21 $602,491 $28,690 1.10%
$100K TO $500K 13 $3,963,322 $304,871 7.24%
$500K TO $1M 10 $6,960,016 $696,002 12.71%
$1M TO $5M 14 $32,148,145 $2,296,296 58.70%
GREATER THAN $5M 2 $11,089,815 $5,544,907 20.25%
TOTALS 60 $54,763,788 100.00%
BOND MARKET PORTFOLIO PARTICIPANTS BY MUNICIPAL DEPOSIT AT DEC. 31, 2015
INVESTMENT MUNICIPAL TOTAL DEPOSIT AVG. DEPOSIT % OF TOTAL
PARTICIPANTS IN RANGE IN RANGE DEPOSIT
LESS THAN $100K 8 $252,239 $31,530 0.09%
$100K TO $500K 24 $6,629,733 $276,239 2.49%
$500K TO $1M 13 $9,116,769 $701,290 3.43%
$1M TO $5M 27 $61,003,451 $2,259,387 22.94%
GREATER THAN $5M 11 $188,964,472 $17,178,588 71.05%
TOTALS 83 $265,966,665 100.00%
CORPORATE BOND PORTFOLIO PARTICIPANTS BY MUNICIPAL DEPOSIT AT DEC. 31, 2015
INVESTMENT MUNICIPAL TOTAL DEPOSIT AVG. DEPOSIT % OF TOTAL
PARTICIPANTS IN RANGE IN RANGE DEPOSIT
LESS THAN $100K 4 $96,050 $24,013 0.05%
$100K TO $500K 10 $2,661,203 $266,120 1.50%
$500K TO $1M 4 $2,998,202 $749,550 1.69%
$1M TO $5M 10 $20,044,050 $2,004,405 11.32%
GREATER THAN $5M 9 $151,325,616 $16,813,957 85.43%
TOTALS 37 $177,125,121 100.00%
CANADIAN EQUITY PORTFOLIO PARTICIPANTS BY MUNICIPAL DEPOSIT AT DEC. 31, 2015
INVESTMENT MUNICIPAL TOTAL DEPOSIT AVG. DEPOSIT % OF TOTAL
PARTICIPANTS IN RANGE IN RANGE DEPOSIT
LESS THAN $100K 4 $207,764 $51,941 0.10%
$100K TO $500K 6 $1,739,589 $289,931 0.87%
$500K TO $1M 6 $4,737,608 $789,601 2.37%
$1M TO $5M 6 $14,845,240 $2,474,207 7.41%
GREATER THAN $5M 11 $178,749,811 $16,249,983 89.25%
TOTALS 33 $200,280,011 100.00%
22THE
APPENDIX TWO
MONEY MARKET PORTFOLIO PARTICIPANTS BY MUNICIPAL DEPOSIT AT DEC. 31, 2014
INVESTMENT MUNICIPAL TOTAL DEPOSIT AVG. DEPOSIT % OF TOTAL
PARTICIPANTS IN RANGE IN RANGE DEPOSIT
LESS THAN $100K 18 $592,870 $32,937 0.46%
$100K TO $500K 12 $3,518,118 $293,176 2.74%
$500K TO $1M 9 $6,161,354 $684,595 4.80%
$1M TO $5M 13 $28,528,076 $2,194,467 22.22%
GREATER THAN $5M 6 $89,565,932 $14,927,655 69.77%
TOTALS 58 $128,366,350 100.00%
BOND MARKET PORTFOLIO PARTICIPANTS BY MUNICIPAL DEPOSIT AT DEC. 31, 2014
INVESTMENT MUNICIPAL TOTAL DEPOSIT AVG. DEPOSIT % OF TOTAL
PARTICIPANTS IN RANGE IN RANGE DEPOSIT
LESS THAN $100K 10 $363,293 $36,329 0.17%
$100K TO $500K 19 $4,945,876 $260,309 2.36%
$500K TO $1M 10 $6,530,568 $653,057 3.12%
$1M TO $5M 21 $49,633,145 $2,363,483 23.73%
GREATER THAN $5M 10 $147,687,653 $14,768,765 70.61%
TOTALS 70 $209,160,536 100.00%
CORPORATE BOND PORTFOLIO PARTICIPANTS BY MUNICIPAL DEPOSIT AT DEC. 31, 2014
INVESTMENT MUNICIPAL TOTAL DEPOSIT AVG. DEPOSIT % OF TOTAL
PARTICIPANTS IN RANGE IN RANGE DEPOSIT
LESS THAN $100K 6 $163,965 $27,327 0.16%
$100K TO $500K 8 $1,555,544 $194,443 1.54%
$500K TO $1M 4 $2,998,548 $749,637 2.98%
$1M TO $5M 7 $17,656,356 $2,522,337 17.54%
GREATER THAN $5M 5 $78,317,441 $15,663,488 77.78%
TOTALS 30 $100,691,855 100.00%
CANADIAN EQUITY PORTFOLIO PARTICIPANTS BY MUNICIPAL DEPOSIT AT DEC. 31, 2014
INVESTMENT MUNICIPAL TOTAL DEPOSIT AVG. DEPOSIT % OF TOTAL
PARTICIPANTS IN RANGE IN RANGE DEPOSIT
LESS THAN $100K 2 $97,386 $48,693 0.06%
$100K TO $500K 3 $772,913 $257,638 0.48%
$500K TO $1M 5 $3,789,167 $757,833 2.33%
$1M TO $5M 7 $15,822,960 $2,260,423 9.73%
GREATER THAN $5M 9 $142,078,175 $15,786,464 87.40%
TOTALS 26 $162,560,600 100.00%
23Jointly administered by
Local Authority Services & CHUMS Financing Corporation –
Serving Ontario’s Public Sector
Jason Hagan, LAS Program Manager Tom Bradbury, Policy Advisor, MFOA
416.971.9856 ext. 320 905.304.4429
Fax: 416.971.6191 Alt: 905.973.2898
jhagan@amo.on.ca tom@mfoa.on.ca
THE ONE FINANCIAL INVESTMENT CHOICE FOR YOUR MUNICIPALITY.
LEARN MORE AT WWW.ONEINVESTMENTPROGRAM.CAYou can also read