Housing statistics 1 April 2019 - 30 September 2019 - Published 3 December 2019 Making homes happen - Gov.uk
←
→
Page content transcription
If your browser does not render page correctly, please read the page content below
Making homes happen

Housing statistics
1 April 2019 – 30 September 2019
Published 3 December 2019

                            OFFICIAL
Contents

1. Key results ............................................................................................................... 3

2. Introduction ............................................................................................................. 4

3. Housing outputs ....................................................................................................... 6

4. Accompanying tables ............................................................................................. 11

5. Revisions................................................................................................................ 12

6. Definitions ............................................................................................................. 13

7. Data sources and quality ........................................................................................ 15

8. Related statistics ................................................................................................... 15

9. Other information .................................................................................................. 17

10. User consultation ................................................................................................. 18

Annexe 1 ................................................................................................................... 19

Annexe 2 ................................................................................................................... 24

Page 2

                                                             OFFICIAL
1. Key results
1.1    In the six-month period between 1 April and 30 September 2019 there were 16,955 housing starts on
       site and 14,792 housing completions delivered through programmes managed by Homes England in
       England (excluding London for all programmes except those administered by Homes England on
       behalf of the Greater London Authority (GLA)). Levels of starts were the highest for 10 years and,
       while there was a small decrease from the same period last year, levels of completions are the second
       highest they have been since 2011. Homes England manages the Help to Buy (Equity Loan) scheme
       in England but the completions are reported by the Ministry of Housing, Communities and Local
       Government (MHCLG) available from the webpage linked below1 and are, therefore, excluded from
       this publication.

1.2    12,310 or 73 per cent of housing starts on site in this period were for affordable homes. This represents
       an increase of 24 per cent on the 9,893 affordable homes started in the same period last year.
       Numbers of affordable starts were the highest for over 10 years.

1.3    5,157 affordable homes started were for Affordable Rent, a reduction of 9 per cent on the 5,698
       started in this period last year. A further 3,886 were for Intermediate Affordable Housing schemes,
       including Shared Ownership and Rent to Buy. This is an increase of 5 per cent on the 3,702 started in
       this period last year. 664 were for Social Rent, an increase of 35 per cent on the 493 started in the
       same period last year. In addition, a further 2,603 affordable homes started with tenure to be
       confirmed2. Of the affordable homes started in this period, the highest delivering programmes were:
       Shared Ownership and Affordable Homes Programme (SOAHP) 2016-213 with 89 per cent (up from
       85 per cent) and the Single Land Programme (SLP) with 5.2 per cent (up from 3 per cent).

1.4    10,295 (70 per cent) of housing completions were for affordable homes. This represents a reduction
       of 7 per cent on the 11,072 affordable homes completed in the same period last year. The drop in
       affordable completions is a result of delivery at certain points of a programme cycle of different and
       overlapping funding streams. Remaining delivery through the 2015-18 AHP is tapering off as
       expected as allocations complete. The 2015-18 AHP was followed by the launch of the SOAHP 2016-
       21 which is now seeing increasing delivery.

1.5    6,405 affordable homes completed were for Affordable Rent, a decrease of 19 per cent on the 7,918
       completed in the same period last year. A further 3,371 were for Intermediate Affordable Housing
       schemes, including Shared Ownership and Rent to Buy, an increase of 19 per cent on the 2,834
       completed in the same period last year. The remaining 519 were for Social Rent, a 62 per cent increase
       on last year’s 320. Of the affordable homes completed, the highest delivering programmes were the
       SOAHP 2016-21 with 74 per cent, the AHP 2015-18 with 20 per cent and the SLP with 2.3 per cent.

1 https://www.gov.uk/government/collections/help-to-buy-equity-loan-and-newbuy-statistics
2 Affordable Tenure TBC refers to units that have reached the start on site milestone but where the tenure of these units has not
yet been specified. This was introduced as a flexibility for Strategic Partnerships to enable them to determine tenure close to or at
the point of completion. These starts will be restated under their specified tenure headings in future national statistics updates
once the tenure has been established at completion.
3 The SOAHP was launched in April 2016.

Page 3

                                                            OFFICIAL
2. Introduction
Geographical coverage
2.1 This release presents the housing starts on site and housing completions delivered by Homes England
between 1 April 2009 and 30 September 2019 in England excluding London (for both the current and
historical series4) with the exception of the Build to Rent, Builders Finance Fund, Get Britain Building
and The Home Building Fund – Short Term Fund (HBF – STF)5 programmes which are administered
by Homes England on behalf of the Greater London Authority (GLA) and where delivery covers all of
England including London.
Purposes and uses
2.2 The figures in this release show the supply of affordable and market housing delivered through Homes
England’s programmes6 with the exception of Help to Buy (Equity Loan scheme), the statistics for
which are published quarterly by MHCLG7. Further details on housing types are available in section 6
of this release. MHCLG also publishes annual statistics on affordable housing supply in England8
showing the gross annual supply of affordable homes, irrespective of funding mechanism. Further
information on the Affordable Housing Supply and Help to Buy releases is provided in section 8 of this
release.
2.3 The data in this release are used by MHCLG to monitor delivery of affordable homes as part of the
MHCLG business plan (see paragraph 8.3). Homes England uses the data to measure progress
towards commitments made in its published Strategic Plan 9 and its Annual Business Plan. Local
authorities also use the data when compiling their annual return to MHCLG for the purpose of
calculating the enhancement for affordable housing under the New Homes Bonus (NHB), a grant for
local authorities to incentivise new housing supply.
What is included in this release?
2.4 This is the first release of data relating to delivery for the financial year ending 31 March 2020 and
covers all current and historical programmes delivered by Homes England (summarised in Annex 1).
These include the acquisition of existing land or property as well as new house building, and some
programmes provide a mix of affordable and market housing. Affordable housing may be for home
ownership (on Shared Ownership or Rent to Buy terms) or for rent.
2.5 Housing starts on site and housing completions are reported for each programme, where applicable.
2.6 A programme breakdown of the data is available in Table 1 of the tables accompanying this release10.
Further information on the accompanying tables is provided in section 4 of this release. Table A of
4 As housing starts on site and completions are recorded by their geographical location, this release may exclude homes located
outside London where the funding was allocated to a local authority district within London.
5 The Home Building Fund – Short Term Fund was launched on 3 October 2016 and includes the Builders Finance Fund.
6 See Annex 1 for a summary and links to information about Homes England’s programmes.
7 https://www.gov.uk/government/collections/help-to-buy-equity-loan-and-newbuy-statistics
8 https://www.gov.uk/government/collections/affordable-housing-supply
9 https://www.gov.uk/government/publications/homes-england-strategic-plan-2018-19-to-2022-23
10 https://www.gov.uk/government/collections/housing-statistics
Page 4
OFFICIALthe latest annual statistics on affordable housing supply in England published by MHCLG11 shows how
Homes England programmes relate to the statistics on affordable housing published by MHCLG.
How is new subsidised housing provided?
2.7 Affordable homes delivered through Homes England programmes are funded by central government.
The funding is administered by Homes England to fund investment partners (including private
registered providers, house builders, community groups and local authorities) to deliver affordable
housing.
2.8 With the exception of the Single Land Programme (SLP), funding for all programmes is allocated
through an application/bidding process based on the assessment eligibility/criteria for each
programme. Funding is paid in accordance with the contractual agreement for each programme.
Investment for projects delivered under the SLP is determined in accordance with Homes England’s
Financial Framework12.
London
2.9 Since April 2012, the Mayor of London has had oversight of strategic housing, regeneration and
economic development in London. This means that Homes England no longer publishes housing
starts on site and completions for London, except where Homes England is administering a
programme on behalf of the GLA. The historical series for London, which reflects past delivery by
Homes England, is included in Homes England’s housing statistics published on 12 June 2012 (revised
24 August 2012) available from the housing statistics page on the Homes England section of
GOV.UK13.
2.10 MHCLG has combined the affordable housing statistics in this release with the GLA’s affordable
housing statistics to produce Table 1012 showing total affordable housing starts on site and
completions delivered nationally under the affordable housing programmes of Homes England and
the GLA14. This table excludes additional affordable housing delivery reported annually through local
authority returns, which are included in MHCLG’s full annual release on affordable housing supply in
England11. The table includes any revisions made to London data since it was published by Homes
England on 12 June 2012 (revised 24 August 2012). Further details are provided in section 8 of this
release.
11 https://www.gov.uk/government/collections/affordable-housing-supply
12 https://www.gov.uk/government/publications/homes-and-communities-agency-financial-framework
13 https://www.gov.uk/government/collections/housing-statistics
14 https://www.gov.uk/government/statistical-data-sets/live-tables-on-affordable-housing-supply
Page 5
OFFICIAL3. Housing outputs
This section provides the detailed statistics for housing starts and completions by tenure. It includes
all Homes England programmes and analyses them over time15.
Starts on site
Table 1a: Housing starts on site by tenure, England (excluding non-Homes England London delivery) 1, 2
Intermediate Affordable
Housing Total
Affordable Total
Affordable Affordable 5
Social Rent Affordable Tenure Market Housing
Rent Intermediate 3
Housing
Home TBC 4 Starts
Rent Starts
Ownership
6
2019-20 Apr - Sep 5,157 664 85 3,801 2,603 12,310 4,645 16,955
6
2018-19 Apr - Sep 5,698 493 190 3,512 .. 9,893 5,906 15,799
6
2018-19 Oct - Mar 12,074 738 170 7,688 .. 20,670 9,223 29,893
6
2018-19 Full Year 17,772 1,231 360 11,200 .. 30,563 15,129 45,692
6
2017-18 Apr - Sep 4,526 294 12 2,097 .. 6,929 6,789 13,718
6
2017-18 Oct - Mar 12,633 1,112 141 7,061 .. 20,947 8,064 29,011
6
2017-18 Full Year 17,159 1,406 153 9,158 .. 27,876 14,853 42,729
6
2016-17 Apr - Sep 7,218 308 42 1,838 .. 9,406 5,318 14,724
6
2016-17 Oct - Mar 14,895 629 8 4,201 .. 19,733 6,693 26,426
6
2016-17 Full Year 22,113 937 50 6,039 .. 29,139 12,011 41,150
6
2015-16 Apr - Sep 5,858 199 0 1,317 .. 7,374 3,952 11,326
6
2015-16 Oct - Mar 10,686 431 5 2,822 .. 13,944 7,838 21,782
6
2015-16 Full Year 16,544 630 5 4,139 .. 21,318 11,790 33,108
6
2014-15 Apr - Sep 7,487 698 0 1,242 .. 9,427 3,226 12,653
6
2014-15 Oct - Mar 14,392 547 21 2,071 .. 17,031 5,676 22,707
5
2014-15 Full Year 21,879 1,245 21 3,313 .. 26,458 8,902 35,360
2013-14 Apr - Sep 7,418 716 0 1,468 .. 9,602 2,496 12,098
2013-14 Oct - Mar 17,764 1,864 0 3,162 .. 22,790 3,413 26,203
2013-14 Full Year 25,182 2,580 0 4,630 .. 32,392 5,909 38,301
2012-13 Apr - Sep 2,386 387 8 497 .. 3,278 2,239 5,517
2012-13 Oct - Mar 15,670 2,398 26 3,873 .. 21,967 12,294 34,261
2012-13 Full Year 18,056 2,785 34 4,370 .. 25,245 14,533 39,778
1 Since April 2012, the Mayor of London has had oversight of strategic housing, regeneration and economic development in
London. This means that Homes England no longer publishes housing starts on site and completions for London (current and
historical series) except for delivery in London under the Build to Rent, Builders Finance Fund, Get Britain Building and The
Home Building Fund – Short Term Fund (HBF – STF) programmes which are administered by Homes England on behalf of the
GLA. The historical series for London included in Homes England’s housing statistics published on 12 June 2012 (revised 24
August 2012) is available from: https://www.gov.uk/government/collections/housing-statistics
2 Figures by local authority and Homes England’s operating areas are available in the accompanying tables.
3 Tenure will be determined on completion of the unit and will be restated in future releases under its appropriate tenure.
4 Total affordable housing is the sum of Affordable Rent, Social Rent, Intermediate Rent and Affordable Home Ownership.
5 The market units delivered under the Accelerated Land Disposal, Build to Rent, Builders Finance Fund, Economic Assets, Get
Britain Building, Kickstart Housing Delivery, Property and Regeneration, Single Land and the HBF – STF programmes may
include some starts on site and completions which are made available at below market price or rents but do not meet the
definition for affordable housing.
6 To ensure consistent reporting with completions, with effect from 1 April 2014 the range of products reported for affordable
housing starts on site includes the start on site for new build homes where the procurement route is such that the provider
purchases the home at completion. For reporting purposes, the start on site date is taken as the date of completion.
“..” not applicable
15
The tables and charts in this and future releases have been restricted to an eight-year rolling profile in order to avoid
overcrowding pages with excessively long graphics. For earlier years (going back to 2009-10) please see the accompanying tables
and previous releases available at https://www.gov.uk/government/collections/housing-statistics.
Page 6
OFFICIALChart 1a: Housing starts on site
14,000
12,000
10,000
Housing Units
8,000
6,000
Affordable
4,000
Market
2,000
0
Apr-Sep Apr-Sep Apr-Sep Apr-Sep Apr-Sep Apr-Sep Apr-Sep Apr-Sep
2012-13 2013-14 2014-15 2015-16 2016-17 2017-18 2018-19 2019-20
Year
Chart 1b: Affordable Housing starts on site
8,000
7,000
6,000
Housing Units
Affordable
5,000 Rent
4,000
Social Rent
3,000
2,000 Intermediate
Affordable
1,000
Housing
0
Apr-Sep Apr-Sep Apr-Sep Apr-Sep Apr-Sep Apr-Sep Apr-Sep Apr-Sep
2012-13 2013-14 2014-15 2015-16 2016-17 2017-18 2018-19 2019-20
Year
In the period 1 April 2019 to 30 September 2019:
3.1 A total of 16,955 homes started on site, representing an increase of 1,156 or 7 per cent compared to
15,799 started in the same period last year. Levels of starts in this period were the highest for 10 years.
3.2 12,310 or 73 per cent of housing starts on site in this period were for affordable homes. This represents
an increase of 24 per cent on the 9,893 affordable homes started in the same period last year.
Numbers of affordable starts were the highest for over 10 years.
Page 7
OFFICIAL3.3 5,157 affordable homes started were for Affordable Rent, a reduction of 9 per cent on the 5,698
started in this period last year. A further 3,886 were for Intermediate Affordable Housing schemes,
including Shared Ownership and Rent to Buy. This is an increase of 5 per cent on the 3,702 started in
this period last year. 664 were for Social Rent, an increase of 35 per cent on the 493 started in the
same period last year. In addition, a further 2,603 affordable homes started with tenure to be
confirmed. The tenure for these units will not be known until completion and they will be restated
under their appropriate tenure in future releases.
3.4 Table 1b below shows the percentage of Homes England’s affordable housing starts on site delivered
by each operating area compared to this period last year. A map showing the operating area
boundaries is available at Annex 2.
Table 1b: Affordable Housing Starts on Site - Percentage Delivery by Homes England Operating
Area
2019-20 2018-19
Apr-Sep Apr-Sep
South East 34% 35%
South West 20% 15%
North West 18% 16%
Midlands 16% 16%
North East, Yorkshire and The Humber 12% 18%
3.5 The number of market starts on site reduced by 21 per cent to 4,645 compared to 5,906 started in
the same period last year. The SLP produced the majority of these at 2,651 or 57 per cent, a decrease
of 675 or 20 per cent compared to 3,326 started in the same period last year. The HBF – STF delivered
1,994 or 43 per cent. This was a reduction of 586 or 23 per cent compared to the 2,580 started in the
same period last year. The number of market starts tend to fluctuate between periods due to the
nature of the programmes – with relatively fewer projects (compared to affordable housing
programmes) delivering a greater number of units per project and commencing at varying times
throughout the year.
Page 8
OFFICIALCompletions (excluding Help to Buy):
Table 2a: Housing completions by tenure, England (excluding Help to Buy and non-Homes England London
delivery) 1, 2
Intermediate Affordable
Housing Total
Total
Affordable Affordable 5
Social Rent Affordable Market Housing
Rent Intermediate Housing
Home 4 Completions
Rent Completions
Ownership
2019-20 Apr - Sep 6,405 519 16 3,355 10,295 4,497 14,792
2018-19 Apr - Sep 7,918 320 11 2,823 11,072 4,792 15,864
2018-19 Oct - Mar 10,977 641 54 5,966 17,638 6,787 24,425
2018-19 Full Year 18,895 961 65 8,789 28,710 11,579 40,289
2017-18 Apr - Sep 7,219 174 0 1,900 9,293 2,729 12,022
2017-18 Oct - Mar 12,544 796 34 3,135 16,509 5,228 21,737
2017-18 Full Year 19,763 970 34 5,035 25,802 7,957 33,759
2016-17 Apr - Sep 7,096 218 1 1,338 8,653 2,957 11,610
2016-17 Oct - Mar 11,184 373 4 2,671 14,232 5,252 19,484
2016-17 Full Year 18,280 591 5 4,009 22,885 8,209 31,094
2015-16 Apr - Sep 4,681 684 0 1,032 6,397 3,082 9,479
2015-16 Oct - Mar 8,419 813 2 1,759 10,993 4,919 15,912
2015-16 Full Year 13,100 1,497 2 2,791 17,390 8,001 25,391
2014-15 Apr - Sep 7,447 865 0 2,141 10,453 3,682 14,135
2014-15 Oct - Mar 23,387 2,124 18 4,882 30,411 6,218 36,629
2014-15 Full Year 30,834 2,989 18 7,023 40,864 9,900 50,764
2013-14 Apr - Sep 4,569 1,135 84 2,511 8,299 2,540 10,839
2013-14 Oct - Mar 12,525 3,340 19 3,423 19,307 4,281 23,588
2013-14 Full Year 17,094 4,475 103 5,934 27,606 6,821 34,427
2012-13 Apr - Sep 1,074 3,590 135 5,078 9,877 2,258 12,135
2012-13 Oct - Mar 5,505 6,013 239 6,966 18,723 2,882 21,605
2012-13 Full Year 6,579 9,603 374 12,044 28,600 5,140 33,740
1, 2, 4 See
footnotes below Table 1a on page 6
5 Some of the market completions delivered since 2013-14 may include houses sold to purchasers who have received assistance
through the Help to Buy scheme to buy a property at market value from a house builder where the scheme as a whole may have
benefitted from funding through another programme. Help to Buy is reported by MHCLG (see
https://www.gov.uk/government/collections/help-to-buy-equity-loan-and-newbuy-statistics)
Page 9
OFFICIALChart 2a: Housing completions (excluding Help to Buy)
12,000
10,000
Housing Units
8,000
6,000
Affordable
4,000 Market
2,000
0
Apr-Sep Apr-Sep Apr-Sep Apr-Sep Apr-Sep Apr-Sep Apr-Sep Apr-Sep
2012-13 2013-14 2014-15 2015-16 2016-17 2017-18 2018-19 2019-20
Year
Chart 2b: Affordable Housing completions
9,000
8,000
7,000
Affordable Rent
6,000
Housing Units
5,000
4,000 Social Rent
3,000
2,000 Intermediate
Affordable Housing
1,000
0
Apr-Sep Apr-Sep Apr-Sep Apr-Sep Apr-Sep Apr-Sep Apr-Sep Apr-Sep
2012-13 2013-14 2014-15 2015-16 2016-17 2017-18 2018-19 2019-20
Year
In the period 1 April 2019 to 30 September 2019:
3.6 A total of 14,792 homes completed, representing a decrease of 1,072 or 7 per cent compared to the
15,864 completed in the same period last year.
3.7 10,295 affordable homes completed, a decrease of 777 or 7 per cent compared to 11,072 completed in
this period last year. The drop in affordable completions is a result of delivery at certain points of a
programme cycle of different and overlapping funding streams. Remaining delivery through the
2015-18 AHP is tapering off as expected as allocations complete. The 2015-18 AHP was followed by
the launch of the SOAHP 2016-21 which is now seeing increasing delivery.
3.8 6,405 or 62 per cent of affordable completions were for Affordable Rent, a decrease of 1,513 or 19 per
cent compared to the 7,918 completed in the same period last year. Intermediate Affordable Housing
accounted for a further 3,371 or 33 per cent, an increase of 537 or 19 per cent compared to the 2,834
completed in this period last year. The remaining 519 or 5 per cent of affordable homes completed
were for Social Rent, an increase of 199 or 62 per cent compared to the 320 completed in the same
period last year. These fluctuations reflect the tenure balance allocated in the early years of the 2016-
21 funding period with funding parameters subsequently opening up to Affordable Rent and Social
Rent.
Page 10
OFFICIAL3.9 Table 2b below shows the percentage of Homes England’s affordable housing completions delivered
by each operating area compared to the same period last year.
Table 2b: Affordable Housing Completions - Percentage Delivery by Operating Area
2019-20 2018-19
Apr-Sep Apr-Sep
South East 29% 26%
South West 22% 24%
North West 17% 13%
North East, Yorkshire and The Humber 16% 17%
Midlands 16% 20%
3.10 4,497 market homes completed, a decrease of 295 or 6 per cent on the 4,792 that completed in this
period last year. Fluctuations in the number of market completions between periods reflects the
nature of the programmes, with different types and sizes of sites commencing at different times and
having varying build-out rates. The principal components are the SLP (2,316 completions, a decrease
of 619), the HBF - STF (1,704 completions, an increase of 325) and BTR (388 completions, a decrease
of 13).
4. Accompanying tables
4.1 The tables accompanying this release are available to download from the housing statistics page on
the Homes England section of GOV.UK16 and include the following:
Table 1
Housing starts on site and completions by programme and tenure for:
1 April 2019 – 30 September 2019
1 April 2018 – 31 March 2019 with half year analysis
1 April 2017 – 31 March 2018 with half year analysis
1 April 2016 – 31 March 2017 with half year analysis
1 April 2015 – 31 March 2016 with half year analysis
1 April 2014 – 31 March 2015 with half year analysis
1 April 2013 – 31 March 2014 with half year analysis
1 April 2012 – 31 March 2013 with half year analysis
1 April 2011 – 31 March 2012 with half year analysis
1 April 2010 – 31 March 2011 with half year analysis
1 April 2009 – 31 March 2010 with half year analysis
Table 2
Housing starts on site and completions by local authority district and tenure (all programmes except
Help to Buy), 1 April 2019 – 30 September 2019.
4.2 Housing starts on site and completions by local authority district and tenure (all programmes except
Help to Buy) for historical periods are available to download from the Homes England housing
statistics web page16.
16 https://www.gov.uk/government/collections/housing-statistics
Page 11
OFFICIAL4.3 In a small number of cases, Homes England funding to an affordable housing provider may be to
support a person or family to be housed in a local authority that is different to the one in which they
currently reside. The local authority presentations in Table 2 are based on the local authority district
in which the house is located. This table also identifies the Homes England operating area in which
each local authority is located.
4.4 We can provide programme level statistics for specified local authority areas in response to requests
made to housing.statistics@homesengland.gov.uk marked for the attention of Mike Shone.
5. Revisions
Revisions policy
5.1 Homes England has adopted the revisions policy developed by MHCLG17. This policy covers two types
of revisions.
Scheduled revisions
5.2 These statistics are drawn from funding and project administration systems and therefore updated
information can be provided by funding recipients and developers after the official statistics have
been extracted and compiled from these systems. This is particularly the case during the financial
year and figures for the first six months of the year, as reported in the November/December release,
are subject to scheduled revision in the release of financial year data in June. It is also possible for
revisions to be made for earlier periods, although procedures are in place to minimise the scale of
these.
5.3 As notified in our release of official statistics published on 11 June 2013, we will make scheduled
revisions once a year in June. These revisions will cover the first six months of the full year being
reported together with revisions for the previous two financial years. Data for earlier years will be
regarded as final and there will be no further changes.
Non-scheduled revisions
5.4 If a substantial error occurs as a result of the production process, the statistical release and
accompanying tables will be updated with a correction notice as soon as is practical.
5.5 If, as a result of new information, there are significant changes to the figures in years outside of the
scheduled revisions period, that information will be revised in the May/June release together with
scheduled revisions.
If you would like to comment on our revisions policy please contact Mike Shone by email at
housing.statistics@homesengland.gov.uk.
17
http://www.communities.gov.uk/documents/corporate/pdf/1466387.pdf
Page 12
OFFICIAL6. Definitions
Affordable housing
Affordable Housing is the sum of Affordable Rent, Social Rent, Intermediate Rent and Affordable Home
Ownership (Shared Ownership and Rent to Buy). Affordable homes are defined in line with the National
Planning Policy Framework18, published 27 March 2012 and updated 19 February 2019, as housing units (or
traveller pitches and bed spaces when describing a shared dwelling such as a hostel) provided to specified
eligible households whose needs are not met by the market. Eligibility may be determined with regard to
local authority allocations policies, local incomes and local house prices depending on the type of
affordable housing. Affordable housing should include provisions to remain at an affordable price for
future eligible households or for the subsidy to be recycled for alternative affordable housing provision.
The term ‘affordable housing’ is equivalent to ‘social housing’ as defined in Section 68 of the Housing and
Regeneration Act 200819.
Affordable rented housing
Affordable rented housing is a form of social housing, introduced in 2011. It may only be delivered with
grant through the AHP 2011-15 and other associated and subsequent programmes or without grant by local
authority and other providers, where a contract or confirmation of the ability to charge an Affordable Rent
is in place. Affordable rented homes are let by local authorities or private registered providers of social
housing to households who are eligible for social rented housing. Affordable Rent is subject to rent controls
that require a rent of up to 80 per cent of the local market rent (including service charges, where applicable).
Social rented housing
Social rented housing is rented housing owned and managed by local authorities and private registered
providers, for which target rents are determined through the national rent regime. It may also include
rented housing managed by other persons and provided under equivalent rental arrangements to the above.
Immediate affordable housing
Intermediate affordable housing is housing at prices and rents above those of Social Rent but below
market price or rents, and which meet the criteria as set out in the definition for affordable housing. These
can include Shared Ownership, equity loan products, Rent to Buy and Intermediate Rent. Intermediate
rented housing was eligible for funding under the now closed NAHP.
Equity loan scheme
Under an equity loan scheme for affordable housing, the majority of the cost (usually at least 70 per cent)
is funded by the purchaser through a mortgage and savings (deposit). The remaining cost of the home is
paid for by the government and the house builder through an equity loan. The property title is held by the
home owner who can therefore sell their home at any time and upon sale should provide the government
and the house builder the value of the same equity share of the property when it is sold. In the historical
series covered by this release, equity loan was available under FirstBuy, Kickstart and the NAHP (HomeBuy
Direct). There are a small number of equity loan cases in the current series.
Shared Ownership scheme
18 https://www.gov.uk/government/publications/national-planning-policy-framework--2
19 http://www.legislation.gov.uk/ukpga/2008/17/pdfs/ukpga_20080017_en.pdf
Page 13
OFFICIALUnder a Shared Ownership scheme for affordable housing, the purchaser pays for an initial share of
between 25 per cent and 75 per cent of the home’s value with the option to increase their ownership if they
later choose and can afford to do so. The provider owns the remaining share and rent is paid on the
landlord’s share. The rent is up to 3 per cent of the share’s value. Shared ownership properties are always
leasehold homes.
Rent to Buy scheme
Under the Rent to Buy scheme for affordable housing, homes are let at an Intermediate Rent to tenants
who plan to buy in the future but need a period of lower rents to help them to save for a deposit. After an
initial rental period (at least the first five years of the life of the property) the tenant has the option to buy
outright the home they are living in. Grant funded Intermediate Rent has to be set at no more than 80 per
cent of the market rate.
Market housing
Market housing is private housing (or bed spaces) for rent or for sale where the rental value or market price
is set mainly in the open market.
Acquisitions (non-new build)
Acquisitions (non-new build) are additions to affordable or market housing supply that take place without
building a new property. This can include the purchase of existing properties for use as affordable or market
housing. It may also include empty properties brought back into use. These will normally be long term
empty properties where rehabilitation works are required and which would not otherwise come back into
use without intervention. Conversions of existing affordable or market properties are only included where
there is substantial re-improvement works carried out to the fabric of the building (for example the
conversion of bedsits to self-contained apartments). Repairs or simple refurbishment of properties are not
included.
Housing starts on site
Housing starts on site are reported when the provider/developer and builder have entered into the house
building contract, the building contractor has taken possession of the site and the start on site works have
commenced. Starts on site are not applicable for Mortgage Rescue or for equity loan products delivered
under FirstBuy.
Housing completions
Housing completions are reported when the units are fit for occupation or, in the case of Mortgage Rescue
and equity loan products delivered under FirstBuy, the Kickstart Housing Delivery Programme, the AHP
2011-15 and the National Affordable Housing Programme, at the point of completion of the purchase.
Private registered providers
Private registered providers, under the terms of the 2008 Housing and Regeneration Act20, are
organisations which provide social housing, either in a for-profit or not-for-profit capacity, and who are
registered on the Statutory Register of Providers of Social Housing maintained by Homes England. Most
private registered providers are housing associations. The term excludes local authorities, who also
provide social housing. Any private provider wishing to deliver Affordable Rent homes, who has not
contracted with Homes England through a Grant Agreement, must contract with Homes England through
a Short Form Agreement to deliver Affordable Rent without grant. The definition of private registered
20 http://www.legislation.gov.uk/ukpga/2008/17/pdfs/ukpga_20080017_en.pdf
Page 14
OFFICIALproviders is not affected by the Office for National Statistics’ recent decision to classify them to the private
sector for National Accounts and statistical purposes.
7. Data sources and quality
7.1 Data for the following programmes have been produced using our Investment Management System
(IMS), which contains information provided by investment partners in accordance with monitoring
requirements for the payment of grant: Affordable Homes Guarantees, AHP, AHP 2015-18, Care and
Support Specialised Housing, Empty Homes, Empty Homes Round Two, FirstBuy, Homelessness
Change, Homelessness Change 2015-18, the Kickstart Housing Delivery Programme (HomeBuy
Direct and National Affordable Housing Programme), the Local Authority New Build Programme,
Mortgage Rescue, the National Affordable Housing Programme, Platform for Life, Rent to Buy, Right
to Buy Replacement, Short Form Agreements, SOAHP 2016-21 and Traveller Pitch Funding.
7.2 Data for the following programmes have been produced using our Project Control System, which is
maintained by our own staff based on the best information currently available: Accelerated Land
Disposal, Build to Rent, Builders Finance Fund, Economic Assets, Get Britain Building, Kickstart
Housing Delivery (Investment Support), Property and Regeneration, Single Land and the HBF – STF
programmes.
8. Related statistics
Affordable housing starts on site and completions funded
by Homes England and the GLA
8.1 Since April 2012, the Mayor of London has had oversight of strategic housing, regeneration and
economic development in London. This means that Homes England no longer publishes affordable
housing starts on site and completions for London, except for delivery in London under the Builders
Finance Fund (now called The Home Building Fund – Short Term Fund) and Get Britain Building
programmes which are administered by Homes England on behalf of the GLA. Responsibility for
publication of other London delivery has been taken over by the GLA. In addition to its annual release,
MHCLG combines half-year data from Homes England and the GLA to publish six monthly affordable
housing starts on site and completions delivered nationally under the affordable housing programmes
of Homes England and the GLA.
8.2 The combined statistics published by MHCLG are available from the MHCLG website21 and housing
statistics published by the GLA are available from the GLA website22.
8.3 Delivery of affordable homes forms part of the MHCLG business plan. Homes England is responsible
for the administration of the programmes that deliver affordable housing (as described in section 2)
and report on progress in their annual report23.
Affordable housing supply
21 https://www.gov.uk/government/collections/affordable-housing-supply
22 https://www.london.gov.uk/what-we-do/housing-and-land/increasing-housing-supply/affordable-housing-statistics
23 https://www.gov.uk/government/publications
Page 15
OFFICIAL8.4 The annual Affordable Housing Supply release published by MHCLG (see paragraph 2.2), includes
delivery of affordable housing, but not market housing. Starts information was only available from
data provided by Homes England and the GLA in 2015-16. For 2016-17 data on starts was also
collected from local authorities. However, the submission of starts data by local authorities is
voluntary as some of them may be unable to provide figures. This means that starts funded directly
by local authorities or by planning agreements that are not included in the Homes England or GLA
statistics were not included in 2015-16 data and may be under reported in subsequent publications.
Delivery through Homes England (and the GLA) accounts for the majority of Affordable Housing
Supply, but the scope of the statistics reported by MHCLG is wider. It also includes delivery through
other Homes England and GLA programmes not reported here (such as Social HomeBuy and Right
to Acquire) as well as affordable housing not covered by Homes England and GLA programmes that
is reported in local authority returns to the Ministry. The MHCLG publication provides less detail
about the individual Homes England programmes and focuses more on the properties of the units
delivered, such as tenure and whether they are new build or acquisitions. The ‘Data sources’ section
of the MHCLG release provides more information about the coverage of the release24.
Help to Buy
8.5 The Help to Buy (Equity Loan scheme) release published by MHCLG details the number of home
purchases and the value of equity loans under the Government’s Help to Buy: Equity Loan scheme.
Homes England is responsible for all Help to Buy (Equity Loan scheme) delivery including London.
The number of home purchases delivered through Homes England is published by MHCLG together
with information about the type and price of properties purchased, purchaser deposits and applicant
incomes25.
24 https://www.gov.uk/government/collections/affordable-housing-supply
25 https://www.gov.uk/government/collections/help-to-buy-equity-loan-and-newbuy-statistics
Page 16
OFFICIAL9. Other information
Pre-release access
9.1 Details of officials who receive pre-release access to the release up to 24 hours before publication are
available from the housing statistics page on the Homes England section of GOV.UK26.
A brief history of Homes England
9.2 Homes England was launched by the Secretary of State on 11 January 2018. Homes England is the
trading name of Homes and Communities Agency (HCA) (the legal entity). The HCA was created on
1 December 2008 by bringing together the regeneration body English Partnerships (including the
Property and Regeneration programme), the investment arm of the Housing Corporation (including
the National Affordable Housing Programme), the Academy for Sustainable Communities and a
number of housing and regeneration programmes from the MHCLG. In October 2011, the HCA took
responsibility for the land and property assets of eight of England’s nine Regional Development
Agencies, ahead of their operational closure in March 2012. On 1 April 2012, the HCA’s former London
operating area transferred to the GLA.
United Kingdom Statistics Authority
9.3 The United Kingdom Statistics Authority has designated these statistics as National Statistics, in
accordance with the Statistics and Registration Service Act 2007 and signifying compliance with the
Code of Practice for Official Statistics.
Designation can be broadly interpreted to mean that the statistics:
• meet identified user needs;
• are well explained and readily accessible;
• are produced according to sound methods; and
• are managed impartially and objectively in the public interest.
Once statistics have been designated as National Statistics it is a statutory requirement that the Code
of Practice shall continue to be observed.
Future publication dates
9.4 Our official statistics for the period 1 April 2019 to 31 March 2020 will be published in June/July 2020.
Responsible statistician
9.5 The responsible statistician for this statistical release is Mike Shone.
26
https://www.gov.uk/government/collections/housing-statistics
Page 17
OFFICIAL10. User consultation
10.1 Users’ comments on any issues relating to this statistical release are welcomed and encouraged.
Responses should be sent to the “Statistical Enquiries” address given below:
Enquiries
Media Enquiries Email: media@homesengland.gov.uk
Tel: 020 7874 8262
Statistical Enquiries Mike Shone (c/o)
Email: housing.statistics@homesengland.gov.uk
Tel: 01234 242537
Page 18
OFFICIALAnnexe 1
Homes England’s programmes
The following table and links provide information about Homes England’s programmes which are funded by
the Ministry of Housing, Communities and Local Government except for Care and Support Specialised
Housing, Homelessness Change 2015-18 and Platform for Life which are funded by the Department of
Health:
Programme Programme Summary Tenure 1 Build
Type 2
The Accelerated Land Disposal programme was Social Rent NB
announced in the Budget 2011 to support the / AHO /
Accelerated Land additional or accelerated delivery of 3,000 housing Market
Disposal starts on site by 31 March 2015. With effect from 1
April 2015, existing commitments transferred to the
Single Land Programme.
On 6 September 2012, the Government announced its Aff. Rent / NB/A
proposal to guarantee up to £10bn of debt to help Social Rent
housing providers expand the provision of both / AHO
purpose built private rented and affordable housing.
As well as the Guarantee for the Affordable Homes
Affordable Homes element, the Government confirmed that it would
Guarantees make £225m of funding available for new affordable
housing, for use where needed alongside the
Affordable Homes Guarantee. This funding was then
doubled in the 2013 Budget to £450m, including
London, to support up to 30,000 new affordable
homes.
The Affordable Homes Programme was announced as Aff. Rent / NB/A
part of the Government’s Spending Review 2010 and Social Rent
Affordable Homes
delivered over 58,000 (excluding London) new / AHO
Programme 3
affordable homes by 31 March 2015, with rents set at
up to 80 per cent of market rent.
The Affordable Homes Programme 2015-18 replaced Aff. Rent / NB/A
the Affordable Homes Programme 2011-15 and aims to Social Rent
Affordable Homes
increase the supply of new affordable homes in / AHO
Programme 2015 -
England by March 2018. It is now closed although (Shared
18
commitments agreed under this programme will be Ownership)
delivered during the 2016-21 period.
The Build to Rent Fund was launched in December Market NB
2012 in response to the recommendations of the
Montague report to stimulate new private rented
Build to Rent
housing supply and to provide opportunities for new
institutional investment in the sector. It will support
the delivery of up to 10,000 new homes.
Page 19
OFFICIALProgramme Programme Summary Tenure 1 Build
Type 2
The £525 million Builders Finance Fund is designed to Social Rent NB/A
help restart and speed up housing developments / Int. Rent /
between 5 and 250 units that have slowed down or AHO /
stalled. Its main objective is to address difficulties in Market
Builders Finance
accessing development finance faced by some house
Fund
builders, particularly smaller developers, and to help
bring forward stalled but viable sites. With effect from
October 2016, existing commitments transferred to
the Home Building fund – Short Term Fund.
The Department of Health’s Care and Support Aff. Rent / NB/A
Specialised Housing Fund (CASSH) provides funding Social Rent
for housing for older people and adults with disabilities / AHO
(physical or sensory disabilities, mental health needs (Shared
Care and Support and learning disabilities & autism). Ownership)
Specialised Housing The fund is spilt into two phases. Phase 1 was launched
Fund in October 2012 and phase 2 was launched in February
2015. The initial budget for the programme was £160m
over five years (2013-14 to 2017-18) outside London. In
2013, this was increased by a further £80m and the
delivery time frame extended to 2020-21.
The Economic Assets programme was announced in Social Rent NB/A
the Budget 2011 and worked with partners to ensure / Int. Rent /
the effective use and disposal of more than 300 land AHO /
Economic Assets and property assets transferred from the former Market
Regional Development Agencies. With effect from 1
April 2015, existing commitments transferred to the
Single Land Programme.
The Empty Homes programme was announced as part Aff. Rent / A
of the Government’s Spending Review 2010 to bring Social Rent
back into use empty residential properties (in private / AHO
Empty Homes 3
ownership) as affordable housing. The programme
delivered 2,759 homes by 30 September 2016 outside
London.
In November 2012 a second round of funding was Aff. Rent / A
launched to bring back into use empty properties as Social Rent
affordable housing. As well as residential properties (in / AHO
Empty Homes
private ownership), the programme had an emphasis
Round Two
on the refurbishment of empty commercial and non-
residential properties. The programme delivered 868
homes by 31 March 2017 outside London.
The FirstBuy scheme was announced in the Budget AHO NB
2011 to help support 10,000 first time buyers on the
FirstBuy property ladder. The scheme was expanded in
September 2012 and from 1 April 2013 was replaced
with Help to Buy
The Get Britain Building programme was set up to Social Rent NB
unlock more than 12,000 homes on stalled sites with / Int. Rent /
Get Britain Building
planning permission through access to development AHO /
finance. Market
Page 20
OFFICIALProgramme Programme Summary Tenure 1 Build
Type 2
Help to Buy was announced in the Budget 2013 to help Market NB
purchasers struggling to buy a new build home. It
offers a maximum 20% (40% in London) equity loan
(minimum 10%) on new build properties up to a
maximum purchase price of £600,000.
Launched in April 2013 with an initial budget of £3.7bn,
the programme aspired to support 74,000 plus
homebuyers in the first 3 years. The 2015 Spending
Review confirmed £8.6bn of funding and extended the
programme to 2021 to assist an anticipated 145,000
purchases. In October 2017, the Government
Help to Buy (equity announced it will invest a further £10 billion in the Help
loan) to Buy Equity Loan programme.
More than 130,000 completions have already taken
place by people using the equity loan, which helps
people buy a new build home with only a 5% deposit.
The new funding means that the Help to Buy Equity
Loan could help around 135,000 more people to buy
homes by 2021. This would bring the total number of
households across England that would be supported
through the scheme since it began in 2013 to around
360,000.
The Homelessness Change Programme was Aff. Rent NB/A
announced as part of the Government’s Spending
Homelessness
Review 2010 and delivered 1,128 new or refurbished
Change 3
bed spaces in hostel accommodation by 31 March 2015
(outside London).
Homes England is allocating a share of up to £25 Aff. Rent NB/A
million capital funding for specialist housing providers,
on behalf of the Department of Health, to bring
forward proposals for developing and improving hostel
accommodation and facilities for the delivery of
healthcare, training or education aimed at supporting
Homelessness
rough sleepers, those at risk of sleeping rough, and
Change 2015-18
other non-statutory homeless people of specialist
housing to meet the needs of older people and adults
with disabilities or mental health problems outside of
London.
This programme was launched jointly alongside the
Platform for Life fund in March 2015.
The Kickstart Housing Delivery programme was part of Social Rent NB
Kickstart Housing the 2009 Housing Stimulus Programme investing in / Int. Rent /
Delivery restarting more than 20,000 homes on stalled sites. AHO /
The programme closed on 31 March 2013. Market
Local Authority The Local Authority New Build programme was set up Social Rent NB
New Build to deliver 4,000 homes for rent by 31 March 2012.
Page 21
OFFICIALProgramme Programme Summary Tenure 1 Build
Type 2
The Mortgage Rescue scheme was announced as part AHO / Int. A
of the Government’s Spending Review 2010 to provide Rent
Mortgage Rescue 3 support to some 2,500 vulnerable home owners
struggling to maintain mortgage payments and at risk
of repossession. This scheme is now closed.
National Affordable The National Affordable Housing Programme is the Social Rent NB/A
Housing predecessor to the AHP 2011-15. / Int. Rent /
Programme AHO
Homes England is allocating a share of up to £25 Aff. Rent NB/A
million capital funding for specialist housing providers,
on behalf of the Department of Health, to bring
forward proposals for developing low-rent
accommodation for young people aged 18 to 24 who
are homeless or at risk of homelessness and are in
housing need, to support their participation in work,
Platform for Life
further education or vocational training, with the aim
of assisting residents into long term employment and
independence, and improving their prospects for a
successful and healthy life.
This programme was launched jointly alongside the
Homelessness Change 2015 to 2017 fund in March
2015.
The Property and Regeneration programme covered Social Rent NB/A
all the historical property and regeneration / Int. Rent /
Property and
investments and assets inherited from English AHO /
Regeneration
Partnerships. With effect from 1 April 2015, existing Market
Programme
commitments transferred to the Single Land
Programme.
The Rent to Buy Loan 2015-17 provided loans at a low, AHO NB
fixed rate to registered providers to deliver homes
outside London. The homes will be let at a sub-market
Rent to Buy rent for at least 7 years with the intention of supporting
working households to save money and achieve their
aspiration of home ownership.
This programme is now closed.
With effect from 2 April 2012, every additional local Aff. Rent NB
authority home sold under Right to Buy will be
replaced by a new home for affordable rent, with
Right to Buy receipts from sales recycled towards the cost of
Replacement replacement. Where a local authority decides not to
undertake the development themselves, they return
the relevant portion of the receipts to MHCLG for re-
investment nationally.
This programme aims to increase the supply of Shared Aff. Rent / NB/A
Ownership and other affordable homes in England by Social Rent
Shared Ownership
March 2021. / AHO
and Affordable
(Shared
Homes Programme
Ownership
2016-21
and Rent to
Buy)
Page 22
OFFICIALProgramme Programme Summary Tenure 1 Build
Type 2
A Short Form Agreement (SFA) is used by Homes Aff. Rent NB/A
Short Form
England to contract with providers who wish to deliver
Agreement 3
Affordable Rent units without Homes England funding.
The Single Land Programme, with effect from 1 April Social Rent NB/A
2015, consists of existing commitments taken from the / Int. Rent /
amalgamation of historical Homes England land AHO /
programmes (Accelerated Land Disposal, Economic Market
Assets and Property and Regeneration) and
Single Land
transferred sites from across Government under the
Programme
Public Sector Land Transfer model. It is a self-
financing programme funded through the recycling of
receipts supporting Government’s targets on housing
(including starter homes), public sector land release
and asset disposals.
The Home Building Fund is government finance to Social Rent NB/A
The Home Building increase the number of new homes being built in / Int. Rent /
Fund – Short Term England. Applications are being accepted from private AHO /
Fund sector businesses to build new homes or prepare sites Market
for development.
The Traveller Pitch Funding programme was Aff. Rent / NB/A
announced as part of the Government’s Spending AHO
Traveller Pitch
Review 2010 and delivered 515 new traveller pitches by
Funding 3
31 March 2015 (outside London). In addition, 386
refurbished pitches were delivered.
1 Tenure indicates whether units delivered under each programme are allocated to Affordable Rent (Aff. Rent), Social Rent (Social
Rent), Intermediate Rent (Int. Rent), Affordable Home Ownership (AHO), including Shared Ownership and Rent to Buy, or Open
Market (Market).
2 New supply is either a new build (NB) or an acquisition (A) from existing non-affordable stock. Grant under some programmes
can be used to deliver either newly built units or to fund acquisitions.
3 The programme is part of the Affordable Homes Programme (AHP) 2011-15. The majority of delivery through the AHP 2011-15
and other associated programmes will be made available as Affordable Rent with some Affordable Home Ownership and, in
some limited circumstances, Social Rent. Intermediate Rent may not be delivered by the AHP 2011-15 unless it is through
Mortgage Rescue or pre-existing commitments from the National Affordable Housing Programme.
Page 23
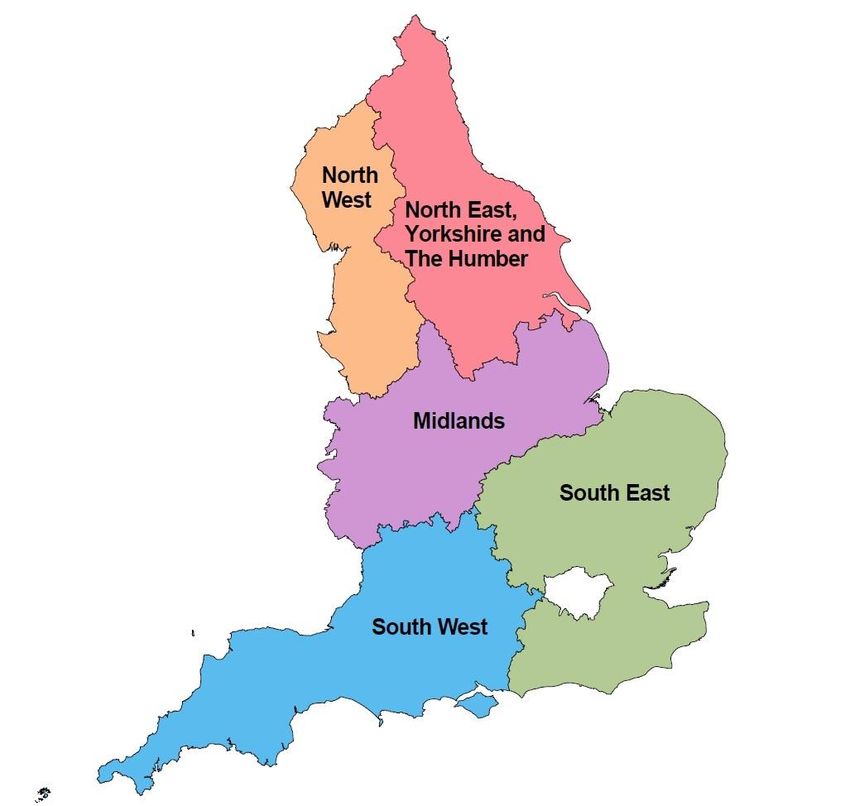
OFFICIALAnnexe 2
Homes England operating areas
Note: With effect from 1 April 2017 there were two Homes England Operating Area name changes, with East and South
East becoming South East and South and South West becoming South West. Additionally, there was a boundary change
with the following Local Authorities moving from Midlands to South East: Bedford, Central Bedfordshire, Corby,
Daventry, East Northamptonshire, Kettering, Luton, Milton Keynes, Northampton, South Northamptonshire and
Wellingborough.
Page 24
OFFICIALenquiries@homesengland.gov.uk
0300 1234 500
gov.uk/homes-england
DOCUMENT CLASSIFICATION: OFFICIALYou can also read