Mapping Arts and Health Activity in Ireland in 2019
←
→
Page content transcription
If your browser does not render page correctly, please read the page content below
Mapping Arts and Health
Activity in Ireland in 2019

             1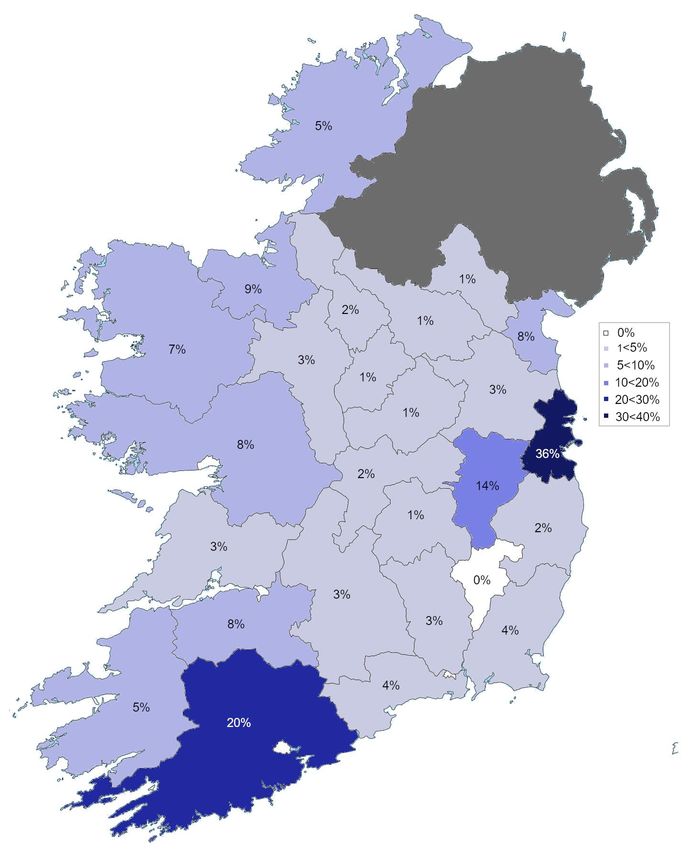
Contents
Executive Summary ........................... 3                    3.1.2 Respondent organisations .. 9
  1. Introduction ................................. 3           3.2 Programmes ............................. 9
  2. Methodology ............................... 3                 3.2.1 Programme types ............... 9
  3. Findings ...................................... 3             3.2.2 Artforms ............................ 10
     3.1 Respondents.......................... 3                   3.2.3 Healthcare contexts .......... 11
     3.2 Programme types, artforms                                 3.2.4 Locations .......................... 12
     and contexts ................................ 3               3.2.5 Personnel involvement ..... 14
     3.3 Locations ............................... 3               3.2.6 Partners ............................ 15
     3.4 Personnel and partners ......... 3                        3.2.7 Funders ............................ 16
     3.5 Funders ................................. 4               3.2.8 Lifespan ............................ 18
     3.6 Lifespan ................................. 4              3.2.9 Beneficiaries ..................... 20
     3.7 Beneficiaries, budgets and                             3.3 Budgets .................................. 21
     research ....................................... 4
                                                                3.4 Research and policy ............... 21
     3.8 Comparison to previous
     mapping report from 2001 ........... 4                     3.5 Comparison to previous mapping
                                                                report ............................................ 21
1 Introduction ..................................... 5
                                                                   3.5.1 Number of programmes ... 21
  1.1 Background and context ........... 5
                                                                   3.5.2 Funders ............................ 22
  1.2 Aims and objectives .................. 5
                                                                   3.5.3 Artforms ............................ 22
  1.3 Definitions and scope ................ 6
                                                                   3.5.4 Contexts ........................... 22
     1.3.1 Definitions ........................... 6
                                                                   3.5.5 Locations .......................... 22
     1.3.2 Boundaries of the report ..... 6
                                                                   3.5.6 Personnel ......................... 22
2 Methodology .................................... 7
                                                                   3.5.7 Lifespan ............................ 22
  2.1 Online survey ............................ 7
                                                                   3.5.8 Beneficiaries ..................... 22
     2.1.1 Piloting ................................ 7
                                                                   3.5.9 Budgets ............................ 23
  2.2 Identification of respondents ..... 7
                                                              4 Reflections .................................... 24
  2.3 Timeline .................................... 7
                                                              5 Bibliography ................................ 266
  2.4 Removal of duplicates ............... 7
                                                              6 Appendices ................................. 277
3 Findings........................................... 8
                                                                6.1 Appendix One: Arts and Health
  3.1 Respondents ............................. 8               Mapping Group ........................... 277
     3.1.1 Respondent roles ................ 8                  6.2 Appendix Two: Survey
                                                                Questions ................................... 277

                                                          2
Executive Summary
1. Introduction
The goal of this mapping exercise, commissioned by Arts and Health Co-ordinators
Ireland (AHCI), was to measure the level and nature of active service provision in the
field of Arts and Health in the Republic of Ireland in 2019.

2. Methodology
An online survey was chosen as the methodology for the exercise. The survey was
created in SurveyMonkey and piloted with five professionals working in Arts and
Health. Following amendments, the survey was launched in October 2020 and
remained open for six weeks. Potential respondents were identified through an
existing database held by AHCI and an open call via social media and e-zines.

3. Findings
3.1 Respondents
Completed surveys were received from seventy unique respondents, representing 92
Arts and Health programmes across the Republic of Ireland. These programmes
involved 3,854 personnel in total. Arts-based roles (e.g. artists, arts officers and arts
facilitators) were the most commonly reported, accounting for half of all respondents.
Just over one fifth of respondents were linked to a hospital or other healthcare
organisation (21%). This may have been due to the COVID-19 pandemic priorities of
the healthcare sector at the time of the survey.

3.2 Programme types, artforms and contexts
The most common type of programme was collaborative and participatory arts (67%),
while the most popular artform was visual arts (60%). Six out of ten programmes
involved multiple types (61%) and artforms (59%). The maximum number of types and
artforms in any one programme was eight and 10, respectively. The highest
percentage of programmes were conducted in day hospitals, day care centres or
community health settings (33%). Two thirds of programmes took place in more than
one healthcare context (62%; maximum 8 contexts).

3.3 Locations
Dublin had the highest number of programmes, representing 36% of the total. Cork
and Kildare were the next most popular counties, with 20% and 14% of programmes,
respectively. Every county except Carlow was involved in at least one programme.
Three quarters of programmes involved counties in Leinster (76%). Counties in
Munster were the next highest percentage (43%), followed by Connacht (28%) and
then Ulster (8%). Most programmes (80%) took place in one location only. The
maximum number of locations for any one programme was 14.

3.4 Personnel and partners
In total, 3,854 personnel were engaged in the delivery of 92 programmes.
Approximately equal numbers of artists and healthcare staff were involved (996 and

                                           3
989, respectively). Almost all programmes engaged at least one artist (96%) and the
majority of artists were paid (88%). Over half of programmes involved healthcare staff
(51%) and Arts managers (58%). The most common programme partners were
healthcare providers (54%), followed by local authority arts offices (42%) and arts
organisations (39%). Two-thirds of programmes had multiple partners (62%;
maximum 6 partners), one quarter had one partner (24%) and 14% had no partners.

3.5 Funders
The most frequent funders were local authorities (48%), the Health Service Executive
(HSE; 37%) and The Arts Council (32%). Two-thirds of programmes had multiple
funders (70%) and the maximum number of funders for any one programme was ten.
Ten percent of programmes received no funding. Local authorities were also the most
frequent funder across healthcare contexts (i.e. 9 out of 12 contexts surveyed).
However, it should be noted that the percentage of programmes funded does not
reflect the amount of funding given.

3.6 Lifespan
Four out of every ten programmes lasted between 27 and 52 weeks. The average
duration of programmes was 31 weeks. Over two thirds of programmes were still
active at the time of survey (69%). Two-thirds of longer programmes (i.e. >27 weeks)
had multiple funders (62%). Longer programmes also tended to have more funders
and bigger budgets. That is, all programmes with a budget of €50,000+ had multiple
funders, and most of these lasted 27+ weeks (i.e. 9 out of 10 programmes).

3.7 Beneficiaries, budgets and research
Two-thirds of programmes (70%) reported multiple beneficiaries. The most common
beneficiary was health service users (85%), followed by family, friends and carers
(60%) and then healthcare staff (54%). Just over one in ten programmes (13%) had
no dedicated budget. The most common budget category was €1,001-€10,000 (27%
of programmes). Six percent of programmes had budgets of €100,001-€300,000, while
2% had budgets of €300,000 or more. Seventy percent of programmes also received
in-kind contributions. Two-thirds of programmes were evaluated (63%). Most
programmes had not published any research or policy documents in 2019 (74%).

3.8 Comparison to previous mapping report from 2001
Findings indicate that there has been a six-fold increase in the provision of Arts and
Health initiatives from the previous mapping period (1987-2001) to 2019. Visual arts
continues to be the most frequent artform (60% of programmes), while local authorities
have replaced the HSE as the most frequent programme funder. Compared to the
previous period, a higher percentage of programmes in 2019 had multiple contexts
(11% vs. 65%), locations (4% vs. 20%) and beneficiaries (21% vs. 70%). Involvement
of arts personnel has remained stable (>97%), while involvement of healthcare staff
appeared to have decreased (83% to 51%). The average duration of programmes
increased from 6-10 weeks to 31 weeks. Available funding has also increased. Just
3% of budgets surveyed between 1987 and 2001 were above €55,000, compared to
15% of budgets above €50,000 in 2019.

                                          4
Introduction
1
1.1 Background and context
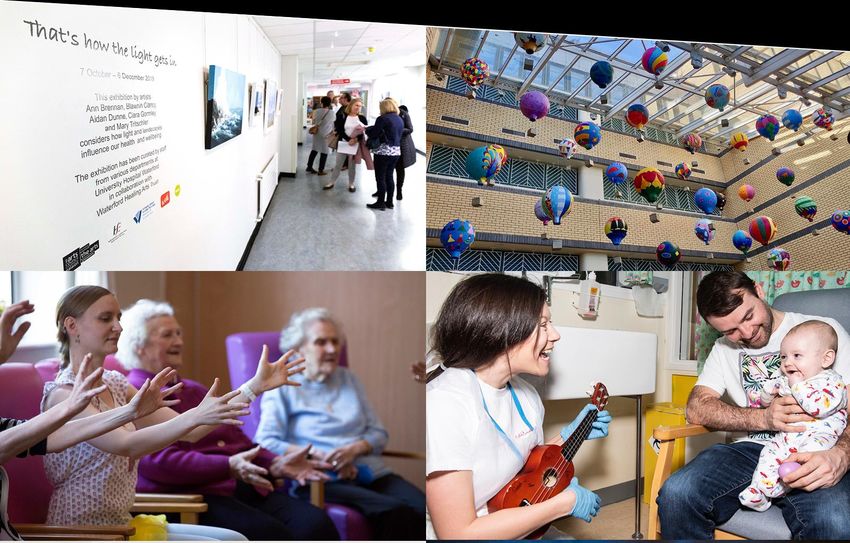
Arts and Health has evolved considerably over the past 30 years in Ireland. Today,
arts experiences are integrated into a variety of healthcare contexts, from hospitals
and day care centres, to community settings and health promotion1. The benefits of
such experiences to healthcare users, staff and the public are widely recognised.
These can include stress reduction, improved health and well-being outcomes,
development of creativity and enhanced sense of community1.
Arts and Health Co-ordinators Ireland2 (AHCI) is a voluntary network of professionals
who manage Arts and Health initiatives in the Republic of Ireland. Formed in 2003,
AHCI aims to build capacity within Arts in Health in Ireland and support its members
in their work.
AHCI engaged researcher Dr. Francesca Farina in March 2020 to undertake a
mapping exercise of current Arts and Health activities in the Republic of Ireland. The
rationale for this exercise was to support AHCI in:
1. Influencing the policy and funding environment for Arts and Health practice.
2. Advocating at local and national levels for the development of practice.
1.2 Aims and objectives
The aim of this mapping exercise was to measure the level and nature of active service
provision in the field of Arts and Health in the Republic of Ireland in 2019.
Specific objectives were to:
1. Determine the number of Arts and Health programmes that occurred and
categorise them with respect to:
a. Programme type f. Partners
b. Artforms used g. Funders
c. Healthcare contexts h. Lifespan
d. Geographical location i. Beneficiaries
e. Personnel j. Budget.
2. Measure the growth (or otherwise) of the sector since the previous mapping
exercise completed by Ruairí Ó Cuív and Leargas Consulting in 20015.
3. Identify the number of programmes that published research and policy
documents on their work.
51.3 Definitions and scope
1.3.1 Definitions
For the purposes of this mapping exercise, Arts and Health was defined as:
‘The generic term that embraces a range of arts practices occurring primarily in
healthcare settings, which brings together the skills and priorities of both arts
and health professionals.’
The Arts Council Arts and Health Policy and Strategy, 20103
Arts and Health is distinct from Arts therapies and Arts and Disability, which are
defined below.
Arts Therapies: the use of arts to improve mental health and well-being4. Contrary to
Arts and Health, the primary goal of Arts Therapies is clinical3.
Arts and Disability: the use of arts for the specific purpose of engaging and involving
people with disabilities. Similar to Arts and Health, Arts and Disability incorporates
both artistic and health aims3,5.
Other Arts practices: Arts and Health can also overlap with a number of other related
practices. For example, individual artists may be involved in arts activities that take
place within healthcare contexts or community settings, which may benefit peoples’
well-being6. Arts and Health activities may also intersect with arts and medical
humanities or arts and science approaches1. Whether these activities are defined as
Arts and Health depends on the degree to which they incorporate the goals of both
arts and healthcare6.
1.3.2 Boundaries of the report
The scope of the mapping exercise was such that it was not possible to survey every
healthcare service and arts organisation in Ireland. Therefore, it is possible that there
are additional Arts in Health programmes that were not recorded by the mapping
exercise, and so are not reflected in the report. It is also possible that some activities
were undocumented due to the ongoing COVID-19 pandemic, which may have limited
individuals’ ability to engage in the exercise.
6Methodology
2
The researcher worked with the AHCI Mapping Group (see Appendix 1 for
membership) to define the scope of the exercise and methodology. It was decided that
all initiatives would be counted, regardless of scale. Thus, both individual projects and
larger programmes of work are included. For ease of reporting, all initiatives are
referred to as programmes below and in the subsequent sections. Members of the
AHCI Mapping Group sign-posted the researcher to existing research. It was decided
that an online survey would be the most efficient means of data collection.
2.1 Online survey
An online survey was created in SurveyMonkey, based on discussions with the
Mapping Group and previous mapping work5. The survey was refined through further
consultation with the Mapping Group. During these conversations, it was decided that
the mapping exercise would focus on programmes carried out in 2019 only.
2.1.1 Piloting
Five individuals working in Arts and Health were identified to test the survey. Testers
were asked to provide feedback on the clarity and relevance of questions, ease of
completing the survey and any additional questions they felt should be included.
Based on testers’ feedback, and following further consultation with the Mapping
Group, the survey was amended (see Appendix 2 for the finalised survey).
2.2 Identification of respondents
Respondents were identified through an existing database of individuals working in
the Arts and Health sector held by AHCI. This included:
• AHCI members • Social prescribing programmes
• Arts organisations • Community health organisations
• Local Authority Arts Officers • Acute hospitals
• Cultural institutions • E-zines.
The survey link was also shared online through social media channels (e.g. Twitter).
The AHCI Mapping Group contacted key respondents directly to encourage them to
complete the survey.
2.3 Timeline
Initially, data collection was due to take place during the summer of 2020. However,
due to the COVID-19 pandemic, release of the call out for information was postponed
until the autumn. The survey was opened in October 2020 and closed six weeks later.
2.4 Removal of duplicates
Duplicate respondents and programmes were removed from the data before analysis.
7Findings
3
3.1 Respondents
Completed surveys were received from seventy unique respondents, representing 92
Arts and Health programmes across the Republic of Ireland. These programmes
involved 3,854 personnel in total (discussed further in Section 3.2).
3.1.1 Respondent roles
Table 1 shows the different roles held by the respondents. Arts-based roles were the
most commonly reported, accounting for half of all respondents. These included
individual artists, arts officers, art facilitators, art teachers, curators, musicians and art
therapists. By comparison, only 7% of respondents held the role of Arts and Health
co-ordinator. Just over one fifth of respondents were Founders or Directors of an
organisation (21%), while one in ten respondents (10%) were programme managers.
The remaining 9% was evenly split between healthcare roles (e.g. nurses, medical
scientists), community workers, education officers, marketing and development
managers, researchers and students.
Table 1: Number and percentage of respondent roles
Role Number Percentage
Founder / Director 17 21%
Artist 12 15%
Arts facilitator 11 13%
Arts officer 10 12%
Programme manager 8 10%
Arts and Health co-ordinator 6 7%
Curator 4 5%
Art therapist 2 2%
Education officer 2 2%
Musician 2 2%
Nurse 2 2%
Art teacher 1 1%
Community worker 1 1%
Marketing and Development manager 1 1%
Medical scientist 1 1%
Researcher 1 1%
Student 1 1%
Total 82 100%
Note: The total number of roles, 82, is greater than the total number of respondents,
70, as some respondents indicated more than one role. Percentages are rounded to
the nearest number and so may not total to 100%.
83.1.2 Respondent organisations
Table 2 shows the range of organisations respondents were affiliated with. Just over
one fifth of respondents were linked to a hospital or other healthcare organisation
(21%). Fourteen percent of respondents were affiliated to arts-based settings,
including arts centres and services, music groups and theatre groups. Local
Authorities were named on 13% of programmes, while non-governmental
organisations were named on 11%. Fewer than one in ten programmes were
associated with Arts and Health centres (6%), cultural and education centres (8%),
community health groups (4%) or festivals (1%). The remaining one fifth of
respondents reported having no affiliation. These respondents included independent
artists and freelance community workers.
Table 2: Number and percentage of respondent organisations
Organisation Number Percentage
Hospital / healthcare organisations 15 21%
None 14 20%
County council 9 13%
Non-governmental organisations 8 11%
Cultural institution 5 7%
Arts & Health centre 4 6%
Arts service 4 6%
Arts centre 3 4%
Community health group 3 4%
Theatre group 2 3%
Education centre 1 1%
Festival 1 1%
Music group 1 1%
Total 70 100%
Note: Percentages are rounded to the nearest number and so may not total 100%.
3.2 Programmes
Fifty-eight respondents (83%) were involved in one Arts and Health programme in
2019. The remaining 12 respondents (17%) were involved in more than one
programme. The numbers of respondents reporting more than one programme were
as follows: two programmes (six people, 9%), three programmes (four people, 6%),
four programmes (one person, 1%) and six programmes (one person, 1%). No
respondents listed five programmes. Due to multiple programmes being reported per
respondent, the total number of unique programmes was 92.
3.2.1 Programme types
Figure 1 illustrates the percentage of programme types identified. The largest category
was collaborative and participatory arts, which accounted for two thirds of programmes
(67%). Approximately one third of programmes involved either performance (38%) or
residency (32%), while one quarter of programmes involved an exhibition (27%) or an
9educational element (24%). Only 16% of programmes incorporated Arts and Health
research. One in ten programmes involved either a festival (11%) or public art
commission (10%). The remaining 12% of programmes involved types not listed in the
survey. These included community events, conferences and workshops, strategic
planning, alternative research, storytelling, book gifting and art therapy.
Sixty-one percent of programmes involved multiple types; the remaining 39% had one
type only. The maximum number of types in any one programme was eight.
Percentage of programme types
Collaborative and participatory arts 67%
Performance 38%
Residency 32%
Exhibition 27%
Training, education and CPD 24%
Arts and Health research 16%
Other 12%
Festival 11%
Public art commission 10%
Figure 1: Programme types in each category expressed as a percentage of the
total number.
Note: CPD = Continuing Professional Development.
3.2.2 Artforms
Figure 2 illustrates the percentage of artforms identified across programmes. The two
most common artforms were visual arts (60%) and music (52%). Approximately one
fifth of programmes involved literature and creative writing (23%) or film (20%). Slightly
fewer programmes involved dance (18%), theatre (17%), craft (16%) or traditional arts
(14%), while one in ten programmes incorporated design (11%). The least common
artforms were architecture and circus, street art and spectacle, representing 5% of
programmes each. The remaining 9% of programmes involved artforms not listed in
the survey. These included educational and environmental arts, animation and digital
art, photography and storytelling.
Fifty-nine percent of programmes included multiple artforms; the remaining 41%
included one artform only. The maximum number of artforms incorporated in any one
programme was ten.
10Percentage of programme artforms
Visual Arts 60%
Music (including Opera) 52%
Literature / Creative writing 23%
Film 20%
Dance 18%
Theatre / Drama 17%
Craft 16%
Traditional Arts 14%
Design 11%
Other 9%
Circus, street art and spectacle 5%
Architecture 5%
Figure 2: Programme artforms expressed as a percentage of the total number.
3.2.3 Contexts
Figure 3 illustrates the spread of programme healthcare contexts. One third of all
programmes (33%) were carried out in day hospitals, day care centres or services, or
community health settings. Approximately one quarter of programmes were conducted
in acute hospitals (28%), residential care (26%), well-being and health promotion
(24%) or training and education settings (24%). One in five programmes were
conducted in community-based support organisations for people with chronic illness
and carers. Mental health and paediatric care settings also represented a sizeable
percentage of programmes, at 18% and 15%, respectively. Less than one in ten
programmes took place in rehabilitation and respite care, primary care, maternity or
palliative care settings.
Seventeen percent of programmes also involved contexts other than those listed in
the survey. These included nursing units, intensive care units, child sexual abuse units
and outpatient departments, as well as charities (i.e. disability and dementia) (6% in
total). Also included were arts-based settings such as galleries, community halls and
festivals (10%). One percent of programmes took place online via Zoom. Two-thirds
of programmes (63%) took place in multiple contexts. One-third took place in one
context only. The maximum number of contexts represented in any one programme
was eight.
We also investigated the percentage of Arts managers (paid or un-paid) across
programme contexts (see Table 3). Acute hospitals had the highest percentage of Arts
managers (32%).
11Table 3: Percentage of programmes with an Arts manager across contexts
Context Percentage
Acute Hospitals 32%
Well-being initiatives / Health promotion 28%
Day hospitals / Day care centres or services / Community Health
28%
settings
Training and education 26%
Community based support organisations for people with chronic
25%
illness and carers
Mental health settings 19%
Paediatric care 17%
Residential care 17%
Primary care 8%
Maternity hospitals 6%
Rehabilitation and respite care 6%
Hospices / palliative care 2%
Note: Percentages are based on the contexts reported for each programme, not the
role of the respondents.
3.2.4 Locations
Figure 4 shows the geographical spread of programmes. Dublin had the largest
number of programmes, representing 36% of the overall total. Cork and Kildare were
the next most popular counties, with 20% and 14% of programmes, respectively. Every
county except Carlow had at least one programme. Three quarters of programmes
involved counties in Leinster (76%). Counties in Munster were the next highest
percentage (43%), followed by Connacht (28%) and then Ulster (8%). The majority of
programmes (80%) took place in one location only. The remaining 20% took place in
two or more locations (range = 2-14 counties). Only one programme was carried out
nationally; this was the Waterford Healing Arts Trust (WHAT) National Arts & Health
Support Work.
12Percentage of programme contexts
Day hospitals / Community Health settings* 33%
Acute hospitals 28%
Residential care 26%
Well-being initiatives / Health promotion 24%
Training and education 24%
Community based support organisations** 20%
Mental Health settings 18%
Other 17%
Paediatric Care 15%
Rehabilitation and respite care 7%
Primary Care 5%
Maternity hospitals 4%
Hospices / palliative care 4%
Figure 3: Percentage of contexts represented across programmes.
Note: *Day hospitals / Community Health settings included day care centres and services. **Community based support organisations
were specific to people with chronic illness and carers. One respondent did not provide a context.
13Figure 4: Percentage of programmes according to geographical location.
Counties are colour coded according to the percentage of programmes.
3.2.5 Personnel involvement
Table 4 highlights the various categories of personnel involved in programmes. In total,
3,854 personnel were engaged in the delivery of 92 programmes. The number of
artists and healthcare staff was approximately equal (996 and 989, respectively).
14In general, the number of personnel in each category varied considerably, from zero
in some programmes to 700 in others. Almost all programmes involved at least one
artist (96%), most of whom were paid (88%). Over half of all programmes included
healthcare staff (51%) and Arts managers (58%). Volunteers were involved in one fifth
of programmes (22%). One quarter of programmes involved students or people on
community employment (CE) schemes (25%). Sixteen percent of programmes
involved other personnel not listed. These included programme managers, musicians,
architects, engineers and administrators.
Table 4: Personnel involved in programmes.
Number of Number of
Category personnel programmes Percentage Average Range
Paid artists 609 81 88% 7 0-100
Un-paid artists 387 16 17% 4 0-300
Healthcare staff 989 47 51% 11 0-300
Paid arts
managers 79 49 53% 1 0-8
Un-paid arts
managers 12 5 5% 0 0-8
Volunteers 905 20 22% 2 0-40
Students 705 16 17% 8 0-600
People on CE
schemes 12 7 8% 0 0-5
Other 156 15 16% 10 0-700
Note: The total number of personnel, 3,854, is greater than the total number of
programmes, 92, as most programmes had input from more than one source.
Percentages are expressed out of the total number of programmes. CE = Community
employment.
3.2.6 Partners
Figure 5 illustrates the percentage of partners across programmes. The most common
partners were healthcare providers, accounting for over half of all partnerships (54%).
Partnerships with arts organisations and local authority arts offices were slightly less
common at 39% and 42%, respectively. However, it should be noted that half of all
respondents held arts-based roles; thus, the percentage of arts-based partners may
have been lower simply because respondents were themselves working in these roles
(and so were not listing arts-based organisations as partners).
One in four programmes partnered with community organisations (27%). Partnerships
with educational institutions and patient advocacy groups were less common. The
remaining 18% was comprised of funders not listed in the survey. These included a
range of sources, including festivals, galleries, libraries, charities, the National Lottery,
education services and non-governmental organisations. Two-thirds of programmes
(62%) had multiple partners. One quarter (24%) had one partner and 14% had no
partners. The maximum number of partners in any one programme was six.
15Table 5 shows the most frequent partners across programme contexts. Healthcare
providers were the dominant partner (i.e. 12 out of 12 contexts).
Percentage of programme partners
Healthcare providers 54%
Local authority arts office 42%
Arts organisation(s) 39%
Community organisation(s) 27%
Other 18%
Educational institution 17%
No partners / co-organisers 15%
Patient advocacy group(s) 9%
Figure 5: Percentage of partners across programmes.
Table 5: Most frequent partners across programme contexts.
Context Most frequent partner(s) Percentage
Paediatric care Healthcare providers 79%
Local authority arts office / Healthcare
Maternity hospitals providers / Arts organisation(s) / 75% (all)
Educational institution
Hospices / palliative care Healthcare providers 75%
Community based support
Healthcare providers 72%
organisations
Day hospitals / Community
Healthcare providers 70%
Health settings
Mental health settings Healthcare providers 65%
Well-being initiatives / Local authority arts office / Healthcare
64% (both)
Health promotion providers
Primary care Healthcare providers 60%
Training and education Healthcare providers 59%
Local authority arts office / Healthcare
Acute Hospitals 54% (both)
providers
Local authority arts office / Healthcare
Residential care 54% (both)
providers
Healthcare providers / Community
Rehabilitation and respite
organisations / Patient advocacy 50% (all)
care
group(s)
3.2.7 Funders
Figure 6 shows the various funding sources available to programmes. In considering
these figures, it is important to note that they do not provide information about how
16much each funding body contributed. Rather, they reflect the percentage of overall
programmes that were funded.
Local authorities funded nearly half of all programmes (48%). The next most frequent
funders were the Health Service Executive (HSE) and the Arts Council, which funded
approximately one third of programmes each (37% and 32%, respectively). One in
four programmes were funded by sponsorship and philanthropy (24%). The
percentage of programmes funded by private fundraising was lower at 15%. Creative
Ireland funded one in five programmes, while Arts and healthcare organisations
funded 17% and 16% of programmes, respectively. Seven percent of programmes
were funded by the National Lottery. One quarter of programmes listed additional
funding sources (24%). These included cultural and educational institutions, local
development companies and festivals. One in ten programmes received no funding.
For programmes with funding, two-thirds (70%) had multiple funders, while one-third
(30%) had one funder. The maximum number of funders for any one programme was
ten.
Percentage of programme funders
Local authority 48%
Health Service Executive 37%
Arts council 32%
Sponsorship / philanthropy 24%
Other 24%
Creative Ireland 20%
Arts organisation(s) 17%
Healthcare institution(s) 16%
Private fund-raising 15%
No funders 10%
Voluntary group(s) 10%
National Lottery 7%
Figure 6: Percentage of programmes funded by various sources.
Note: Percentages are not representative of how much money each funder
contributed.
Table 6 shows the most frequent funders of programmes with one funder only. Of
these, the highest percentage of programmes were funded by the HSE (22%) followed
by local authorities (19%), while arts organisations funded approximately one in ten
programmes (11%).
The most frequent funders across programme contexts were also investigated (see
Table 7). Local authorities funded the most contexts (i.e. 9 out of 12), whereas The
Arts Council was not a dominant funder in any context. However, it is important to note
that these figures do not reflect the amount of funding given; therefore, we cannot
conclude that local authorities are the largest funder, but rather, that their funding is
the most spread across contexts.
17Table 6: Most frequent funders for programmes with one funder only.
Funder Percentage
HSE 22%
Local authority 19%
Other (please specify) 19%
Arts organisation(s) 11%
Healthcare organisation(s) 7%
Sponsorship / philanthropy 7%
The Arts Council 4%
Creative Ireland 4%
Voluntary group(s) 4%
The National Lottery 4%
Private fund-raising e.g. fundraising events 0%
Note: Percentages do not take into account the total amount of funding contributed by
each funder.
Table 7: Most frequent funders across programme contexts.
Context Most frequent funder(s) Percentage
Local authority / HSE /
Maternity hospitals 75% (all)
Sponsorship and philanthropy
Well-being initiatives / Health
Local authority 73%
promotion
Paediatric care Sponsorship and philanthropy 71%
Community based support
Local authority 66%
organisations
Day hospitals / Community Health
Local authority 63%
settings
Residential care Local authority 63%
Primary care Local authority / HSE 60% (both)
Mental health settings HSE 59%
Training and education Local authority 59%
Acute Hospitals Local authority 57%
Sponsorship and philanthropy /
Hospices / palliative care 50% (both)
Private fund-raising
Local authority / Voluntary
Rehabilitation and respite care 33% (all)
group(s) / Private fund-raising
Note: Percentages do not take into account the total amount of funding contributed by
each funder.
3.2.8 Lifespan
Figure 7 illustrates the duration of programmes as a percentage of the total number of
programmes. Two thirds of programmes took place over 6 weeks or more (64%). The
largest duration category was 27 to 51 weeks, which represented four out of every ten
programmes. One in four programmes lasted between 6 and 26 weeks (24%). Only
8% of programmes lasted less than five weeks. The average duration of programmes
was 31 weeks.
18Lifespan of programmes
One day 2%
1Programmes lasting >27 weeks
€300,000+
€200,001-€300,000
€100,001-€200,000
€50,000-€100,000
€25,001-€50,000
€10,001-€25,000
€1,001-€10,000
Less than €1,000
No budget
0 2 4 6 8 10 12
Number of programmes
No funders One funder Multiple funders
Figure 8: Programmes lasting >27 weeks according to budget category and
number of funders.
3.2.9 Beneficiaries
Figure 9 shows the programme beneficiaries. The majority of programmes listed
health service users as beneficiaries (85%). Family, friends and carers of healthcare
users were listed as beneficiaries in 60% of programmes, while healthcare staff were
listed in just over half (54%). One third of programmes also reported other
beneficiaries (34%). These included the public, students, teachers, parents and arts
organisations. Two-thirds of programmes (70%) had multiple beneficiaries, while one-
third (30%) had one beneficiary.
Percentage of beneficiaries
85%
Health service users
60%
Family / friends / carers
54%
Healthcare staff
34%
Other
Figure 9: Percentage of programme beneficiaries across categories.
203.3 Budgets
Table 9 shows a breakdown of the programme budgets across categories, inclusive
of core costs (i.e. salaries and overheads). Overall budgets varied considerably across
programmes. Just over one in ten programmes (13%) had no dedicated budget. The
highest proportion of programmes had budgets in the €1,001-€10,000 range (27%).
Six percent of programmes had budgets of between €100,001 and €300,000, while
2% of programmes had budgets of €300,000 or more. In-kind contributions were also
common, with 70% percent of respondents stating that the programme received some
form of contribution.
Table 9: Programme budget totals and percentages
Budget category Overall (%)
No budget 7 (13%)
Less than €1,000 5 (9%)
€1,001-€10,000 15 (27%)
€10,001-€25,000 11 (20%)
€25,001-€50,000 10 (18%)
€50,000-€100,000 4 (7%)
€100,001-€200,000 2 (4%)
€200,001-€300,000 1 (2%)
€300,000+ 1 (2%)
Note: Percentages are rounded to the nearest number and so may not total to 100%.
3.4 Research and policy
Sixty-three percent of programmes were evaluated, while 37% were not. The majority
of respondents had not published any research or policy documents related to their
programme in 2019 (74%). Twenty-three respondents (26%) indicated that they did
publish their work. The total number of documents produced was 27. Of these, 18
were published as case studies on the artsandhealth.ie website; four were published
in academic journals and five were published as online PDFs.
3.5 Comparison to previous mapping report
Ruairí Ó Cuív and Leargas Consulting completed the previous mapping exercise in
20015. This report mapped Arts and Health activities that had taken place in the
Republic of Ireland between 1987 and 2001.
3.5.1 Number of programmes reported
The previous mapping exercise identified 150 activities, which took place from 1987
to 20015 (14 years in total). The number of activities varied across years, ranging from
two activities in 1988 to 38 activities in 1998, approximately. The average number of
activities per annum was 17. By comparison, the current mapping exercise identified
92 programmes in 2019. These averages indicate that there has been a six-fold
increase in the provision of Arts and Health initiatives from 1987-2001 to 2019.
213.5.2 Funders
Local authorities replaced the HSE (formerly health boards) as the most frequent
programme funder. The percentage of programmes funded by the HSE decreased
from 50% between 1987 and 2001 to 37% in 2019. In contrast, the percentage of
programmes funded by local authorities increased from 29% to 48% across the same
period. The percentage of programmes funded by The Arts Council also increased
from 20% to 32%, while the percentage of programmes funded by arts organisations
remained stable (19% between 1987-2001 vs 17% in 2019).
3.5.3 Artforms
The most frequent artform reported in both exercises was visual arts, accounting for
six out of every ten programmes between 1987 and 2001 (59%) and in 2019 (60%).
The percentage of programmes with a musical element increased from 39% between
1987 and 2001 to 52% in 2019, while those with a drama element decreased from
42% to just 17%.
3.5.4 Contexts
Due to differences in how the data pertaining to contexts was collected, it was not
possible to compare across individual healthcare contexts. However, the overall
percentage of programmes that took place in more than one context increased
substantially from 11% in the period between 1987 and 2001 to 65% in 2019.
3.5.5 Locations
The percentage of programmes that took place across more than one geographical
area increased from just 4% between 1987 and 2001 to 20% in 2019. Nevertheless,
the majority of programmes (80%) still took place in one region only.
3.5.6 Personnel
The percentage of arts personnel involved in programmes remained stable across
mapping reports; 97% in 2019 compared to 100% between 1987 and 2001. However,
the percentage of healthcare staff involved appeared to decrease from 83% (1987-
2001) to just over half (51%; 2019).
3.5.7 Lifespan
The average duration of programmes increased from 6-10 weeks in the period
between 1987 and 2001 to 31 weeks in 2019. The percentage of programmes lasting
27 weeks or more also increased from 13% to 40%.
3.5.8 Beneficiaries
Programmes carried out in 2019 tended to have more beneficiaries than those in
previous years. Specifically, 70% of programmes in 2019 reported having multiple
beneficiaries, including health service users, staff, family, friends and carers. By
comparison, only 21% of activities surveyed between 1987 and 2001 reported multiple
beneficiaries.
223.5.9 Budgets
Budgets in the previous report were reported in pounds sterling. For ease of
comparison, these have been converted to euros here. Approximately one quarter of
activities (24%) surveyed between 1987 and 2001 had a budget of less than €1,100.
By comparison, only 9% of programmes had a budget of less than €1,000 in 2019.
Conversely, 9% of activities between 1987 and 2001 had a budget of €11,000-
€55,000, whereas 38% of programmes in 2019 had similar budgets of €10,000-
€50,000. Just 3% of budgets surveyed between 1987 and 2001 were above €55,000.
In contrast, 15% of budgets in 2019 were above €50,000; half of these (8%) were
above €100,000 and 2% were above €300,000. Taken together, these results indicate
that the funding available for Arts and Health programmes has increased considerably
from 1987-2001 to 2019.
23Reflections
4
The members of Arts and Health Co-ordinators Ireland (AHCI) have been delivering
arts experiences to health service users in the Republic of Ireland for almost two
decades. As such, we are aware of the diversity of Arts and Health practice in terms
of healthcare contexts, artforms, scale, longevity of programmes and governance
arrangements. We remain professionally connected to each other by the challenge of
navigating the healthcare system on behalf of artists and others for the benefit service
users and ensuring that the Arts and Health programmes we lead are delivered to the
best possible standards. This includes ensuring the necessary resources are in place
and the work is aligned with local and national healthcare policy and protocols.
As opposed to a systematic, policy driven approach at national level, Arts and Health
programmes in Ireland tend to come about because of the vision of individual
champions and / or the meeting of minds between healthcare and arts stakeholders.
Yet the outcomes of Arts and Health work comfortably chime with the ambition of
national strategies such as Healthy Ireland. Whilst some aspects of Arts and Health
practice, such as an arts experience in dementia care, during renal dialysis and cancer
treatments, have gained traction over the years, there are also gaps in provision in
terms of geography, healthcare contexts and artforms.
AHCI aspires to the provision of access to arts experiences for all health service users
regardless of health status, geography or means. By mapping the level and nature of
current Arts and Health provision, it aims to identify areas of sustained and growing
practice as well as gaps in provision.
The outcomes of this mapping exercise illustrate that those programmes, which have
continued over sustained periods, had larger budgets and multiple funders and
partners. This is not simply a question of resources. It demonstrates that those
programmes with input from multiple stakeholders are more likely to survive the
vagaries of the ever-changing funding landscape.
When the findings of this mapping exercise are compared to those from a similar Arts
and Health mapping exercise carried out by Ruairí Ó Cuív and Leargas Consulting in
2001, we find not only a six-fold increase in the provision of Arts and Health initiatives
from the previous period (1987-2001), but also a more complex scene. A higher
percentage of programmes in 2019 involved more contexts, locations and
beneficiaries than in 1987-2001. In short, we see an increased number of programmes
delivered over a longer timeframe, with a wider reach. However, this growth has taken
time and happens where partnerships and programmes are long established. These
examples of local or regional successes highlight the inequalities in provision
nationally.
24Budgets for Arts and Health programmes have increased since 2001. Local authorities
have replaced the HSE as the most frequent programme funder and we can see how
Arts managers working in healthcare settings, particularly acute settings, have levered
resources from non-healthcare sources for the benefit of service users.
The low level of academic research as part of Arts and Health practice can be seen
as a reflection of both available resources and the culture of the artists and arts
managers who often drive Arts and Health programmes. The case around the benefits
of Arts in Healthcare has been persuasively made through international research and
this is something that Irish practitioners regularly draw upon.
It is hoped that the outcomes of this mapping exercise, which was carried out by Dr.
Francesca Farina on behalf of AHCI, will provide a benchmark for future and ongoing
mapping of the practice and will lead to a more strategic and policy-driven approach
to embedding arts into service users’ experience of healthcare in Ireland.
Mary Grehan, Chair of AHCI Mapping Group and Children’s Health Ireland (CHI) Arts
in Health Curator
Justine Foster, Chair of AHCI, and Programme Manager at Uillinn West Cork Arts
Centre
Claire Meaney, Director, Waterford Healing Arts Trust (WHAT)
Bernadette Jackson, Chair of the Arts Committee, Naas General Hospital
Ali Baker-Kerrigan, Programme Manager, National Centre for Arts and Health at
Tallaght University Hospital.
25Bibliography
5
1. The Arts and Health Handbook: A Practical Guide. (2003). the Arts Council.
Source: http://www.artsandhealth.ie/wp-content/uploads/2011/09/The-
arts_health_handbook-a-practical-guide.pdf.
2. Arts and Health Co-ordinators Ireland website. (2020). Source:
https://artsandhealthcoordinatorsireland.wordpress.com/.
3. Arts and Health: Policy and Strategy. (2010). The Arts Council. Source:
http://www.artsandhealth.ie/wp-content/uploads/2011/08/Arts-Council-
Arts_and_health_policy_strategy-2010_2014.pdf.
4. Irish Association of Creative Arts Therapists website. (2020). Source:
https://www.iacat.ie/art-therapy.
5. Why arts and health should not be confused with arts and disability? (2016).
Pádraig Naughton. Source: http://www.artsandhealth.ie/perspectives/why-arts-
health-should-not-be-confused-with-arts-disability/.
6. Mapping the Arts in Healthcare Contexts in the Republic of Ireland. (2001).
Ruairi Ó Cuív and Leargas Consulting.
26Appendices
6
6.1 Appendix One: Arts and Health Mapping Group
Mary Grehan, Chair of AHCI Mapping Group and Children’s Health Ireland (CHI) Arts
in Health Curator
Ali Baker-Kerrigan, Programme Manager, National Centre for Arts and Health at
Tallaght University Hospital.
Justine Foster, Chair of AHCI, and Programme Manager at Uillinn West Cork Arts
Centre
Bernadette Jackson, Chair of the Arts Committee, Naas General Hospital
Claire Meaney, Director, Waterford Healing Arts Trust (WHAT)
6.2 Appendix Two: Survey Questions
Section 1: Participant details
1.1. Name:
1.2. Role:
1.3. E-mail address:
1.4. Organisation (if applicable):
1.5. Website (if applicable):
Section 2. Programme / Project Details
2.1. What is the name of the programme / project?
2.2. In which health care context(s) did the programme / project take place?
• Acute hospitals • Hospices / palliative care
• Maternity hospitals • Day hospitals / Community
• Mental Health settings Health settings
• Paediatric care • Residential care
• Community based support • Primary care
organisations for people with • Rehabilitation and respite care
chronic illness and carers • Training and education
• Well-being initiatives / Health • Other. Please specify
promotion
272.3. What artform(s) were used?
• Architecture • Theatre / Drama
• Circus, street art and spectacle • Visual Arts
• Dance • Traditional Arts
• Film • Craft
• Literature / Creative writing • Design
• Music (including opera) • Other. Please specify
2.4. What type of programme / project was it?
• Collaborative / participatory arts • Training / Education /
• Exhibition Continuous Professional
• Performance Development
• Public art commission • Festival
• Arts and Health research • Other. Please specify
• Residency
2.5. What was the lifespan of the programme / project from start to finish? Please give
the total number of days / weeks, e.g. one day per week for 12 weeks:
2.6. Is the programme / project still active?
• Yes • No • Don’t know
2.7. Was the programme / project evaluated?
• Yes • No
2.8. What was the budget for the programme / project, including core costs (salaries
and overheads)?
• No budget • €25,001-€50,000
• Less than €1,000 • €50,000-€100,000
• €1,001-€10,000 • €100,000+
• €10,001-€25,000
2.9. Were any in-kind contributions made?
• Yes • No
2.10. Where did the programme / project take place?
• Carlow • Donegal • Kildare
• Cavan • Dublin • Kilkenny
• Clare • Galway • Laois
• Cork • Kerry • Leitrim
28• Limerick • Offaly • Wexford
• Longford • Roscommon • Wicklow
• Louth • Sligo • National
• Mayo • Tipperary • Other
• Meath • Waterford
• Monaghan • Westmeath
2.11. How many personnel were involved in the delivery of the programme / project?
Please enter a number for each category that applies.
• Paid artists: • Volunteers:
• Un-paid artists: • Students:
• Healthcare staff: • People working on community
• Paid arts managers: employment schemes:
• Un-paid arts managers: • Other:
If ‘Other’, please specify:
2.12. Who were the programme / project beneficiaries?
• Health service users • Healthcare staff
• Family / friends / carers of health • Other. Please specify
service users
2.13. Who were the programme / project partners and / or co-organisers?
• No partners / co-organisers • Educational institution
• Local authority arts office • Community organisation(s)
• Healthcare providers • Patient advocacy group(s)
• Arts organisation(s) • Other. Please specify
2.14. Who funded the programme / project?
• No funders • The National Lottery
• The Arts Council • Voluntary group(s)
• Creative Ireland • Sponsorship / philanthropy
• Arts organisation(s) • Private fund-raising, e.g.
• Local authority fundraising events
• HSE • Other. Please specify
• Healthcare institution(s)
3. Research and Policy
3.1. Have you published research on your Arts and Health work? E.g. journal article,
case study, etc.
• Yes • No
293.2. Please add links to any relevant published research or policy documents.
4. Additional Comments
4.1. Please add any additional comments below.
4.2. In some cases, we may need to contact respondents to clarify details about their
programme / project(s). Please tick this box if you are happy to be contacted by us.
4.3. Please tick this box if you would like to receive a summary of the results.
30Arts + Health Co-ordinators Ireland (AHCI) is a voluntary network of professionals who
manage Arts and Health initiatives in Ireland. AHCI aims to build capacity and
maximise resources for its membership throughout Ireland.
This Research was commissioned by Arts and Health Coordinators Ireland and is a
joint initiative between Arts for Health, West Cork; Arts in Health at Cork University
Hospital; Children’s Hospital Ireland Arts in Health Programme; Creative Spark;
Helium; Kids Classics; Kildare County Council Arts Health and Well-being Programme;
Limerick Culture and Arts Office, Limerick City and County Council; National Centre
for Arts and Health at Tallaght University Hospital; Naas General Hospital Arts
Committee; Saolta Arts; West Cork Mental Health Services Arts and Health
Programme and Waterford Healing Arts Trust
C/O Uillinn West Cork Arts Centre, Skibbereen, County Cork, P81VW98
Email: justine@westcorkartscentre.com
Tel: 028-22090
Web: https://artsandhealthcoordinatorsireland.wordpress.com
31You can also read