Motilal Oswal S&P 500 Index Fund - Gateway to investing in one of the most popular indices in the world
←
→
Page content transcription
If your browser does not render page correctly, please read the page content below
Motilal Oswal S&P 500 Index Fund
(An open ended scheme replicating / tracking S&P 500 Index)

Gateway to investing in one of the most popular indices in the
world

31st July 2021

Unique Combination
                                       2020 GDP                         % of                                                          10 Year GDP Growth Rate
           Country                                                                                    Rank by GDP
                                       ($ trillion)                   World GDP                                                             (2010-2020)

             USA                           21.5                           26.7%                                1                                     3.7%

             India                          2.9                            3.7%                                5                                     6.2%

            World                          80.3                              --                                --                                      --

        USA + India                        24.4                           30.4%

                                               World’s Largest GDP + World’s Fastest Growing GDP

             •      Investing in USA and India offers an opportunity to invest in world’s largest GDP (i.e. USA) and
                    world’s fastest growth GDP (i.e. India).
             •      The combined exposure is 30.4% of global GDP

Source: Factset; Data as of 31-Dec-2020 The information / data herein alone is not sufficient and shouldn’t be used for implementation of an investment strategy. It should not
be construed as investment advice to any party. All opinions, figures, estimates and data included in this article are as on date. The article does not warrant the completeness or
accuracy of the information and disclaims all liabilities, losses and damages arising out of the use of this information. The statements contained herein may include statements of
Readers shall be fully responsible/liable for any decision taken on the basis of this article.

  2       For Financial Professionals. Proprietary Content. Permission to reprint or distribute any content from this presentation requires
          the written approval of Motilal Oswal Asset Management Company.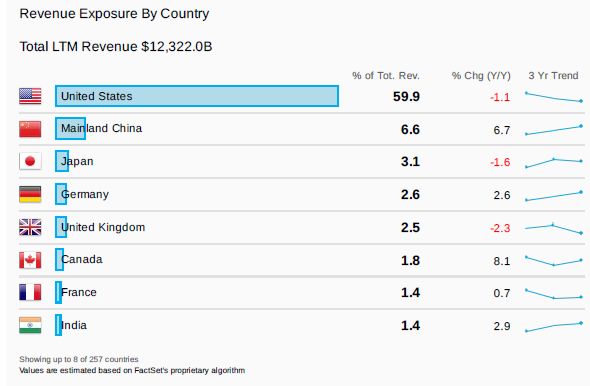
Fun Facts

                                                            Leading 500                                                                      One of the
                                                            companies in                                                                     factors used in
                                                            US                                                                               the forecast of
                                                                                                                                             economic
                                                                                                                                             direction

        Bluest of Blue Chips                                                                          Gauge of Economy

                                                            Top 4 passive                                                                    Investors like
                                                            funds by AUM                                                                     Warren Buffett,
                                                            world wide                                                                       Burton Malkiel
                                                            tracks S&P 500                                                                   & John Bogle
                                                            Index                                                                            recommend
                                                                                                                                             S&P 500 index
                                                                                                                                             fund

        Largest Index AUM                                                                            One of the Preferred Mode

Source; Marketwatch.com, ETFDB.com, conference-board.org

  3      For Financial Professionals. Proprietary Content. Permission to reprint or distribute any content from this presentation requires
         the written approval of Motilal Oswal Asset Management Company.
About: S&P 500 index One of the premier benchmarks for measuring U.S. stock market performance.
Introduction: S&P 500 Index

The S&P 500® index is widely regarded as the best single gauge of large-cap U.S. equities. The index is designed to
measure the performance of leading 500 companies listed in United States and covers approximately 80% of
available market capitalization.

Attributes –
•    Very long track record of over 63 years
•    World’s one of the most popular and tracked index; S&P 500 Index has largest asset tracked/benchmarked
     globally
•    Pure large caps exposure
•    Global Exposure - ~40% of the sales of S&P 500 constituents reported from foreign countries
•    Dollar hedge for Indian investors
•    Very low correlation with Indian equity market

Source: S&P Dow Jones Indices; FactSet- Global Sales data as on Jul 31, 2021

5      For Financial Professionals. Proprietary Content. Permission to reprint or distribute any content from this presentation requires
       the written approval of Motilal Oswal Asset Management Company.
S&P 500 Methodology Snapshot
Universe • All constituents must be US companies
Minimum Market • Total Market Capitalization USD 8.2 Billion
Capitalization: Free Float Market Capitalization USD 4.1 Billion
Profitability: • Positive reported earning in recent quarter
• Turnover Ratio > 1 and
Liquidity
• Number of stock traded > 250000 over last 6 months
Weighting: • Free Float Mcap Weighted
• Rebalancing – Quarterly;
Rebalancing:
Reconstitution – As-needed basis
Source: https://us.spindices.com/indices/equity/sp-500. Methodology as of 31-Jul-2021; for detailed index methodology please log on to source website.
6 For Financial Professionals. Proprietary Content. Permission to reprint or distribute any content from this presentation requires
the written approval of Motilal Oswal Asset Management Company.Global Brands in S&P 500
Source:https://us.spindices.com/indices/equity/sp-500; Data as of 31-Jul-2021; The Stocks mentioned above are used to explain the concept and is for illustration purpose only
and should not used for development or implementation of an investment strategy. It should not be construed as investment advice to any party. The stocks may or may not be
part of our portfolio/strategy/ schemes. Past performance may or may not be sustained in future. The sector mentioned herein are for general and comparison purpose only and
not a complete disclosure of every material fact.
7 For Financial Professionals. Proprietary Content. Permission to reprint or distribute any content from this presentation requires
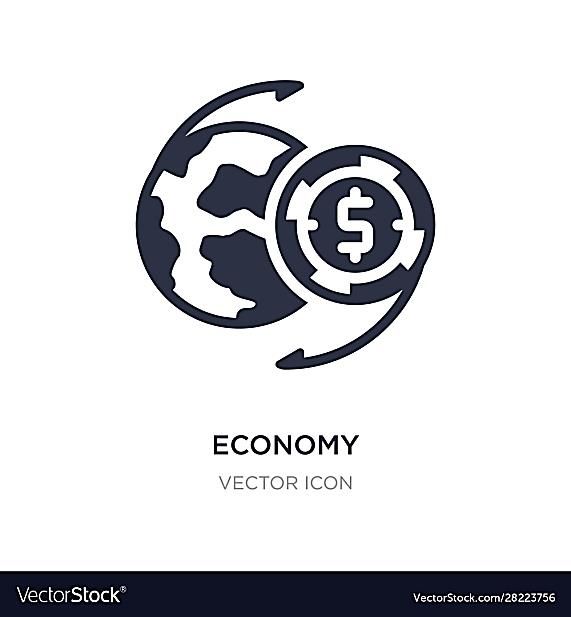
the written approval of Motilal Oswal Asset Management Company.Global Exposure in terms of Sales
Historically, a large portion of revenue of S&P 500 constituents’
was from foreign countries.
Source: FactSet; As of 30-Jun-2021; The information / data herein alone is not sufficient and shouldn’t be used for implementation of an investment strategy. It should not be
construed as investment advice to any party. All opinions, figures, estimates and data included in this article are as on date. The article does not warrant the completeness or
accuracy of the information and disclaims all liabilities, losses and damages arising out of the use of this information. The statements contained herein may include statements of
Readers shall be fully responsible/liable for any decision taken on the basis of this article.
8 For Financial Professionals. Proprietary Content. Permission to reprint or distribute any content from this presentation requires
the written approval of Motilal Oswal Asset Management Company.Motilal Oswal S&P 500 Index Fund Composition
Top 10 Constituents Weight (%) in Fund GICS Sector Coverage (%)
Information Technology 26.3
Constituent Name Weight GICS Sector
Health Care 12.7
Apple Inc 5.8% Information Technology Consumer Discretionary 11.3
Microsoft Corp 5.5% Information Technology Communication Services 10.6
Amazon Com Inc 3.6% Consumer Discretionary Financials 10.4
Facebook Inc 2.2% Communication Services Industrials 7.9
Alphabet Inc A 2.1% Communication Services Consumer Staples 5.6
Alphabet Inc 2.0% Communication Services Utilities 2.3
Tesla Inc 1.3% Consumer Discretionary Materials 2.4
Berkshire Hathaway Inc 1.3% Financials Real Estate 2.5
Nvidia Corp Com 1.2% Information Technology Energy 2.4
JP Morgan Chase & Co 1.2% Financials International ETFs 3.8
Total 26.2% --
Cash & Equivalent 1.7
Source/Disclaimer: MOAMC; Data as of 31-Jul-2021; Sectors - Global Industry Classification Standard (GICS) by MSCI & S&P Dow Jones Indices; the
stocks/sectors mentioned above are used to explain the concept and is for illustration purpose only and it should not be used for development or
implementation of an investment strategy. It should not be construed as investment advice to any party. The stocks may or may not be part of our
portfolio/strategy/schemes. Past performance may or may not be sustained in future.
9 For Financial Professionals. Proprietary Content. Permission to reprint or distribute any content from this presentation requires
the written approval of Motilal Oswal Asset Management Company.Why S&P 500 Index
Low Correlation, offers diversification

          •      Lower correlation offers opportunity for diversification.
          •      Combining assets that are less/not correlated helps reduce portfolio
                 volatility, thereby improving risk adjusted returns

                                                          Nifty 50 TR Index             Nifty 500 TR Index                 ^S&P 500 TR         ^NASDAQ 100 TR
                                                                (INR)                          (INR)                       Index (INR)           Index (INR)

      Nifty 50 TR Index (INR)                                     100%                           99%                            25%                    20%

      Nifty 500 TR Index (INR)                                                                   100%                           24%                    19%

      ^S&P 500 TR Index (INR)                                                                                                  100%                    48%

      ^NASDAQ 100 TR Index (INR)                                                                                                                      100%

Data Source: Bloomberg, RBI, Thomson Reuters, niftyindices.com. MOAMC. Correlation of daily total returns as of Close of Jun 30, 2006 to Jun 30, 2021. ^ denotes the index
currency conversion. NASDAQ 100 Index and S&P 500 Index values are adjusted for one day lag movement due to different time zone. Performance results have many inherent
limitations and no representation is being made that any investor will, or is likely to achieve. Past performance may or may not be sustained in future.

 11       For Financial Professionals. Proprietary Content. Permission to reprint or distribute any content from this presentation requires
          the written approval of Motilal Oswal Asset Management Company.
USD Appreciation increases performance in INR
^S&P 500 TR Index (INR) S&P 500 TR Index (USD)
800.00
700.00
S&P 500 TR Index (USD) grew by 4.7x
^S&P 500 TR Index (INR) grew by 7.5x
600.00
500.00
400.00
300.00
200.00
100.00
-
Jul-06 Jul-07 Jul-08 Jul-09 Jul-10 Jul-11 Jul-12 Jul-13 Jul-14 Jul-15 Jul-16 Jul-17 Jul-18 Jul-19 Jul-20
Up to Jul
2011 2012 2013 2014 2015 2016 2017 2018 2019 2020
2021
S&P 500 TR Index (USD) 2.1% 16.0% 32.4% 13.7% 1.4% 12.0% 21.8% -4.4% 31.5% 17.6% 19.4%
^S&P 500 TR Index (INR) 21.2% 19.5% 49.6% 16.4% 6.2% 14.8% 14.7% 4.3% 34.1% 20.5% 21.6%
Difference 19.1% 3.5% 17.2% 2.7% 4.8% 2.8% -7.2% 8.7% 2.6% 2.9% 2.2%
INR-USD 18.7% 3.0% 13.0% 2.4% 4.8% 2.5% -5.9% 9.1% 2.0% 2.6% 1.6%
Data Source: S&P Dow Jones and MOAMC, Index Values – www.niftyindices.com/Bloomberg, Forex Rate - RBI/Thomson Reuters. Performance as of Close of Jul 31, 2006 to Jul
30, 2021. ^ denotes the index currency conversion. S&P 500 Index values are adjusted for one day lag movement due to different time zone. Performance results have many
inherent limitations and no representation is being made that any investor will, or is likely to achieve. Past performance may or may not be sustained in future. The above graph is
used to explain the concept and is for illustration purpose only and should not used for development or implementation of an investment strategy.
12 For Financial Professionals. Proprietary Content. Permission to reprint or distribute any content from this presentation requires
the written approval of Motilal Oswal Asset Management Company.Performance : S&P 500 Index
13International Indices: Historical Performance (USD)
Nasdaq 100 TR Index USD S&P 500 TR Index USD ^ FTSE TR Index USD
^ Nikkei 225 TR USD ^Nifty 500 TR Index USD
900
800 • Globally S&P 500 Index has been one of the best performing index over since Sep
30, 2011
• In USD Terms, the Nifty 500 TR Index is amongst the worst performing indices
700 during same time
600
500
400
300
200
100
0
Sep-11 Sep-12 Sep-13 Sep-14 Sep-15 Sep-16 Sep-17 Sep-18 Sep-19 Sep-20
Data Source: Bloomberg; Performance in USD as of Close of Sep 30, 2011 – Jun 30, 2021. ^ denotes currency converted to USD. Month end index values. Performance results
have many inherent limitations and no representation is being made that any investor will, or is likely to achieve. Past performance may or may not be sustained in future. The
above graph is used to explain the concept and is for illustration purpose only and should not used for development or implementation of an investment strategy.
14 For Financial Professionals. Proprietary Content. Permission to reprint or distribute any content from this presentation requires
the written approval of Motilal Oswal Asset Management Company.International Indices: Risk Returns Profile (USD)
Nasdaq 100 TR S&P 500 TR Index ^ FTSE TR Index ^ Nikkei 225 TR ^ Nifty 500 TR
Period
Index USD USD USD USD Index USD
1 year 44.4% 40.8% 31.9% 31.6% 63.4%
Annualized Returns
3 year 28.6% 18.7% 2.6% 12.6% 11.9%
5 year 28.2% 17.6% 6.3% 16.8% 13.2%
7 year 22.2% 14.1% 1.4% 12.4% 9.7%
9 year 22.4% 15.9% 5.1% 16.3% 11.6%
1 year 24.3% 16.3% 21.0% 14.7% 16.3%
3 year 27.5% 24.3% 23.6% 19.8% 24.0%
Annualized
Volatility
5 year 22.4% 19.4% 19.2% 18.0% 19.9%
7 year 20.9% 18.0% 19.8% 20.1% 19.4%
9 year 19.3% 16.6% 18.4% 20.7% 19.9%
1 year 1.828 2.500 1.517 2.152 3.875
Risk Adjusted
3 year 1.041 0.768 0.110 0.636 0.497
Returns
5 year 1.260 0.910 0.327 0.933 0.664
7 year 1.063 0.782 0.070 0.617 0.500
9 year 1.159 0.959 0.275 0.787 0.581
Data Source: Bloomberg; Performance in USD as of Close of Jun 30, 2012 – Jun 30, 2021; ^ denotes currency converted to USD. Annualized Volatility calculated using monthly
returns. Performance results have many inherent limitations and no representation is being made that any investor will, or is likely to achieve. Past performance may or may not
be sustained in future. The above graph is used to explain the concept and is for illustration purpose only and should not used for development or implementation of an
investment strategy.
15 For Financial Professionals. Proprietary Content. Permission to reprint or distribute any content from this presentation requires
the written approval of Motilal Oswal Asset Management Company.Historical Performance
Historical Performance Chart
Nifty 500 TR Index ^S&P 500 TR Index (INR)
800
700
600
500
400
300
200
100
0
Jul-06 Jul-07 Jul-08 Jul-09 Jul-10 Jul-11 Jul-12 Jul-13 Jul-14 Jul-15 Jul-16 Jul-17 Jul-18 Jul-19 Jul-20 Jul-21
Data Source: Bloomberg, FBIL/RBI/Thomson Reuter and MOAMC; Performance as of Close of Jul 31, 2006 to Jul 31, 2021; ^ denotes the index currency conversion. Monthly
index values. S&P 500 Index values are adjusted for one day lag movement due to different time zone. Performance results have many inherent limitations and no representation
is being made that any investor will, or is likely to achieve. Past performance may or may not be sustained in future. The above graph is used to explain the concept and is for
illustration purpose only and should not used for development or implementation of an investment strategy.
16 For Financial Professionals. Proprietary Content. Permission to reprint or distribute any content from this presentation requires
the written approval of Motilal Oswal Asset Management Company.Recent Performance: Absolute Returns
Performance during COVID pandemic Recent Period Performance
^S&P 500 TR Index (INR) Nifty 500 TR Index ^S&P 500 TR Index (INR) Nifty 500 TR Index
140% 60%
120%
50%
100%
80%
40%
60%
40%
30%
20%
0% 20%
-20%
-40% 10%
-60%
Covid Crash Bottom to Last Month End 0%
(19-Feb-20 to 23-Mar-20) (23-Mar-20 to 31-Jul-21) 1 Month 3 Month 6 Month 1 Year
Data Source: Bloomberg, FBIL/RBI/Thomson Reuter and MOAMC; Performance as of Close of 19-Feb-2020 to 31-Jul-2021; ^ denotes the index currency conversion. S&P 500
Index values are adjusted for one day lag movement due to different time zone. Performance results have many inherent limitations and no representation is being made that any
investor will, or is likely to achieve. Past performance may or may not be sustained in future. The above graph is used to explain the concept and is for illustration purpose only
and should not used for development or implementation of an investment strategy.
17 For Financial Professionals. Proprietary Content. Permission to reprint or distribute any content from this presentation requires
the written approval of Motilal Oswal Asset Management Company.Risk Return Profile (INR)
Data Label 1 year 3 year 5 year 7 year 10 year 15 year
Nifty 50 TR Index (INR) 44.2% 12.9% 14.2% 12.1% 12.5% 12.7%
Nifty 500 TR Index (INR) CAGR 52.9% 13.6% 14.6% 13.2% 13.2% 13.1%
^S&P 500 TR Index (INR) 37.5% 21.6% 19.9% 18.4% 21.6% 14.4%
Nifty 50 TR Index (INR) 16.4% 21.9% 18.2% 17.5% 17.4% 22.2%
Annualised
Nifty 500 TR Index (INR) 15.8% 20.9% 17.7% 17.1% 16.9% 21.4%
Volatility
^S&P 500 TR Index (INR) 15.3% 23.6% 19.6% 18.5% 18.7% 21.1%
Nifty 50 TR Index (INR) 2.687 0.589 0.779 0.692 0.718 0.572
Risk
Nifty 500 TR Index (INR) Adjusted 3.357 0.649 0.824 0.774 0.781 0.613
Returns
^S&P 500 TR Index (INR) 2.454 0.914 1.018 0.990 1.157 0.683
Data Source: Index Values - www.niftyindices.com/Bloomberg, Forex Rate - RBI/Thomson Reuter and MOAMC; Performance as of Close of Jul 31, 2006 – Jul 31, 2021. ^
denotes the index currency conversion. S&P 500 Index values are adjusted for one day lag movement due to different time zone. Performance results have many inherent
limitations and no representation is being made that any investor will, or is likely to achieve. Past performance may or may not be sustained in future. The above table/graph is
used to explain the concept and is for illustration purpose only and should not used for development or implementation of an investment strategy.
18 For Financial Professionals. Proprietary Content. Permission to reprint or distribute any content from this presentation requires
the written approval of Motilal Oswal Asset Management Company.Index SIP Returns:
^S&P 500 TRI (INR) 1 Year 3 Year 5 Year 7 year 10 Year
Returns 41.7% 28.5% 23.5% 20.6% 20.2%
Amount Invested 1,20,000 3,60,000 6,00,000 8,40,000 12,00,000
Market Value 1,45,286 5,41,473 10,72,198 17,49,997 34,78,568
Nifty 500 TRI 1 Year 3 Year 5 Year 7 year 10 Year
Returns 48.2% 25.4% 17.7% 15.5% 15.3%
Amount Invested 1,20,000 3,60,000 6,00,000 8,40,000 12,00,000
Market Value 1,49,042 5,19,638 9,32,820 14,57,781 26,73,486
Data as of close of Jul 31, 2021. For SIP returns, monthly investment of INR 10,000/- invested on the first business
day of every month has been considered. Performance is calculated using Total Return Index, with zero
cost/expenses. Past performance may or may not be sustained in the future
Data Source: Bloomberg, FBIL/RBI/Thomson Reuter and MOAMC; Performance as of Close of Jul 31, 2011 – Jul 31, 2021; ^ denotes the index currency conversion. S&P 500
Index values are adjusted for one day lag movement due to different time zone. Performance results have many inherent limitations and no representation is being made that any
investor will, or is likely to achieve. The above table is used to explain the concept and is for illustration purpose only and should not used for development or implementation of
an investment strategy. The SIP amount, tenure of SIP, expected rate of return are assumed figures for the purpose of explaining the concept of advantages of SIP investments.
The actual result may vary from depicted results depending on scheme selected. It should not be construed to be indicative of scheme performance in any manner. The above
are not scheme SIP returns, but simulation of index SIP returns. Past performance may or may not be sustained in future.
19 For Financial Professionals. Proprietary Content. Permission to reprint or distribute any content from this presentation requires
the written approval of Motilal Oswal Asset Management Company.Indices: Drawdown Analysis
Nifty 500 TR Index ^S&P 500 TR Index (INR)
0%
-10%
-20%
-30%
-40%
-50%
-60%
-70%
Nifty 500 TRI ~S&P 500 TRI (INR)
Maximum Drawdown During Financial Crisis -64% -43%
Drawdown Date 27-Oct-08 09-Mar-09
Data Source: RBI, Bloomberg and niftyindices.com; ^Denotes Values converted in INR using RBI forex rates, Month-end Drawdown Chart. Performance Data from Jul 31, 2006 –
Jul 31, 2021. S&P 500 Index values are adjusted for one day lag movement due to different time zone. Hypothetical performance results have many inherent limitations and no
representation is being made that any investor will, or is likely to achieve, performance similar to that shown. The above graph is used to explain the concept and is for illustration
purpose only and should not used for development or implementation of an investment strategy. Past performance may or may not be sustained in future.
20 For Financial Professionals. Proprietary Content. Permission to reprint or distribute any content from this presentation requires
the written approval of Motilal Oswal Asset Management Company.3 Year Rolling CAGR
50%
40%
30%
20%
Excess Return
10% Nifty 500 TR Index
^S&P 500 TR Index (INR)
0%
Jun-09 Jun-10 Jun-11 Jun-12 Jun-13 Jun-14 Jun-15 Jun-16 Jun-17 Jun-18 Jun-19 Jun-20 Jun-21
-10%
-20%
-30%
3 Year Rolling Returns ~S&P 500 TRI (INR) Nifty 500 TRI
After initial underperformance
Average 15.7% 11.1%
S&P 500 TR Index in INR noted
Median 17.1% 11.8% consistent excess returns over
Nifty 500 TR Index over last 9
Min -6.5% -5.5%
years
Max 37.0% 30.9%
Data Source: Bloomberg, FBIL/RBI/Thomson Reuter and MOAMC; 250 trading days in a year assumed to calculate rolling returns. Chart using monthly 3 year rolling returns.
Performance as of Close of Jun 30, 2006 – Jun 30, 2021; ^ denotes the index currency conversion. S&P 500 Index values are adjusted for one day lag movement due to different
time zone. Performance results have many inherent limitations and no representation is being made that any investor will, or is likely to achieve. Past performance may or may
not be sustained in future. The above graph is used to explain the concept and is for illustration purpose only and should not used for development or implementation of an
investment strategy.
21 For Financial Professionals. Proprietary Content. Permission to reprint or distribute any content from this presentation requires
the written approval of Motilal Oswal Asset Management Company.Valuation Multiples
Price to Earning ratio Price to Book ratio
S&P 500 Index PE Ratio 10 yr avg. S&P 500 Index PB Ratio 10 yr avg.
4.7
45 31.4 5
35 4
3
25
2
15
1
5 0
Dividend yield
S&P 500 Index Div Yield 10 yr avg.
After current recovery post Covid 19 crash, PE and
3.0
2.5
PB ratio are above 10 year average, where as Div
2.0 Yield fallen below 10 year average
1.5
1.0
0.5 1.3
0.0
Data Source: Bloomberg (since inception upto Jun 30, 2020), Factset (since July 31,2020 onwards) ; Data from Jul 31, 2011 to Jul 31, 2021; The above graph is used to explain
the concept and is for illustration purpose only and should not used for development or implementation of an investment strategy. Past performance may or may not be
sustained in future.
22 For Financial Professionals. Proprietary Content. Permission to reprint or distribute any content from this presentation requires
the written approval of Motilal Oswal Asset Management Company.S&P 500 Index in your portfolio: Historical
performance
23Hypothetical Portfolio Allocations
Hypothetical Allocations to International Equity -
^S&P 500 TRI
# Portfolio Name Nifty 500 TRI
(INR)
1. Core Equity 100% 0
2. Core Equity+ (90:10) 90% 10%
3. Core Equity++ (80:20) 80% 20%
Correlation (15 Year) ^S&P 500 TRI (INR)
Nifty 500 TRI (INR) 24%
Data Source: Bloomberg, RBI, Thomson Reuters, MOAMC. Correlation of daily total returns as of Close of Jun 30, 2006 to Jun 30, 2021. ^ denotes the index currency conversion.
S&P 500 Index values are adjusted for one day lag movement due to different time zone. Performance results have many inherent limitations and no representation is being
made that any investor will, or is likely to achieve. Past performance may or may not be sustained in future. The above table is used to explain the concept and is for illustration
purpose only and should not used for development or implementation of an investment strategy.
24 For Financial Professionals. Proprietary Content. Permission to reprint or distribute any content from this presentation requires
the written approval of Motilal Oswal Asset Management Company.S&P 500 Allocation – Performance
Nifty 500 TR Index Nifty500 : SP500 (90 : 10) Nifty500 : SP500 (80 : 20)
800.0
Small allocation to S&P 500 TR Index in INR has helped improve
700.0
portfolio performance during last 15 years
600.0
500.0
400.0
300.0
200.0
100.0
0.0
Jun-06 Jun-07 Jun-08 Jun-09 Jun-10 Jun-11 Jun-12 Jun-13 Jun-14 Jun-15 Jun-16 Jun-17 Jun-18 Jun-19 Jun-20 Jun-21
Data Source: Bloomberg, FBIL/RBI/Thomson Reuter and MOAMC; Performance as of Close of Jun 30, 2006 – Jun 30, 2021; S&P 500 Index values are adjusted for one day lag
movement due to different time zone. Performance results have many inherent limitations and no representation is being made that any investor will, or is likely to achieve. Past
performance may or may not be sustained in future. The above graph is used to explain the concept and is for illustration purpose only and should not used for development or
implementation of an investment strategy.
25 For Financial Professionals. Proprietary Content. Permission to reprint or distribute any content from this presentation requires
the written approval of Motilal Oswal Asset Management Company.Asset Allocation - Risk-Return Profile (INR)
Data Label Core Only (Nifty 500 TRI) Core + (90:10) Core ++ (80:20)
3 year 15.0% 15.7% 16.4%
5 year 15.4% 15.9% 16.4%
Annualised
Returns
7 year 13.1% 13.6% 14.1%
10 year 12.8% 13.9% 14.9%
15 year 13.0% 13.6% 14.1%
20 year 17.5% 17.4% 17.1%
3 year 20.5% 19.3% 18.5%
5 year 17.4% 16.3% 15.6%
Annualised
Volatility
7 year 16.9% 15.9% 15.1%
10 year 16.8% 15.6% 14.8%
15 year 21.4% 19.8% 18.5%
20 year 21.7% 19.9% 18.5%
3 year 0.734 0.816 0.890
5 year 0.884 0.975 1.057
Risk Adjusted
Returns
7 year 0.774 0.857 0.934
10 year 0.765 0.887 1.003
15 year 0.610 0.691 0.765
20 year 0.809 0.871 0.923
Data Source: Bloomberg, FBIL/RBI/Thomson Reuter and MOAMC; Performance as of Close of Jun 30, 2001 – Jun 30, 2021; S&P 500 Index values are adjusted for one day lag
movement due to different time zone. Performance results have many inherent limitations and no representation is being made that any investor will, or is likely to achieve. Past
performance may or may not be sustained in future. The above graph is used to explain the concept and is for illustration purpose only and should not used for development or
implementation of an investment strategy.
26 For Financial Professionals. Proprietary Content. Permission to reprint or distribute any content from this presentation requires
the written approval of Motilal Oswal Asset Management Company.Comparison with NASDAQ 100 Index
CRITERIA S&P 500 INDEX NASDAQ 100 INDEX
Theme Broad Market Technology Heavy
Eligible Stock Exchange Various stock exchanges including NASDAQ Stocks listed only on NASDAQ
US Mcap Coverage ~80.9% ~35.6%
Number of Companies 500 100
# of Common Stocks 81 81
Weight of Common Stocks 41.7% 93.6%
Sectors All 11 GICS$ Sectors Covered Represents 7 GICS$ sectors out of 11 sectors
Largest Sector (weight) Information Technology (27.8%) Information Technology (48.7%)
www.spindices.com ; www.indexes.nasdaqomx.com/; ~ denotes approximate numbers. # Data as of 31-Jul-2021. $ https://www.msci.com/gics. The table above may have
inherent limitations and no representation is being made that any investor will, or is likely to achieve, results similar to that shown in future
27 For Financial Professionals. Proprietary Content. Permission to reprint or distribute any content from this presentation requires
the written approval of Motilal Oswal Asset Management Company.Motilal Oswal S&P 500 Index Fund
28About Motilal Oswal S&P 500 Index Fund
Investment Objective.
The Scheme seeks investment total return that corresponds (before fees and expenses) generally to the performance of the S&P
500 Index, subject to tracking error*. However, there can be no assurance or guarantee that the investment objective of the
Scheme would be achieved.
Key Facts: • Entry Load – Nil
Benchmark – S&P 500 TR Index • Exit Load – 1% exit load for 15 days from the
date of allotment
• Fund Manager – Mr. Herin Visaria and for Debt component - • Category – Index Funds
Mr. Abhiroop Mukherjee
• Date of Inception/Allotment – 28-Apr-2020
• Total Expense Ratio – Direct – 0.49%; Regular – 1.06%
(including GST)
• Asset Under Management – INR 1849.53 Crores (Jul 31,
2021)
• Taxation: Debt taxation with indexation benefits after 3
years
Continuous Offer:
Minimum Application Amount : INR 500/- and in multiples of INR 1/- thereafter.
Additional Application Amount : INR 500/- and in multiples of INR 1/- thereafter.
Source: MOAMC; As of 31-Jul-2021, * Tracking Error against S&P 500 Index (in INR using Thomson Reuter Forex Rate and one day lag in index value in line with NAV
calculations)
29 For Financial Professionals. Proprietary Content. Permission to reprint or distribute any content from this presentation requires
the written approval of Motilal Oswal Asset Management Company.Key Takeaway
Key factors to be considered for ideal asset allocation:
1. S&P 500 Index includes the top 500 companies in the United States covering all 11 GICS
sectors making it a broad based diversified index.
2. Motilal Oswal S&P 500 Index Fund offers investors an opportunity to invest in global
companies that are a part of S&P 500 Index. It aims to earn index returns subject to tracking
error. Investors without a demat account can also invest in Motilal Oswal S&P 500 Index
Fund.
3. Historically, S&P 500 Index had relatively lower correlation with Indian equity indices,
thereby offering diversification opportunity.
4. Historically S&P 500 Index in INR has noted higher returns as compared to S&P 500 Index
in USD, due to INR depreciation
5. Due to recovery post recent crash due to Covid-19 Pandemic, the current valuation multiple
are above historical averages.
30 For Financial Professionals. Proprietary Content. Permission to reprint or distribute any content from this presentation requires
the written approval of Motilal Oswal Asset Management Company.Product Suitability
This product is suitable for investors who
are seeking*
Return that corresponds to the
performance of S&P 500 Index subject
to tracking error
Investment in equity securities of S&P
500 Index
*Investors should consult their financial advisers if in doubt about whether the product is suitable for them.
For Financial Professionals. Proprietary Content. Permission to reprint or distribute any content from this presentation requires
the written approval of Motilal Oswal Asset Management Company.Motilal Oswal Passive Fund Offerings
Asset Allocation
Largecap
Asset Allocation Passive
FoF - Aggressive
Asset Allocation Passive
Nifty 50 Index Fund
Nifty Next 50 Index Fund
One of the largest AMCs
FoF - Conservative M50 ETF in India in the
International segment
International Midcap
NASDAQ 100 FoF
NASDAQ 100 ETF Nifty Midcap 150 Index Fund
S&P 500 Index Fund Nifty Midcap 100 ETF
Sectoral Smallcap
Nifty Smallcap 250
Offers funds across
Nifty Bank Index Fund
Index Fund all major segments
Multicap Debt
Nifty 500 Fund 5 Year G-Sec ETF
Source/Disclaimer: Mutual Fund Investments are subject to market risks, read all scheme related documents carefully.
For Financial Professionals. Proprietary Content. Permission to reprint or distribute any content from this presentation requires
the written approval of Motilal Oswal Asset Management Company.Thank You
“Don’t look for the needle in the haystack. Just buy the haystack!”
- John C. Bogle
Contact Us -
Speak: +91-22 40548002 | 8108622222
Write: mfservice@motilaloswal.com
Visit: www.motilaloswalmf.comAnnexures
34Profitability
All figures in %
CY CY CY CY CY CY CY CY CY CY CY
2010 2011 2012 2013 2014 2015 2016 2017 2018 2019 2020
Gross Margin 31.47 31.13 30.51 30.46 30.87 31.41 31.63 31.81 32.08 31.87 31.29
Operating Margin 13.45 13.94 13.83 13.60 14.54 14.04 13.58 14.04 14.54 14.08 12.11
Net Margin 8.88 9.36 9.46 9.59 10.16 9.56 9.35 9.82 10.72 10.54 8.82
Return on Equity 14.28 15.57 15.44 15.49 15.96 14.59 13.73 14.59 17.18 16.68 13.23
Data Source: Factset; Based on LTM which is derived from FactSet fundamentals monthly series .Data from Dec 2010 – Dec 2020; Performance results have many inherent
limitations and no representation is being made that any investor will, or is likely to achieve. Past performance may or may not be sustained in future.
35 For Financial Professionals. Proprietary Content. Permission to reprint or distribute any content from this presentation requires
the written approval of Motilal Oswal Asset Management Company.Valuation Multiples
CY CY CY CY CY CY CY CY CY CY CY
2010 2011 2012 2013 2014 2015 2016 2017 2018 2019 2020
Price/Earnings 15.32 12.94 13.99 17.36 17.50 18.82 21.04 22.69 17.57 21.62 31.46
Price/Book Value 2.19 2.01 2.16 2.69 2.79 2.75 2.89 3.30 3.02 3.61 4.16
EV/EBIT 12.38 10.86 11.78 14.81 14.95 16.49 18.35 19.72 16.68 20.69 28.79
EV/EBITDA 8.87 7.99 8.58 10.52 10.73 11.41 12.32 13.44 11.62 14.11 18.04
EV/Sales 1.64 1.49 1.59 1.93 2.05 2.14 2.34 2.62 2.29 2.77 3.41
Data Source: Factset; Based on LTM which is derived from FactSet fundamentals monthly series .Data from Dec 2010 – Dec 2020; Performance results have many inherent
limitations and no representation is being made that any investor will, or is likely to achieve. Past performance may or may not be sustained in future
36 For Financial Professionals. Proprietary Content. Permission to reprint or distribute any content from this presentation requires
the written approval of Motilal Oswal Asset Management Company.Estimates
CY CY CY
CY CY CY CY CY CY CY CY CY CY
2021 2022 2023
2011 2012 2013 2014 2015 2016 2017 2018 2019 2020
E E E
Price/Earnings
13.8 14.4 16.9 17.9 16.6 20.1 20.8 17.6 18.4 27.6 22.7 20.3 18.6
(x)
Price/Book
2.2 2.3 2.7 2.9 2.7 3.2 3.4 3.4 3.4 4.2 4.5 4.1 3.5
Value (x)
Dividend Yield
2.0 2.1 2.0 1.9 2.3 2.0 1.8 1.9 1.9 1.5 1.4 1.5 1.6
(%)
Enterprise
10.7 11.5 13.4 14.8 15.4 17.2 17.7 16.7 17.9 26.6 21.0 18.6 17.4
Value/EBIT (x)
Enterprise
Value/EBITDA 8.1 8.5 10.0 10.7 10.4 12.1 12.7 12.0 12.6 17.2 15.4 14.0 12.9
(x)
Enterprise
1.6 1.7 1.9 2.1 2.1 2.4 2.6 2.5 2.6 3.4 3.3 3.1 3.0
Value/Sales (x)
Data Source: Factset; Data as on 30-Jun-2021; Performance results have many inherent limitations and no representation is being made that any investor will, or is likely to
achieve. Past performance may or may not be sustained in future.
37 For Financial Professionals. Proprietary Content. Permission to reprint or distribute any content from this presentation requires
the written approval of Motilal Oswal Asset Management Company.Disclaimers & Risk Factors
This presentation has been prepared and issued on the basis of internal data, publicly available information and other sources believed to be reliable. The information contained
in this document is for general purposes only and not a complete disclosure of every material fact and terms and conditions. The information / data herein alone is not sufficient
and shouldn’t be used for the development or implementation of an investment strategy. It should not be construed as investment advice to any party.
All opinions, figures, charts/graphs, estimates and data included in this presentation are as on date and are subject to change without notice. The statements contained herein
may include statements of future expectations and other forward-looking statements that are based on our current views and assumptions and involve known and unknown risks
and uncertainties that could cause actual results, performance or events to differ materially from those expressed or implied in such statements. Readers shall be fully
responsible / liable for any decision taken on the basis of this presentation. Investments in Securities are subject to market and other risks and there is no assurance or guarantee
that the objectives of any of the Schemes will be achieved. The scheme may not be suited to all categories of investors.
The material is based upon information that we consider reliable, but we do not represent that it is accurate or complete, and it should not be relied upon as such. Opinions, if
any, expressed are our opinions as of the date of appearing on this material only. While we endeavor to update on a reasonable basis the information discussed in this material,
there may be regulatory, compliance, or other reasons that prevent us from doing so. Recipient shall understand that the aforementioned statements cannot disclose all the risks
and characteristics. The recipient is requested to take into consideration all the risk factors including their financial condition, suitability to risk return, etc. and take professional
advice before investing.
Passive Investments - The Scheme is not actively managed. Since the Scheme is linked to index, it may be affected by a general decline in the Indian markets relating to its
underlying index. The Scheme as per its investment objective invests in Securities which are constituents of its underlying index regardless of their investment merit. The AMC
does not attempt to individually select stocks or to take defensive positions in declining markets.
Index Fund - The Scheme being an index scheme follows a passive investment technique and shall only invest in Securities comprising one selected index as per investment
objective of the Scheme. The Fund Manager would invest in the Securities comprising the underlying index irrespective of the market conditions. If the Securities market declines,
the value of the investment held by the Scheme shall decrease.
Risks associated with overseas investment
To the extent the assets of the scheme are invested in overseas financial assets, there may be risks associated with currency movements, restrictions on repatriation and
transaction procedures in overseas market. Further, the repatriation of capital to India may also be hampered by changes in regulations or political circumstances as well as the
application to it of other restrictions on investment. In addition, country risks would include events such as introduction of extraordinary exchange controls, economic
deterioration, and bi-lateral conflict leading to immobilisation of the overseas financial assets and the prevalent tax laws of the respective jurisdiction for execution of trades or
otherwise.
Currency Risk:
The fund may invest in overseas mutual fund / foreign securities as permitted by the concerned regulatory authorities in India. Since the assets will be invested in securities
denominated in foreign currencies, the Indian Rupee equivalent of the net assets, distributions and income may be adversely affected by changes/fluctuations in the value of the
foreign currencies relative to the Indian Rupee.
Country Risk:
The Country risk arises from the inability of a country, to meet its financial obligations. It is the risk encompassing economic, social and political conditions in a foreign country,
which might adversely affect foreign investors’ financial interests.
Mutual Fund Investments are subject to market risks, read all scheme related documents carefully
38 For Financial Professionals. Proprietary Content. Permission to reprint or distribute any content from this presentation requires
the written approval of Motilal Oswal Asset Management Company.Disclaimers & Risk Factors
NSE Indices Limited Disclaimer: MOFM50 and MOFM100: MOFM50 and MOFM100 offered by Motilal Oswal Asset Management Company Limited (MOAMC) or its affiliates is not
sponsored, endorsed, sold or promoted by NSE Indices Limited and its affiliates. NSE Indices Limited and its affiliates do not make any representation or warranty, express or
implied (including warranties of merchantability or fitness for particular purpose or use) to the owners of MOFM50 and MOFM100 or any member of the public regarding the
advisability of investing in securities generally or in the MOFM50 and (MOFM100) linked to Nifty 50 Index and Nifty Midcap 100 Index respectively or particularly in the ability of
Nifty 50 Index and Nifty Midcap 100 Index to track general stock market performance in India. Please read the full Disclaimers in relation to the Nifty 50 Index and Nifty Midcap
100 Index in the Scheme Information Document.
The S&P 500 Index is a product of S&P Dow Jones Indices LLC or its affiliates (“SPDJI”) have been licensed for use by Motilal Oswal Asset Management Company Limited
(MOAMC) . Standard & Poor’s® and S&P® are registered trademarks of Standard & Poor’s Financial Services LLC (“S&P”); Dow Jones® is a registered trademark of Dow Jones
Trademark Holdings LLC (“Dow Jones”); Motilal Oswal S&P Index Fund (MOFSP500) is not sponsored, endorsed, sold or promoted by SPDJI, Dow Jones, S&P, their respective
affiliates and none of such parties make any representation regarding the advisability of investing in such product(s) nor do they have any liability for any errors, omissions, or
interruptions of the S&P 500 Index.
The S&P 500 Index is a product of S&P Dow Jones Indices LLC or its affiliates (“SPDJI”) have been licensed for use by MOAMC. Standard & Poor’s® and S&P® are registered
trademarks of Standard & Poor’s Financial Services LLC (“S&P”); Dow Jones® is a registered trademark of Dow Jones Trademark Holdings LLC (“Dow Jones”); It is not possible to
invest directly in an index. MOFSP500 is not sponsored, endorsed, sold or promoted by SPDJI, Dow Jones, S&P, any of their respective affiliates (collectively, “S&P Dow Jones
Indices”) S&P Dow Jones Indices does not make any representation or warranty, express or implied, to the owners of the MOFSP500 or any member of the public regarding the
advisability of investing in securities generally or in MOFSP500 particularly or the ability of the S&P 500 Index to track general market performance. Past performance of an
index is not an indication or guarantee of future results. S&P Dow Jones Indices’ only relationship to MOAMC with respect to the S&P 500 Index is the licensing of the Index and
certain trademarks, service marks and/or trade names of S&P Dow Jones Indices and/or its licensors. The S&P 500 Index is determined, composed and calculated by S&P Dow
Jones Indices without regard to MOAMC or the MOFSP500. S&P Dow Jones Indices have no obligation to take the needs of MOAMC or the owners of MOFSP500 into
consideration in determining, composing or calculating the S S&P 500 Index. S&P Dow Jones Indices is not responsible for and has not participated in the determination of the
prices, and amount of MOFSP500 or the timing of the issuance or sale of MOFSP500 or in the determination or calculation of the equation by which MOFSP500 is to be converted
into cash, surrendered or redeemed, as the case may be. S&P Dow Jones Indices have no obligation or liability in connection with the administration, marketing or trading of
MOFSP500. There is no assurance that investment products based on the S&P 500 Index will accurately track index performance or provide positive investment returns. S&P
Dow Jones Indices LLC is not an investment or tax advisor. A tax advisor should be consulted to evaluate the impact of any tax-exempt securities on portfolios and the tax
consequences of making any particular investment decision. Inclusion of a security within an index is not a recommendation by S&P Dow Jones Indices to buy, sell, or hold such
security, nor is it considered to be investment advice.
NEITHER S&P DOW JONES INDICES NOR THIRD PARTY LICENSOR GUARANTEES THE ADEQUACY, ACCURACY, TIMELINESS AND/OR THE COMPLETENESS OF THE S&P 500
Index OR ANY DATA RELATED THERETO OR ANY COMMUNICATION, INCLUDING BUT NOT LIMITED TO, ORAL OR WRITTEN COMMUNICATION (INCLUDING ELECTRONIC
COMMUNICATIONS) WITH RESPECT THERETO. S&P DOW JONES INDICES AND SHALL NOT BE SUBJECT TO ANY DAMAGES OR LIABILITY FOR ANY ERRORS, OMISSIONS, OR
DELAYS THEREIN. S&P DOW JONES INDICES AND MAKES NO EXPRESS OR IMPLIED WARRANTIES, AND EXPRESSLY DISCLAIMS ALL WARRANTIES, OF MERCHANTABILITY
OR FITNESS FOR A PARTICULAR PURPOSE OR USE OR AS TO RESULTS TO BE OBTAINED BY MOAMC, OWNERS OF MOFSP500, OR ANY OTHER PERSON OR ENTITY FROM THE
USE OF THE S&P 500 Index OR WITH RESPECT TO ANY DATA RELATED THERETO. WITHOUT LIMITING ANY OF THE FOREGOING, IN NO EVENT WHATSOEVER SHALL S&P
DOW JONES INDICES BE LIABLE FOR ANY INDIRECT, SPECIAL, INCIDENTAL, PUNITIVE, OR CONSEQUENTIAL DAMAGES INCLUDING BUT NOT LIMITED TO, LOSS OF
PROFITS, TRADING LOSSES, LOST TIME OR GOODWILL, EVEN IF THEY HAVE BEEN ADVISED OF THE POSSIBLITY OF SUCH DAMAGES, WHETHER IN CONTRACT, TORT, STRICT
LIABILITY, OR OTHERWISE. THERE ARE NO THIRD PARTY BENEFICIARIES OF ANY AGREEMENTS OR ARRANGEMENTS BETWEEN S&P DOW JONES INDICES AND MOAMC,
OTHER THAN THE LICENSORS OF S&P DOW JONES INDICES
39 For Financial Professionals. Proprietary Content. Permission to reprint or distribute any content from this presentation requires
the written approval of Motilal Oswal Asset Management Company.Disclaimers & Risk Factors
NASDAQ OMX Group, Inc.
The Product i.e. MOFN100 is not sponsored, endorsed, sold or promoted by The NASDAQ OMX Group, Inc. or its affiliates (NASDAQ OMX, with its affiliates, are referred to as the
“Corporations”). The Corporations have not passed on the legality or suitability of, or the accuracy or adequacy of descriptions and disclosures relating to, the Product. The
Corporations make no representation or warranty, express or implied to the owners of the Product or any member of the public regarding the advisability of investing in securities
generally or in the Product particularly, or the ability of the Nasdaq-100 Index® to track general stock market performance. The Corporations' only relationship to Motilal Oswal
Asset Management Company Ltd. (“Licensee”) is in the licensing of the NASDAQ®, OMX®, NASDAQ OMX®, NASDAQ-100®, and NASDAQ-100 Index® registered trademarks, and
certain trade names of the Corporations and the use of the NASDAQ-100 Index® which is determined, composed and calculated by NASDAQ OMX without regard to Licensee or
the Product. NASDAQ OMX has no obligation to take the needs of the Licensee or the owners of the Product(s) into consideration in determining, composing or calculating the
NASDAQ-100 Index®. The Corporations are not responsible for and have not participated in the determination of the timing of, prices at, or quantities of the Product to be issued
or in the determination or calculation of the equation by which the Product is to be converted into cash. The Corporations have no liability in connection with the administration,
marketing or trading of the Product.
THE CORPORATIONS DO NOT GUARANTEE THE ACCURACY AND/OR UNINTERRUPTED CALCULATION OF THE NASDAQ-100 INDEX® OR ANY DATA INCLUDED THEREIN. THE
CORPORATIONS MAKE NO WARRANTY, EXPRESS OR IMPLIED, AS TO RESULTS TO BE OBTAINED BY LICENSEE, OWNERS OF THE PRODUCT(S), OR ANY OTHER PERSON OR
ENTITY FROM THE USE OF THE NASDAQ-100 INDEX® OR ANY DATA INCLUDED THEREIN. THE CORPORATIONS MAKE NO EXPRESS OR IMPLIED WARRANTIES, AND
EXPRESSLY DISCLAIM ALL WARRANTIES OF MERCHANTABILITY OR FITNESS FOR A PARTICULAR PURPOSE OR USE WITH RESPECT TO THE NASDAQ-100 INDEX® OR ANY
DATA INCLUDED THEREIN. WITHOUT LIMITING ANY OF THE FOREGOING, IN NO EVENT SHALL THE CORPORATIONS HAVE ANY LIABILITY FOR ANY LOST PROFITS OR
SPECIAL, INCIDENTAL, PUNITIVE, INDIRECT, OR CONSEQUENTIAL DAMAGES, EVEN IF NOTIFIED OF THE POSSIBILITY OF SUCH DAMAGES.
BSE
The Bombay Stock Exchange Limited (“the Exchange”) has given vide its letter dated February 10, 2011 permission to the Mutual Fund to use the Exchange’s name in this
Scheme Information Document as one of the stock exchanges on which the Mutual Fund’s units are proposed to be listed subject to, the Mutual Fund fulfilling the various criteria
for listing. The Exchange has scrutinized this Scheme Information Document for its limited internal purpose of deciding on the matter of granting the aforesaid permission to the
Mutual Fund. The Exchange does not in any manner:-
1. warrant, certify or endorse the correctness or completeness of any of the contents of this SID;
2. warrant that the Mutual Fund’s units will be listed or will continue to be listed on the Exchange;
3. take any responsibility for the financial or other soundness of the Mutual Fund, its sponsors, its promoters, its management or any scheme or project of this Mutual Fund.
and should not for any reason be deemed or construed that the Scheme Information Document has been cleared or approved by the Exchange. Every person who desires to apply
for or otherwise acquire any units of Motilal Oswal NASDAQ-100 (MOFN100) of this Mutual Fund may do so pursuant to independent inquiry, investigation and analysis and shall
not have any claim against the Exchange whatsoever by reason of any loss which may be suffered by such person consequent to or in connection with such subscription
/acquisition whether by reason of anything stated or omitted to be stated herein or any other reason whatsoever.
40 For Financial Professionals. Proprietary Content. Permission to reprint or distribute any content from this presentation requires
the written approval of Motilal Oswal Asset Management Company.You can also read