An analysis of Disability Allowance inflows and outflows - December 2018
←
→
Page content transcription
If your browser does not render page correctly, please read the page content below

Department of Employment Affairs and Social Protection

    An analysis of Disability
    Allowance inflows and
    outflows

    December 2018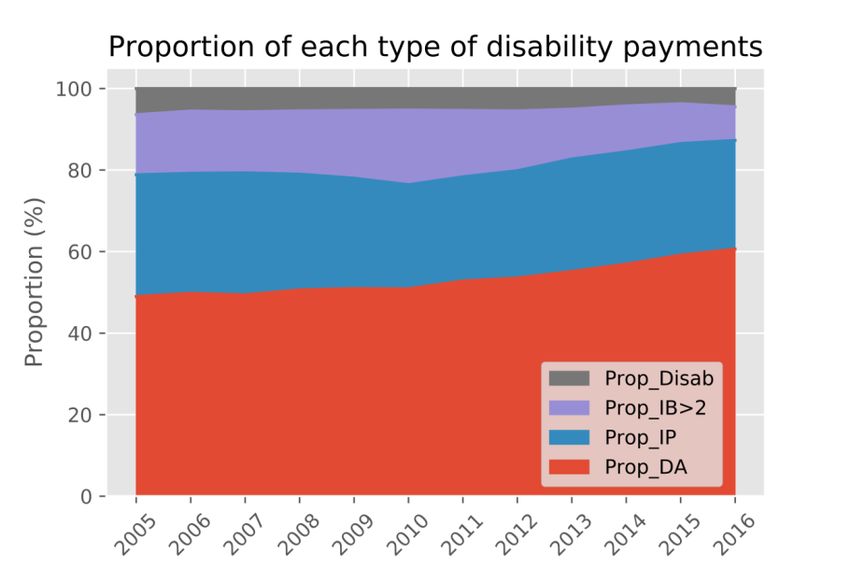
An analysis of
      Disability
      Allowance inflows
      and outflows
      Characteristics of recipients,
      previous status and earnings while
      in receipt of Disability Allowance

      Hugh Cronin

      December 2018

This paper has been prepared by an IGEES economist working in the
Statistics and Business Intelligence Unit of the Department of Employment
Affairs and Social Protection. The views presented in this paper are those of
the author alone and do not represent the official views of the Department
of Employment Affairs and Social Protection or the Minister for Employment
Affairs and Social Protection. Analytical papers are prepared on an ongoing
basis and reflect the data available at a given point in time.
                                       1
Department of Employment Affairs and Social Protection Acknowledgements This paper is an input into an Inter Departmental Technical Review of the Disability Allowance Scheme conducted by the Department of Employment Affairs and Social Protection and the Department of Public Expenditure and Reform. The analysis was conducted with the assistance of Stéphanie Tcha, Hunar Dhamija and Mark O’Grady, and benefits from comments on earlier drafts by Terry Corcoran, Ciaran Judge, David Dillon of the Department of Employment Affairs and Social Protection and by the Social Protection Vote in the Department of Public Expenditure and Reform. Any errors remain the responsibility of the author.
Department of Employment Affairs and Social Protection

 I.      Introduction
This analysis is being carried out to examine in greater depth the factors
affecting the increase in the number of recipients of Disability Allowance outlined
in a Spending Review 2017 paper entitled 'Disability Allowance Expenditure
Drivers'. It presents analysis of the data the Department of Employment Affairs
and Social Protection holds on recipients of Disability Allowance and other illness
and disability payments and sets this in the context of population changes as
measured by the Census and population estimates produced by the Central
Statistics Office.

The purpose of the analysis is to provide greater understanding of the dynamics
of the Disability Allowance scheme, as well as to improve understanding of the
drivers of changes in the number of recipients.

The paper investigates inflows to Disability Allowance from other schemes, and
analyses outflow from the scheme as well as presenting new data on earnings
and projecting future recipients of illness and disability payments. It contains
sections on the three elements that contribute to the total number of recipients
at a given point: the inflow, the stock, and the outflow.

Background
Disability Allowance is a means-tested payment for people with a specified
disability whose income falls below certain limits and who are aged between 16
and 66 years. It is administered by the Department of Employment Affairs and
Social Protection. The scheme was introduced on 2 October 1996 and replaced
the Disabled Person's Maintenance Allowance, which was administered by the
Health Boards.

To qualify for a Disability Allowance payment a person must:

    o    have an injury, disease or physical or mental disability that has continued
         or may be expected to continue for at least one year,
    o    as a result of this disability, be substantially restricted in undertaking work
         that would otherwise be suitable for a person of that age, experience and
         qualifications,
    o    be aged between 16 and 66 years,
    o    satisfy a means test, and
    o    be habitually resident in the State.

The number of recipients of Disability Allowance is presented in Table 1:

Year                      2012         2013      2014       2015      2016        2017
Number of              101,784      106,279   112,097    119,042   126,203     133,929
recipients

Table 1: Recipients of DA by year
Department of Employment Affairs and Social Protection
II. Inflow
At its most basic level, the number of recipients of Disability Allowance at any
one time is a function of average duration and inflow. Inflow, in turn, is affected
by several factors, including
Demographic change
Changes in the distribution of recipients across working age and illness
and disability payments
Movements from schemes that apply to a younger cohort
This section examines these elements in turn, first by examining increases in the
population and the number of recipients of the illness and disability payments,
then by isolating the demographic component of this increase, and finally by
quantifying the contribution of demographic change component and movements
between other illness and disability schemes, movements from other working
age schemes and movements from schemes that apply to a younger cohort.
Demographic changes
Any increase in the working age population implies an increase in the eligible
cohort. Furthermore, increases in population are often not uniform across all age
cohorts, with some increasing more than others. Given that age bands do not
share the same prevalence of disability, if a certain age cohort has a greater
probability of disability, any increase in that age cohort will swell the recipient
numbers without any change in the prevalence rate.
Table 2 shows the increase in the eligible population from 2012-2017, based on
Census and population estimate data.
Year 2012 2013 2014 2015 2016 2017
Population 3,096.3 3,093.5 3,100.9 3,118.7 3,147.8 3,179.6
15-65
years
(‘000s)
Table 2:Census and population estimate data for eiligble population, 2012-2017
The Spending Review paper refers to population changes as contributing a minor
share of the overall increase in Disability Allowance recipients, contrasting the
1.4% increase in the population of those aged 15-64 with the 22.6% growth in
the number of Disability Allowance recipients over the same period. That paper
isolates demographic change between 2012 and 2016 by taking the 2012
Disability Allowance population coverage rate per age cohort and adjusting for
the annual change in disability prevalence by 2011 Census data and 2016
Census data.Department of Employment Affairs and Social Protection
As noted in the paper, the Census measures self-reported disability status and is
not directly related to the number of persons in receipt of the means-tested
Disability Allowance. Consequently, only the increase in disability prevalence,
rather than the prevalence rate level, is factored into the analysis. However,
while the rate of change for the total population is similar in both measures, the
distribution across age cohorts is markedly different, with increases in
prevalence in the older age cohorts between 2011 and 2016 as measured by
Census data but decreases for the same cohorts when measured by
administrative data (see Figure 14 and Table 31 in the appendix).
The intersection between those reporting a disability in the Census and those in
receipt of Disability Allowance is unknown. For there to be an overlap, those
reporting a disability in the Census would have to:
o Be aware of the payment and apply
o Satisfy the eligibility criteria on medical grounds
o Satisfy the means assessment
Perhaps a closer approximation of the Census prevalence rate using
administrative data is the recipients of all illness and disability payments rather
than the number of recipients of Disability Allowance. (Figure 1 shows the
change in this rate between 2011 and 2016 as measured by administrative data
and Census data).
Figure 1:Percentage point change in disability prevalence between 2011 and 2016 as measured by administrative data
and Census data
Using the rich administrative data of the Department of Employment Affairs and
Social Protection, we can also derive a prevalence rate based on the number of
people receiving illness and disability payments within each age group. This
allows us to isolate the contribution of population changes to changes in the
number of recipients of such payments. We can directly measure a prevalence
rate for receiving illness and disability payments for each age group in 2012.
This calculates the prevalence rate for a given age group as the number ofDepartment of Employment Affairs and Social Protection
people in that age group receiving any of the illness and disability payments
expressed as a share of the population in that age group. By calculating the
prevalence rate for each age group and summing them, and by repeating the
analysis using 2017 population estimates, we can isolate the effect of
demographic change between 2012 and 2017. In other words, this exercise will
show how many people we would expect to receive these kinds of payments in
2017 where nothing but population had changed since 2012.
Changes in the number of recipients of illness and disability
payments
Disability Allowance is one of a number of long-term working age illness and
disability payments. To further analyse the trends in recipients of Disability
Allowance requires a view of recipient numbers across all such illness and
disability programmes. To identify drivers of the increase in Disability Allowance
recipient numbers requires consideration of whether that payment alone is
subject to increases at a rate higher than overall population growth and whether
increases in Disability Allowance correspond to decreases elsewhere.
The rationale for setting Disability Allowance in the broader context of illness and
disability payments is twofold:
Policy changes in a given scheme eligibility have an impact on other
illness and disability schemes
The Spending Review paper was produced with the aim of identifying
expenditure drivers, and it is assumed the overall quantum of expenditure
on illness and disability payments is the chief concern.
Table 3 shows the number of working age recipients of illness and disability
payments in 2012, in 2017, and the number expected in 2017 based on 2012
prevalence rates and the population growth in the period 2012-2017. Of the
increase in illness and disability recipients between 2012 and 2017 (22,271), an
increase of 12,998 is consistent with the increase in the working age population
over the same period.
2017 at 2012 Change due
age-specific Total change to
2012 2017 rates 2012-2017 demography
Illness and 193,904 216,175 206,902 22,271 12,998
disability
recipients
Table 3:Working age recipients of illness and disability payments in 2012 and 2017Department of Employment Affairs and Social Protection
Table 4 below sets out the component parts of the changes in recipient numbers
of working age long-term illness and disability schemes from 2012 to 2017,
along with the percentage change. Without adjusting for demographics, the
overall increase in the broader category of all long-term illness and disability
schemes for those of working age is 11%. The long-term illness and disability
payments included in the table are:
o Disability Allowance
o Invalidity Pension
o Illness Benefit over two years
o Disablement Pension
o PRETA (Pre-retirement Allowance)
PRETA, now closed, is included on the basis that, although not a payment based
on illness or disability, it was a long-term payment that was not conditional on
seeking employment. Secondly, those who have moved from jobseeker
payments to Disability Allowance are close to the age and duration profile of
PRETA recipients (see ‘Profile of jobseekers moving to Disability Allowance’
below). Excluding PRETA gives identical results for the younger age cohorts (as
they were never entitled to PRETA) and broadly similar results for older age
cohorts.
Change 2012-
2012 2013 2014 2015 2016 2017 2017
Long-term
illness/disability 193,904 195,496 198,843 202,451 208,653 216,175 22,271 11%
schemes
Of which :
DA 101,784 106,279 112,097 119,029 126,116 133,838 32,054 31%
Invalidity pension 50,053 53,196 54,223 55,115 55,492 57,446 7,393 15%
Illness Benefit>2 27,916 23,561 22,218 19,676 17,114 15,040 -12,876 -46%
Disablement pension 10,467 9,796 8,418 7,521 9,380 9,680 -787 -8%
PRETA 3,684 2,664 1,887 1,110 551 171 -3,513 -95%
Table 4:Change in recipient numbers of working age long-term illness and disability schemes from 2012 to 2017, by
scheme
Combining the two elements discussed thus far (the expected change in
recipient numbers given the population changes between 2012 and 2017 and the
changed distribution across other illness and disability schemes) Table 5 below
estimates the number of recipients for working-age long-term illness and
disability schemes in 2017 if the prevalence rates from 2012 remained the same.
This allows us to isolate the following elements:Department of Employment Affairs and Social Protection
o The effect of population growth, particularly where age groups with a
particular disposition to illness and disability have expanded
o the balance once demographic factors have been accounted for, which
may be due to:
o changes in age-specific rates (there is no reason to assume the rates
for particular age bands will remain at the 2012 level)
o changed distribution across schemes given the likely response of
people to policy changes
o inflow from those not in receipt of illness and disability payments in
2012
Finally, the change is measured as a percentage of the working age population.
Balance --
due to
changes in
age-specific
2017 at rates and
2012 changed
age- Change due distribution
specific to Total across
2012 2017 rates demography change schemes
Long-term 193,904 216,175 206,902 12,998 22,271 9,273
illness/disability
schemes
Of which:
DA 101,784 133,838 106,582 4,798 32,054 27,256
Invalidity 50,053 57,446 54,760 4,707 7,393 2,686
pension
IB>2 years 27,916 15,040 30,220 2,304 -12,876 -15,180
Disablement 10,467 9,680 11,289 822 -787 -1,609
pension
PRETA 3,684 171 4,051 367 -3,513 -3,880
As a % of WAP 6.30% 6.80% 6.50% 0.40% 0.70% 0.30%
Table 5:Component parts of change in recipient numbers, 2012-2017
The trend in the share of the population receiving the broader range of illness
and disability payments is flat. The 2012 to 2017 increase in the share of the
working age population receiving a long-term illness or disability payment is 0.5Department of Employment Affairs and Social Protection percentage points. Within age groups, the change between 2012 and 2017 is less than one percentage point in all cases. 1 There is a sharp increase in the number of Disability Allowance recipients between 2012 and 2017, and decreases in PRTEA, Disablement Pension and Illness Benefit over two years. The decreases in PRETA and Illness Benefit over two years are smaller in absolute terms but larger in relative terms. The most notable change between 2012 and 2017 is the decrease of 12,876 in the number of recipients of Illness Benefit for over two years. This came about due to policy change implemented in 2009. Having increased steadily from 25,126 in 2006 to 32,507 in 2009, the number of Illness Benefit recipients (specifically, those in receipt of the payment for over two years) changed considerably after the imposition of the upper limit of two years. It peaked in 2010 at 36,411 before falling to 27,916 in 2012 and to 15,040 in 2017. The Spending Review paper estimates this change contributed 4,000, or 14%, of the increase in the number of Disability Allowance recipients over 2012-20162. This estimate is based on the position prior field (discussed in the next section). An alternative method of gauging the change in the number of Disability Allowance recipients due to the Illness Benefit policy change is to estimate the prevalence rate for Illness Benefit (restricting it to cases over two years) for each age group and projecting the 2017 total based on 2012 rates. By accounting for demographic changes in each age group between 2012 and 2017, we can estimate how many additional people would have been in receipt of Illness Benefit without the two year maximum being imposed. Taking the 2012 figure (which had already declined from its 2010 peak) and adjusting it to account for demographic changes leads to a 2017 estimate of over 30,000 - 15,180 higher than the actual number of recipients in 2017. With the sharp decrease in Illness Benefit and the increase in Disability Allowance, it seems likely that some of those who would have remained on Illness Benefit have moved to other illness and disability payments, specifically Disability Allowance.3 1 This analysis confirms the trends outlined in the analysis note prepared by the Department of Social Protection (as was) in 2014, entitled ‘Trends in Movements of People from Jobseeker Schemes into Inactive Disability Related Working-Age Payments’. 2 The paper acknowledges this is “likely to be a lower estimate given that some persons formerly in receipt of Illness Benefit may have moved to a temporary/transition payment, such as Supplementary Welfare Allowance, while awaiting processing of their DA application”. 3 This transfer from Illness Benefit to Disability Allowance applies only to those who meet the requirements of the means test for Disability Allowance.
Department of Employment Affairs and Social Protection

Figures 2 shows the component parts of illness and disability recipients over
time, with the proportion of those receiving Illness Benefit over two years (as a
                                                       share of recipients of all
                                                                  illness/disability
                                                       payments)        decreasing
                                                       and Disability Allowance
                                                       increasing.        Invalidity
                                                       Pension and Disablement
                                                       Pension remain relatively
                                                       static as shares of all
                                                       illness   and       disability
                                                       payments.

Figure 2:Proportion of illness and disability recipients in each scheme, 2005-
2016

Inflows to Disability Allowance
Beyond demographic factors, further analysis of expenditure in the Spending
Review 2017 paper is informed by an examination of the 'position prior' field on
the Department’s record of applications for Disability Allowance. As noted in the
paper, the field is of variable quality, with over one quarter of statuses recorded
as 'unknown'. The Spending Review 2017 paper uses this data field to identify a
majority of the inflow to the 16-18 year cohort as former qualified children on a
parent’s social welfare payment and 13% of the total inflow as migration from
jobseeker schemes.

This analysis uses a different approach, examining the population of DEASP
clients who are recipients of certain payments at fixed points, and then re-
examining the population to identify transitions to other payments. While all
administrative data may include some errors, data underpinning the payment of
benefits to clients is generally of a high quality. This analysis does not depend on
fields where the data input may vary according to differing interpretations of the
list of possible codes. Instead, it measures the cohort in receipt of a given
payment at a point in time and measures how many of those are in receipt of a
different payment at a later point in time as a means of tracking movements
between schemes.

This analysis is carried out in respect of three potential inflows to Disability
Allowance: recipients of jobseeker payments, recipients of One-Parent Family
Payment and beneficiaries of Domiciliary Care Allowance.
Department of Employment Affairs and Social Protection
Inflows to Disability Allowance from jobseeker payments
Trends in recipients of jobseeker payments moving to Disability Allowance are
examined by analysing Live Register (LR) exits - that is, all LR episodes with an
end date between 01 January and 31 December in a given year, covering the
period 2012-2016. Live Register jobseeker payments consist primarily of
Jobseekers Benefit and Jobseekers Allowance. Where more than one exit occurs
in a calendar year, the latest is selected. The seasonal fluctuation is illustrated in
Figure 3.
The set of all
Disability Allowance
recipients in January
of the following year
is examined to see
what overlap, if any,
between closed LR
episodes in a given
year and receipt of
Disability Allowance
by January of the
following year.
Analysis is restricted
Figure 3:Live Register exits, 2012-2016 to claims designated
'Awarded and
Paying'. The reference year is the year in which the exit occurred.
An increasing share of all exits are to Disability Allowance - note, this remains a
small proportion of the total. Almost 99% of exits from the Live Register are to
destinations other than Disability Allowance or Invalidity Pension.
Figure 4:DA and IP exits as a share of total exits, 2012-2016Department of Employment Affairs and Social Protection
2012 2013 2014 2015 2016
Total exits 253,035259,564258,859250,534237,857
Other destinations 252,083257,814256,473247,274233,578
As % of total exits 99.6% 99.3% 99.1% 98.7% 98.2%
Disability Allowance 813 1,576 2,241 3,114 4,127
As % of total exits 0.3% 0.6% 0.9% 1.2% 1.7%
Invalidity Pension 139 174 145 146 152
As % of total exits 0.1% 0.1% 0.1% 0.1% 0.1%
Table 6:LR exits to DA, IP and other destinations
It should be noted, however, that matching jobseeker exits to Disability
Allowance recipients in January of the following year and examining this trend
over time depends on stable processing times. The average weeks to award for
Disability Allowance claims was much lower in 2014-2016 compared to 2012
and, particularly, 2013. The analysis should be interpreted in light of the
processing times outlined in Table 7 below. Specifically, the rate of increase may
be overstated but the current levels are robust measurements.
Claims Average
No. of claims pending, end weeks to
Year awarded of year award
2016 16,669 5,947 12
2015 15,814 4,855 11
2014 13,876 6,058 12
2013 12,497 5,022 28
2012 10,400 7,775 19
Table 7:DA processing times, 2012-2016
The effect of JobPath on inflows to Disability Allowance from
jobseeker payments
Public Employment Services (PES) help equate supply and demand on the labour
market, by aiding the matching process between employers and jobseekers. In
Ireland, the PES is managed by the Department of Employment Affairs and
Social Protection (DEASP) and is delivered via two main channels; directly
through the Intreo service or through contractors. JobPath, introduced in July
2015, is an example of a contracted-PES scheme.
Two contractors provide the service in discrete geographical areas. The
Department of Employment Affairs and Social Protection selects jobseekers on a
random basis for referral to JobPath. For those that are referred, participation is
mandatory.Department of Employment Affairs and Social Protection
The roll-out of JobPath occurred in two phases over 2015-2016. Referrals to
JobPath are now made from all Intreo centres. More broadly, an increasing
range of clients of Intreo centres are now subject to activation.
To see if JobPath had an effect on the number of people who moved from
jobseeker payments to Disability Allowance, Figure 5 shows the exits grouped by
two sets of offices - those who commenced referrals to JobPath in the second
half of 2015 and those who commenced referrals to JobPath in the first half of
2016.
As an activation service phased in over time, JobPath may indicate whether
activation more broadly has an effect on the jobseeker cohort and the likelihood
of movement from jobseeker to Disability Allowance. This may arise as a result
of:
o greater intensity of engagement with staff, meaning clients are
directed towards the most appropriate payment,
o greater awareness of certain payments, or
o broader service provision.
The trend from 2012 is for
offices that commenced
referrals to JobPath in the first
half of 2016 to have a slightly
lower number of exits. Some
divergence is discernible in
exits to Disability Allowance
between the two sets of
offices after the first wave of
offices commenced referrals
to JobPath, indicating a
temporary effect of increased
movement to Disability
Figure 5:Exits to DA by JobPath office group Allowance as Intreo centres
referred clients to JobPath.
It should be noted that this divergence does not account for how the number of
long-term unemployed people was divided between the two sets of offices.
Second, the offices aggregated into two groups started at different times within
these groups. Third, the initial cohort referred to JobPath was those unemployed
for more than three years – the likeliest cohort to move from jobseekers to
disability payments (see below ‘Profile of jobseekers moving to Disability
Allowance’).Department of Employment Affairs and Social Protection
Profile of jobseekers moving to Disability Allowance
This section examines the characteristics of those who move from jobseeker
payments to Disability Allowance, contrasting the age, duration of claim and
previous occupation with other jobseekers.
The first characteristic examined is age, with Figure 6, below, illustrating the
difference between those who exit to Disability Allowance (at the upper end of
the age distribution) and all exits (where the majority are at the lower end of the
age distribution).
Table 8 below shows the
characteristics of jobseekers
who have moved to Disability
Allowance between 2012 and
2016 by claim duration within
age bands.
The two largest groups are
those aged 50-59 with at least
three years' duration on the
Live Register and those aged
40-49 with at least three years'
duration on the Live Register.
While three years is the
Figure 6:Age profile of exits to DA and other exits
highest category in the table,
the mean duration of the jobseeker claims of those who move to Disability
Allowance increases between 2012 and 2016 from 3.5 to 4.5 years.
It is noteworthy that those in the age cohort with the greatest prevalence of exit
from jobseeker payments to Disability Allowance, those aged 50-59, have had a
markedly different trajectory to other age cohorts, with their numbers on the LR
continuing to rise after claimant numbers in other age cohorts had begun to fall,
and falling more slowly than other age cohorts. The number of jobseekers in the
40-59 age cohort is falling but at a slower pace than overall Live Register
numbers. As a share of the total Live Register, the 40-59 age cohort remains
approximately 15%.Department of Employment Affairs and Social Protection Figure 7: Jobseekers aged 40-59 with duration >3 years, as share of total LR Disability Allowance recipients with previous jobseeker claim, by age and duration of claim Age and Under 25-29 30-39 40-49 50-59 60+ Duration 25
Department of Employment Affairs and Social Protection
are more likely to be in the ‘Personal And Protective Service Occupations’ and
‘Plant And Machine Operatives’ categories.
Transition All
from JA to jobseekers,
Percentage of each category in the following occupations:
DA, 2012- LR sample
2016 2012-2016
Managers and Administrators 1.36 3.0
Professional Occupations 2.51 9.7
Associate Professional And Technical Occupations 2.48 4.6
Clerical And Secretarial Occupations 5.80 14.5
Craft and Related Occupations 20.41 19.8
Personal And Protective Service Occupations 14.44 10.9
Sales And Customer Service Occupations 8.67 9.6
Plant And Machine Operatives 15.09 13.0
Other Occupations 12.66 7.8
Unknown or no stated occupation or those who never worked 16.56 7.1
Total 100 100
Table 9:Occupational distribution, DA cohort and LR sample
Analysing this within age groups (Table 10 below) provides further clarity on
those who exit from jobseeker claims to Disability Allowance. The large share in
the category of ‘Unknown or no stated occupation or those who never worked’ is
largely attributable to those in the Under 25 and 25-29 age group. The
jobseeker identified in the preceding table as most at risk of moving to Disability
Allowance (40-49 years and 50-59 years) overrepresented in the ‘Craft and
Related Occupations’ category.
Previous occupation of jobseekers moving to Disability Allowance, normalised by age
Under
Age→ and Occupation 25-29 30-39 40-49 50-59 60+
25
Occupation
Associate Professional And Technical
0.02 0.03 0.03 0.03 0.02 0.02
Occupations
Clerical And Secretarial Occupations 0.03 0.06 0.07 0.06 0.05 0.06Department of Employment Affairs and Social Protection
Previous occupation of jobseekers moving to Disability Allowance, normalised by age
Under
Age→ and Occupation 25-29 30-39 40-49 50-59 60+
25
Occupation
Craft and Related Occupations 0.08 0.16 0.19 0.21 0.24 0.25
Managers and Administrators 0.00 0.01 0.01 0.01 0.02 0.02
Other Occupations 0.08 0.10 0.11 0.13 0.14 0.16
Personal And Protective Service
0.11 0.13 0.13 0.15 0.17 0.13
Occupations
Plant And Machine Operatives 0.12 0.13 0.15 0.15 0.16 0.17
Professional Occupations 0.01 0.02 0.03 0.03 0.02 0.03
Sales And Customer Service Occupations 0.13 0.13 0.10 0.09 0.07 0.07
Unknown, no stated occupation or never
0.41 0.23 0.17 0.15 0.12 0.09
worked
Total
1.00 1.00 1.00 1.00 1.00 1.00
All occupations
1,186 863 1,937 2,763 3,635 1,503
Table 10:Previous occupation of jobseekers moving to DA, normalised by age, 2012-2016
In summary, the number of jobseekers who moved to Disability Allowance grew
rapidly between 2012 and 2016 but these jobseekers are from a relatively
homogenous cohort. That cohort is now decreasing in absolute terms and
remains a steady share of a decreasing Live Register. Age and duration go some
way to identifying the cohort of jobseekers who have moved to Disability
Allowance, largely those between 40-59 years and with the most recent mean
durations at four and a half years. In recent years, the number of people with
those age and claim duration characteristics has decreased considerably.
Inflows to Disability Allowance from One-Parent Family Payment
Another potential inflow to Disability Allowance is from One-Parent Family
Payment. Table 11 below shows the inflow to Disability Allowance where an exit
from OFP occurred in the preceding calendar year. This is presented in the same
manner as the jobseeker exits, counting all exits in the calendar year and
counting the number who are in receipt of Disability Allowance in January of the
following year. There is considerable variance in the inflow with no particular
trend. This is most likely related to the OFP reforms and the variance in the
number of OFP recipients over this time. In any event, the inflow to Disability
Allowance is relatively small and there is no reason to think it will become a
more significant inflow in years to come.Department of Employment Affairs and Social Protection
Total no of
Exit Year Entry Year Total Exit No of DA Of exits, % recipients in
from OFP to DA from OFP recipients entry to DA OFP as of
exit year
2012 2013 15,882 180 1.13% 86,941
2013 2014 20,276 378 1.86% 78,246
2014 2015 18,705 370 1.98% 69,884
2015 2016 33,796 653 1.93% 41,468
2016 2017 10,652 156 1.46% 40,317
Table 11:Inflow to DA, with exit from OFP in the preceding calendar year
Inflows to Disability Allowance from DCA
The third part of inflow analysis examines inflow to Disability Allowance at the
lower end of the age range, specifically, the extent to which Domiciliary Care
Allowance (DCA) beneficiaries transfer to Disability Allowance upon exit from
DCA. The earliest point at which one can receive Disability Allowance is 16 years,
which is also the upper limit for receipt of DCA.
Table 12 outlines the increase in beneficiaries of DCA from 2010-2016, and the
increase in the number of beneficiaries aged 15. Those aged 15 as a share of all
DCA beneficiaries has increased slightly between 2010 and 2016. As a potential
inflow to Disability Allowance, it is worth noting the increase in the population of
15 year olds, the overall increase in the number of beneficiaries of DCA, and the
increasing number of beneficiaries aged 15.
2010 2011 2012 2013 2014 2015 2016 2017
CSO
population
estimates at
15 years 56,080 56,726 58,385 59,555 60,993 60,593 61,124 62,936
DCA
Beneficiaries 25,234 25,914 26,516 27,363 29,269 31,628 34,627 38,846
Beneficiaries
aged 15 1,813 1,863 2,003 2,140 2,293 2,453 2,686 2,850
DCA
beneficiaries
aged 15 as
share of all 15
year olds 3.23% 3.28% 3.43% 3.59% 3.76% 4.05% 4.39% 4.53%
Table 12:Beneficiaries of DCA, 2010-2016, beneficiaries aged 15, and as share of 15 year olds. Source: CSO Population
Estimates, PEA11
Furthermore, the number of DCA beneficiaries aged 15 years shows higher year
on year increases than that of the population aged 15 years (Table 13).Department of Employment Affairs and Social Protection
2010 2011 2012 2013 2014 2015 2016 2017
Y-on-y
increase in
0.55% 1.15% 2.92% 2.00% 2.41% -0.66% 0.88% 2.96%
population
aged 15, (%)
Y-on-y
increase in
N/A 2.69% 2.32% 3.19% 6.97% 8.06% 9.48% 12.18%
beneficiaries
aged 15, (%)
Table 13:DCA beneficiaries aged 15 years year-on-year increase, and population aged 15 years year-on-year. Source: CSO
Population Estimates, PEA11
The next part of the analysis considers the number of children who are
beneficiaries of DCA two months before their 16th birthday. This cohort is
examined to see how many have been awarded Disability Allowance two months
after their 16th birthday to determine the proportion of DCA recipients who
transfer to Disability Allowance and those who exit DCA but do not move to
Disability Allowance. This analysis is repeated over time to see if the share of
DCA beneficiaries moving to Disability Allowance shortly after their 16th birthday
is changing.
The increase in the number of DCA beneficiaries moving to Disability Allowance
over the period 2013 to 2017 is shown in Figure 8. The number of beneficiaries
of DCA who moved to Disability Allowance after reaching 16 years of age
increased in absolute terms by approximately 20% each year over 2014-2016
before decreasing in 2017. 4
It should be noted that the increase in the number of beneficiaries of DCA who
moved to Disability Allowance after reaching 16 will be affected by the number
of DCA recipients approaching their 16th birthdays. Figure 8 shows the share of
beneficiaries of DCA who have a subsequent Disability Allowance claim, as a
proportion of the total in each month selected.
4
The number of Disability Allowance recipients who transfer from DCA on reaching 16 years may correspond
to what is described in the Spending Review paper as a mixture of the categories of ‘Child’, ‘Qualified child’
and DCA beneficiaries.Department of Employment Affairs and Social Protection
Figure 8:Number of DCA beneficiaries moving to DA, or exit, 2013-2017
This share of DCA
beneficiaries moving to
Disability Allowance remains
largely between boundaries of
40% and 55% in the period in
question.
The movement in DCA
beneficiaries could be driven
by one particular cohort of
beneficiaries sharing certain
characteristics. By analysing
Figure 9:Share of DCA beneficiaries aged 15 moving to DA
nationality and sex, it appears
that the share of Irish and non-Irish and the share of male and female changes
somewhat over time but with the overall trend driven by, in order, Irish boys,
Irish girls, non-Irish boys and non-Irish girls (Figure 10).Department of Employment Affairs and Social Protection Figure 10:share of DCA beneficiaries moving to DA, by sex and nationality The increasing number of beneficiaries of DCA is outlined in Table 14 below. If the share of those moving to Disability Allowance aged 16 remains constant and the number of beneficiaries increases, the inflow to Disability Allowance from DCA can be expected to increase. Beyond that, it is difficult to estimate the number of beneficiaries of DCA in future years as medical conditions can improve (meaning current beneficiaries will exit DCA before reaching 16 years of age) or emerge or worsen (this will generate future inflow to the scheme). Figure 11 shows the number of current DCA recipients by the year in which they are expected to turn 15 years of age. As a basis for estimating inflow to Disability Allowance from DCA, it does not account for future inflow to the scheme (where medical conditions become apparent at a later age) or exits from DCA before reaching 16 years of age
Department of Employment Affairs and Social Protection
(where the medical condition in respect of which the payment was awarded
improves).
Age 2010 2011 2012 2013 2014 2015 2016
10 2,037 2,183 2,175 2,080 2,294 2,381 2,666
11 2,024 2,120 2,249 2,244 2,245 2,501 2,620
12 2,012 2,093 2,181 2,285 2,341 2,411 2,744
13 1,887 2,060 2,140 2,218 2,377 2,496 2,594
14 1,826 1,952 2,071 2,205 2,313 2,517 2,652
15 1,813 1,863 2,003 2,140 2,293 2,453 2,686
Table 14:Number of DCA beneficiaries, by single year of age
Finally, it should be noted
that the increase in
prevalence among younger
cohorts, which could lead to
an increase in inflow to
Disability Allowance, was
highlighted in the 2014 paper
‘Trends in Movements of
People from Jobseeker
Schemes into Inactive
Disability Related Working-
Age Payments’.
Figure 11:Current DCA recipients and projected year of reaching 15 years
of age
Summary
The increase in the number of Disability Allowance recipients has been examined
in both the Spending Review paper and this analysis conducted by DEASP. This
estimate of shares of the increase in Disability Allowance recipients attributable
to different effects differs from the Spending Review 2017 paper in how the
analysis is approached and the quality of administrative data available.
The following points arise from this analysis of past inflows:
The characteristics of those who transferred from jobseeker payments to
Disability Allowance over recent years are shared by a rapidly decreasing
number of people currently on the Live Register; accordingly, the number
of people who move from jobseeker payments to Disability Allowance
seems unlikely to increase in the coming years;
The policy change to Illness Benefit has most likely led to an increase in
Disability Allowance recipients. While difficult to model what would haveDepartment of Employment Affairs and Social Protection
happened in the absence of change, projections based on 2012 prevalence
rates suggest some 15,000 people would otherwise be in receipt of Illness
Benefit. It is reasonable to assume some are now in receipt of Disability
Allowance instead.
All other factors being equal, the inflow from DCA will continue to rise in
line with the increase in the number of 15 year olds who are beneficiaries
of DCA;
Population projections and prevalence rates suggest increased prevalence
among the younger cohorts may translate into greater inflows among 16-
24 year oldsDepartment of Employment Affairs and Social Protection
III. Stock of Disability Allowance recipients
This section examines the characteristics of the stock of 134,682 Disability
Allowance recipients as of January 2018, including age, sex, nationality, duration
of claim and employment. The number of weeks of insurable employment is
presented as a measure of work intensity and attachment to the labour market.
Demographic characteristics:
Tables 15 and 16 and Figure 12 show the demographic characteristics of the
stock of Disability Allowance recipients as of January 2018. The median age is 46
for male and female recipients and the recipients are predominantly Irish. The
male/female split is broadly similar among Irish (58%/42%) and non-Irish
(55%/45%).
Figure 12:Age of DA recipients in January 2018
Disability Allowance recipients, by sex and nationality
Sex Number of Median age
recipients
Female 57,431 46
Male 77,251 46
Table 15:DA recipients, median age
Sex Irish Non-Irish
Female 49,381 8,050
Male 67,436 9,815
Total 116,817 17,865
Table 16:DA recipients, by sex and nationalityDepartment of Employment Affairs and Social Protection
Duration of receipt of Disability Allowance
Mean duration suggests DA is a long-term scheme for many, with an average
duration of 8.72 for women and 8.96 for men.
Sex Number of recipients Mean duration Standard deviation
Female 57,431 8.72 6.71
Male 77,251 8.96 6.65
Table 17:Mean duration of receipt of DA, by sex
Employment
The data on employment activity are annual and do not distinguish between
earnings of recipients of Disability Allowance above or below the disregard.
Weeks of insurable employment are measured by the number of Class A PRSI
contributions made in a given year. This provides an indicator of intensity of
work in a calendar year. The most recent information on employment is for
2016.
To make reasonable inferences about trends in employment, a series of subsets
of the DA stock as of January 2018 are created to examine:
The medium-term trend of employment by those in receipt of DA
The most recent level of employment while receiving DA
The most recent level of employment prior to receiving DA
First, for medium-term trend analysis, the dataset is restricted to Disability
Allowance claims preceding 01 January 2013. This gives 81,826 recipients who
are still part of the population of recipients in January 2018. Of these, 10%
(8,351) paid some Class A contributions in 2016. This identifies those who have
a reasonably long history of working while in receipt of DA.
The demographic characteristics are broadly the same for those who made Class
A contributions and those who did not and are outlined in Table 18:
By sex By nationality
Total Female Male Irish Non Irish
DA claims in January 81,826 33,970 47,856 71,815 10,011
2018, where start date
precedes 01 January
2013
Of which no Class 73,475 30,300 43,175 64,109 9,366
A weeks
Of which some 8,351 3,670 4,681 7,706 645
Class A weeks
Table 18:Employment in 2016 for DA recipients in January 2018, where start date precedes 01 January 2013Department of Employment Affairs and Social Protection
While 10% of recipients were engaged in some employment resulting in Class A
contributions, gauging the intensity of work requires an examination of the
number of weeks. The median weeks of insurable employment for the group that
made some Class A contributions shows a reasonably stable pattern from 2013
to 2016, which is close to the maximum of 52.
Sex 2013 2014 2015 2016
Female 48 48 47 48
Male 49 47 48 48
Table 19:Median weeks of insurable employment, 2013-2016
Finally, the earnings of
this cohort can be
examined over the same
period5. Table 20 below
shows median earnings
by sex for each year,
2013-2016, which is
broadly similar for male
and female.
Table 21 shows the
average earnings per
week, where annual
earnings are divided by
Figure 13:Median earnings in 2016 for DA recipients where start date precedes
01 January 2013, by sex weeks of insurable
employment. Even
under the assumption that the earnings are at minimum wage rates, the level of
annual earnings and the number of weeks of insurable employment suggests
part-time work. Without further data, it is not possible to estimate the number
of hours per week to gauge intensity of work.
Class A - Median earnings per year (€, nominal) for those in
receipt of DA pre-2013 and with some weeks of Class A
contributions
2013 2014 2015 2016
Male 5,448 5,892 6,080 6,240
Female 5,412 5,839.5 5,774 6,014
Table 20:Median earnings per year (€, nominal) for those in receipt of DA pre-2013 and with some weeks of Class A
contributions
5
Earnings are defined as total taxable earnings, or gross earnings less employee contributions to health
insurance, superannuation (including contributions to the spouse's scheme, additional voluntary contributions,
purchased notional service), the pension levy, union subscriptions, and the travel pass scheme.Department of Employment Affairs and Social Protection
Class A - Average earnings per week (€) in
2016 for those in receipt of DA pre-2013 and
with some weeks of Class A contribution
Male 187.28
Female 159.69
Table 21:Average earnings per week (€) in 2016 for those in receipt of DA pre-2013 and with some weeks of Class A
contribution
Finally, for this cohort, total earnings are slightly higher, encompassing earnings
under Class S and other PRSI classes.
Median total earnings per year (€, nominal)
for those in receipt of DA pre-2013
2013 2014 2015 2016
Irish 4,716.5 4,961 5,196.5 5,315
Non- 4,243.5 4,394.5 4,549 4,938
Irish
Table 22:Median total earnings per year (€, nominal) for those in receipt of DA pre-2013, by nationality
Median earnings per year (€, nominal) for
those in receipt of DA pre-2013
2013 2014 2015 2016
Female 4,560 4,903 4,990 5,200
Male 4,718 4,918 5,240 5,397
Table 23:Median total earnings per year (€, nominal) for those in receipt of DA pre-2013, by sex
A slightly wider category is those recipients in January 2018 who were in receipt
of DA before 2016. Table 24 shows the number of weeks of Class A contributions
in 2016, when in receipt of DA. For those who worked, the level of work intensity
as measured by weeks of Class A contributions decreases to 43.
Median weeks of Class A
Sex contributions in 2016
Female 43
Male 43
Table 244:Median weeks of Class A contributions in 2016, by sexDepartment of Employment Affairs and Social Protection
By sex By nationality
Total Female Male Irish Non
Irish
DA claims in 109,847 46,618 63,229 95,904 13,943
January 2018,
where start date
precedes 01
January 2016
Of which no Class A 99,411 41,927 57,484 86,353 13,058
weeks in 2016
Of which some 10,436 4,691 5,745 9,551 885
Class A weeks in
2016
Table 255:Class A weeks in 2016 for recipients in January 2018 (and in receipt of DA before 2016), by sex and nationality
Finally, the third category is those of the January 2018 stock who were in receipt
of DA only after 31 December 2016. The 2016 values show the number of weeks
of Class A employment in the year preceding receipt of DA (Table 26). These are
the more recent recipients of DA, who may have a history of work in the years
preceding the DA claim. Median values show a clear downward trend as the
point of commencement on DA approaches (Table 27).
The examination of longer term trends shows non-Irish recipients less likely to
be in employment than Irish, whereas the trend is reversed in the case of more
recent recipients of DA, with non-Irish are more likely to be in employment.
By sex By nationality
Non
Total Female Male Irish
Irish
DA claims in
January 2018,
where start date is 10,624 4,619 6,005 8,867 1,757
after 31 January
2016
Of which no Class A
8,622 3,664 4,958 7,262 1,360
weeks in 2016
Of which some
Class A weeks in 2,002 955 1,047 1,605 397
2016
Table 26:Class A weeks in 2016 for recipients in January 2018 (and in receipt of DA after 2016), by sex and nationalityDepartment of Employment Affairs and Social Protection Median weeks of Class A contributions in 2016 2013 2014 2015 2016 Female 47 43 34 26 Male 39.5 37 28 22 Table 27:Median weeks of Class A contributions in 2016, by sex
Department of Employment Affairs and Social Protection

IV.    Outflow from Disability Allowance

DA outflow can only be estimated, not calculated or reported in a way that is
entirely reliable. The method of estimation here is to examine the stock of
‘awarded and paying’ recipients in sample months and examine who is no longer
in receipt of the payment at two later points.

For example, the 2013 outflow is calculated on recipients in January but not May
and July, plus recipients in May who are not in receipt in July or October, plus
recipients in July who are not in receipt in October or January 2014. This gives
us a sample of the outflow but misses anyone who joined in February and left in
March or April. While there is no reason to believe we cannot extrapolate from
the sample, the findings should be interpreted in light of this caveat. It may be
that those who have the very shortest duration on DA are different to those with
longer durations; however, given the long duration of the majority of recipients,
it is a useful exercise to capture the characteristics of those who exit and who
have durations over three months.

Not surprisingly, given the long-term durations on the scheme, approximately
one third of the sample outflow is at pension age (66 years). This may be to the
State Pension contributory or the non-contributory counterpart, based on an
individual’s contribution history.

Finally, the outflow is examined to see the number of those who exit Disability
Allowance and record some Class A contributions in the calendar year after the
exit. This provides some indication of the number of people who have recovered
to the extent that they can work unsupported by the Disability Allowance
payment.

Approximately one tenth of the non-pension age exits in this sample are to
employment, as evidenced by the weeks of Class A contribution in the calendar
year following the exit. Table 28 below shows the median number of weeks is
close to the maximum.
Department of Employment Affairs and Social Protection

Year           Sample of              Exits at          % exits to            Non-pension age            Median
                   exits          pension age            pensions               recipients with          Weeks
                                                                               contributions in
                                                                               year of exit +1
2013                 7,533                 1,989            26.40%                         582                  50

2014                 7,654                 2,885            37.69%                              933             50

2015                 8,538                 2,625            30.74%                           1,030              47

2016                 6,805                 2,581            37.93%                              845             50

Total              30,530                10,080                                              3,390

Table 28:Sample outflow from DA, 2013-2016

Future recipient numbers of illness and disability payments
Estimates for future Disability Allowance numbers can be made on the basis of
two factors: a projection of future population growth at current Disability
Allowance recipient rates, and a judgment on whether recent increases in excess
of demographic changes are part of an ongoing trend. However, as seen in the
earlier analysis, the number of recipients of any one illness and disability
payment is sensitive to policy changes in other illness and disability schemes.

Table 29 show the projected number of illness and disability recipients of
(Disability Allowance, Illness Benefit over two years, Invalidity Pension and
Disablement Pension) based on 2017 illness and disability prevalence rates and
incorporating the 2021 CSO projections under a variety of migration and fertility
scenarios.6 This holds the 2017 prevalence rate for each scheme and calculates
the 2021 projection by applying the 2017 rate to the CSO projections of the
population at 2021. A total increase of between 2.35% and 3.97% is expected
on the basis of demographic factors on the assumption that age-specific rates
remain at 2017 levels. The component parts of the projections are as follows:

    o    F1: Total fertility rate to remain at its 2016 level of 1.8 for the lifetime of
         the projections
    o    F2: Total fertility rate to decrease to 1.6 by 2031 and to remain constant
         thereafter
    o    M1: High net inward migration, +30,000 per annum in 2017/2051
    o    M2: Net inward migration continuing at more moderate levels, +20,000
         per annum in 2017/2051

6
  As Illness Benefit over two years is a closed group, the projection only takes into account mortality rates. This
is calculated by sex and single year of age for 2017, 2018, 2019 and 2020. The mortality rates published by
Eurostat are the source for the mortality rates used for the year 2017. These rates are then subject to the
mortality assumptions published by CSO in the “Population and Labour Force projections 2017-2051” to
produce the rates of mortality for the next three years.
Department of Employment Affairs and Social Protection
o M3: Low net inward migration, +10,000 per annum in 2017/2051
M1F1 and M3F1 and
M1F2 M2F1 and M3F2
Population M2F2Population Population
Age for 2021 for 2021 for 2021
15 - 24 years 18,202 17,942 17,678
25 - 29 years 10,279 9,885 9,491
30 - 34 years 10,368 10,121 9,875
35 - 39 years 14,597 14,406 14,215
40 - 44 years 20,496 20,293 20,085
45 - 49 years 25,571 25,424 25,285
50 - 54 years 31,133 31,035 30,947
55 - 59 years 38,306 38,210 38,113
60 - 65 years 55,804 55,686 55,566
Total 224,757 223,002 221,254
Table 29:Projected numbers of illness and disability recipients under varying scenarios
This exercise accounts only for demographic changes as projected under various
scenarios. It does not account for factors other than population change. As seen
earlier in this chapter, a variety of factors outside of demographic increase have
contributed to the increase in recipient numbers of Disability Allowance over
2012-2017, including inflow from jobseeker payments by those with a particular
age, duration and occupational background, policy changes in other working age
illness and disability payments, greater inflow from payments directed towards
cohorts below the minimum age for Disability Allowance, and changes in age-
related rates.
Where there have been increases in age-related rates, this change needs to be
seen in the context of underlying trends in disability prevalence in the broader
population. The relevant data from the census in 2011 and 2016 suggest that
increased prevalence goes some way to explaining the increase in receipt of
illness and disability payments.Department of Employment Affairs and Social Protection V. Conclusions The share of the population within most age groups receiving any illness and disability payment is relatively stable over time. To the extent that the number of recipients in any one programme is affected by changes across the range of illness and disability programmes, it is advisable to view increases in any one scheme in the broader context. Within the broad category of illness and disability payments, some have increased in absolute terms, such as Disability Allowance, while others (eg Illness Benefit over two years) have decreased. The increase in numbers on illness and disability payments has been driven by demographics, by some increases in age-related rate increases, and by an increased share of the working age population in the older age groups (corresponding to those with higher incidence rates). As a percentage of the working age population, the total number of recipients of illness and disability schemes has increased from 6.3% in 2012 to 6.8% in 2017. This is comparable to the total increase from 2011 in the share of the population with a disability as reported in Census 2016 (see Figure 1 above, and Table 30 in the appendix). Across all illness and disability programmes, almost 13,000 of the total change in recipients between 2012 and 2017 (22,271) is due to demography. The other factors examined here include estimates of the impact of policy changes and flows from schemes other than illness and disability. This analysis finds the increases in Disability Allowance are due to a number of factors, some of which can be expected to feed further increases in the coming years and some of which are unlikely to continue. Part of the increase in recent years is likely to be related to policy changes such as the two-year cap on Illness Benefit – adjusting the number of recipients in 2012 for demographic factors suggests an additional 15,000 people would be in receipt of it in 2017. Other payments not strictly categorised as illness or disability but sharing similar characteristics (eg PRETA) have decreased by a similar amount. Where payments such as PRETA or Illness Benefit over two years are no longer available, it is possible the increase in Disability Allowance is partly attributable to people who would otherwise be in receipt of PRETA or Illness Benefit. Any further probing of this hypothesis, or more precise estimates of the impact of these policy changes on other schemes, would require a sophisticated modelling exercise with access to medical claim data, which is beyond the scope of this analysis. A movement from jobseeker payments to Disability Allowance has been part of the increase in Disability Allowance recipients but seems unlikely to continue at the levels of recent years. The single largest group in the movement from jobseeker payments to Disability Allowance is those in the 40-59 age group with over three years duration of unemployment. Given the decrease in this cohort
Department of Employment Affairs and Social Protection

and in Live Register numbers, and the steady decrease in the persistence rate,
this is a declining pool of potential movement to Disability Allowance.

In contrast, the increase in recipients in the younger age cohorts is likely to
continue given the projected increase in the 0-14 cohort under most projection
scenarios. Furthermore, the number of DCA beneficiaries is increasing, and the
number of DCA beneficiaries aged 15 years shows higher year-on-year increases
than that of the population aged 15 years. Assuming the share of 15-year old
DCA beneficiaries who move to Disability Allowance remains between 40% and
55%, the inflow to Disability Allowance from DCA will increase.

Future analysis could usefully monitor the employment levels in this cohort,
particularly as the Comprehensive Employment Strategy, with its process of
systematic engagement, is rolled out. Additionally, enhancing existing
administrative data with ICD-10 codes has only recently begun and may prove
useful in analysing the characteristics shared by those in receipt of Disability
Allowance who work.7 Analysis of this kind will also be facilitated by an
enhancement in the DEASP’s longitudinal dataset of welfare, activation and
employment episodes. Given the improved focus of data collection and analysis
in schemes more orientated to the labour market (jobseekers, One-parent
Family Payments) in recent years, parallel improvements in data quality for
illness and disability schemes will complement measures to reconfigure those
schemes towards better employment outcomes.

7
 International Statistical Classification of Diseases and Related Health Problems, 10th revision: the World
Health Organisation classification of medical conditions.
You can also read