TERMINATION RATES AT THE EUROPEAN LEVEL JANUARY 2020 - 11 JUNE 2020 - BOR (20) 97 - BEREC
←
→
Page content transcription
If your browser does not render page correctly, please read the page content below
BoR (20) 97

Termination rates at the European level

            January 2020

              11 June 2020
BoR (20) 97
Table of contents
1. Executive Summary .................................................................................................... 2
2. Fixed networks – voice interconnection .................................................................. 6
2.1. Assumptions made for the benchmarking .................................................................. 6
2.2. FTR benchmark .............................................................................................................. 6
2.3. Short term evolution of fixed incumbents’ FTRs (from July 2019 to January
2020)......................................................................................................................................... 9
2.5. FTR regulatory models and symmetry overview ..................................................... 11
2.6. Number of lines and market shares ........................................................................... 13
3. Mobile networks – voice interconnection .............................................................. 14
3.1. Assumptions made for the benchmarking ................................................................ 14
3.2. Average MTR per country/participant: rates per voice minute (as of January
2020)....................................................................................................................................... 15
3.3. Average MTR per operator.......................................................................................... 18
3.4. Average MTR: Time series of simple average and weighted average at
European level ...................................................................................................................... 19
3.6. Regulatory model implemented and glide paths for MTRs .................................... 22
Annex .............................................................................................................................. 23
Annex 1 Fixed termination rates as of 1 January 2020 .................................................. 23
Annex 2 FTR regulatory cost accounting model implemented ...................................... 28
Annex 3 FTR symmetry ....................................................................................................... 30
Annex 4 Number of active fixed telephony lines and Market shares ........................... 32
Annex 5 Average MTR per operator as of 1 January 2020 ........................................... 37
Annex 6 Regulatory model implemented to calculate MTRs ......................................... 44
Annex 7 Abbreviations and Exchange rates .................................................................... 49
Annex 8 Glossary ................................................................................................................. 50
1BoR (20) 97
1. Executive Summary
This document is an updated version of the benchmark of fixed and mobile Termination
Rates (TRs) across Europe prepared by the BEREC Statistics and Indicators Working
Group in cooperation with the BEREC Office, and aims to offer a picture of the regulated
rates for fixed and mobile interconnection services in Europe. Fixed and mobile
termination services in Europe are subject to price regulation.
The European Commission Recommendation on relevant product and service markets
within the electronic communications sector susceptible to ex ante regulation in
accordance with Directive 2002/21/EC identifies:
• wholesale call termination on individual public telephone networks provided at a
fixed location as a relevant market susceptible of ex-ante regulation (market 1).
• wholesale voice call termination on individual mobile networks as a relevant
market susceptible of ex-ante regulation (market 2).
Because of the structure of these two markets, in general each network operator has a
SMP position (i.e. a monopoly) for termination on its own network and therefore its
termination rates are regulated.
The present overview of TRs is based upon the results of a request for information sent
to all NRAs in January 2020, referring – if not differently indicated – to data as of 1st
January 2020. It includes rates from the thirty eight (38) NRAs 1 that provided responses
to our request.
Comparing with the previous Termination Report, Kosovo * has joined this TR report as
a participant through the Regulatory Authority for Electronic and Postal Communications.
As of January 2020, the situation regarding TRs in Europe can briefly be described as
follows (see also Figures 1-2):
• The simple average of the lowest regulated FTR of incumbents at the European
level (all 38 countries/participants, Avg (S)) stands at 0.3118 cent per minute.
• The simple average of the lowest regulated FTR of European Union incumbents
(only EU member states, Avg EU27(S)) stands at 0.2002 cent per minute.
• The simple average of MTR at the European level (all 38 countries/participants,
Avg (S)) stands at 0.8442 cent per minute, whereas the weighted average 2 (Avg
(W)) at European level is estimated at 0.7400 cent per minute.
1 27 EU member states plus 4 EFTA states (Switzerland, Iceland, Norway and Liechtenstein), 5 economies
of the Western Balkans (Albania, Montenegro, North Macedonia, Serbia and Kosovo*), Turkey and the UK.
The United Kingdom withdrew from the European Union on 31 January 2020.
*
This designation is without prejudice to positions on status, and it is in line with UNSCR 1244 and the ICJ
Opinion on the Kosovo declaration of independence. This footnote applies throughout the report.
2 The weighted averages weight each country’s average rate with the share of the country’s subscribers
(total subscribers per country / total subscribers in all countries).
2BoR (20) 97
• The simple average of MTR at the EU level (only EU member states, (EU Avg
(S)) stands at 0.7251 cent per minute, whereas the weighted average at EU level
(EU Avg (W)) is estimated at 0.7725 cent per minute.
For non-Euro countries/participants, the average exchange rate in the last quarter of
2019 was used to calculate the FTRs and MTRs. The exchange rates used are reported
in Annex 7.
3BoR (20) 97
Overview of incumbents’ 3 lowest regulated fixed termination rates4 per country/participant – January
2020 (eurocent per minute of service)
Figure 1 FTRs
Source: NRAs, BEREC
4BoR (20) 97
MTR per country/participant – January 2020 (eurocent per minute of service)
Figure 2 MTRs
3,0000
2,6455
2,7909
2,5000
2,0000
1,2167
€-cent/min
1,1460
1,1400
1,0547
1,0007
0,9900
1,5000
0,9696
0,9460
0,9400
0,9024
0,9000
0,8900
0,8900
0,8868
0,8442
0,8180
0,8049
0,7800
0,7725
0,7600
0,7600
0,7600
0,7400
0,7400
0,7251
0,7158
0,6993
0,6400
0,6049
0,5810
0,5565
0,5500
0,5152
1,0000 0,5153
0,4133
0,4045
0,4000
0,3171
0,2657
0,1700
0,5000
0,0000
Source: NRAs, BEREC
3
Due to the large number of incumbents present in Finland a weighted average is included for comparison.
4
The lowest regulated rate of the incumbent. In case the operator uses only one rate, it is considered as a single rate.
5BoR (20) 97
2. Fixed networks – voice interconnection
The regulation of FTRs has been harmonized by the Commission Recommendation of 7 May
2009 on the Regulatory Treatment of Fixed and Mobile Termination Rates in the EU
(2009/396/EC). However, some differences can be found across the national regulatory
regimes:
1) In some cases (CH), the termination rate is a two-part tariff, i.e. composed of a variable
part (to be paid for each minute of a call) plus a set-up or fixed part (to be paid for
each call). In other cases, the termination rate consist only of the variable part.
2) Interconnection services in fixed networks are provided at different levels in the
hierarchy of the incumbents’ networks, called layers. Even though some peculiarities
in specific countries/participants are present, in general three main layers for
interconnection are defined:
i) layer 1 5, or local level service provision,
ii) layer 2, or regional level service provision (single transit), and
iii) layer 3, national level service provision (or double transit).
Due to increasing symmetry and decreasing relevance of layers, the report presents a ranking
of the lowest regulated rates together with the weighted average of peak and off-peak rates in
the table of Annex 1.
The ‘’lowest regulated rate’’ refers to the lowest of the rates of an operator. For operators that
have more than one regulated rate, these are ranked in ascending order (first lowest, second
lowest, etc.). If there is a single regulated rate, it is considered as ‘’the lowest regulated rate’’.
2.1. Assumptions made for the benchmarking
The following assumptions have been made in order to make tariffs comparable:
• A 3-minute average call duration has been assumed, using the standard formula: (fixed
set-up charge + price per minute*3)/3.
• Nominal tariffs are reported only when the NRA has set the maximum price per minute
that operators may charge each other.
• For those countries/participants which have not set a single tariff and which apply
distinct rates for the peak/off-peak period (DK, HR and PL), an average price has been
calculated taking into account the traffic distribution between peak and off-peak time.
Where this distribution has not been made available, a 50/50 distribution has been
assumed.
2.2. FTR benchmark
Annex 1 presents the FTRs of operators listed by country/participant. For each
country/participant, the respective NRA provided information on the incumbent and some
5 Layer 1 is defined as the closest possible interconnection level to the network termination point.
6BoR (20) 97
alternative or cable operators offering interconnection services. In the last column, the
weighted average of peak/off-peak prices is provided.
The lowest regulated rate (LRR) is the rate applied by the operator at the level of
interconnection that is closest to the network termination point. The second and third lowest
regulated rates apply only to operators that have more than one regulated rate/interconnection
layer.
In five countries (out of 38 countries/participants) operators maintain interconnection services
in fixed networks at only two different levels in the hierarchy of the incumbents’ networks. In
three countries operators have three layers of interconnection.
For more information on the lowest rates of incumbents, please refer to Figure 1 and Annex
1.
Figure 3 Incumbents’ second lowest regulated fixed termination rate per country (eurocent per
minute)
0,6306
0,5680
0,5701
0,2666
0,0573
SE TR PL RS CH
Source: NRAs, BEREC
7BoR (20) 97
Figure 4 Incumbents’ third lowest regulated fixed termination rate per country (eurocent per
minute)
0,8362
0,6381
0,3493
TR RS PL
Source: NRAs, BEREC
8BoR (20) 97
2.3. Short term evolution of fixed incumbents’ FTRs (from July 2019 to January 2020)
Figure 5 Incumbents’ lowest regulated rate per country 6,7 (eurocent per minute)
Source: NRAs, BEREC
6
Due to the large number of incumbents present in Finland a weighted average of all operators have been used for both periods. The variation shown in the graph is due to
the change in numbers of lines, since the actual rates have remained unchanged.
7
Calculation for Iceland is based on data from 1 January 2019 and 2020.
9BoR (20) 97
The above chart shows the percentage change in the lowest regulated fixed termination rate
of incumbents between July 2019 and January 2020. For easier comparison, rates are
presented in eurocent. The reported changes in FTRs in non-Euro countries (Figures 5, 6 and
7) is partially due to currency exchange rate variations. In cases where there is no variation in
termination rates in national currencies, the percntage change is only due to the variation in
the exchange rate. The exchange rates used are reported in Annex 7.
LRR Changes in FTRs in non-euro countries:
Albania, Croatia, Denmark, Iceland, Sweden, Switzerland and the UK reported changes in
their FTRs in their national currencies. The rates (in eurocents) decreased in Albania (by
28.89%), Sweden (by 0.31%) and Croatia (by 5.23%). Denmark reported an increase of 4.47%
in January 2020 compared to July 2019 and Switzerland notified a rise of 5,09% (Figure 5).
Figure 6 Incumbents’ second lowest regulated rate per country (eurocent per minute)
Source: NRAs, BEREC
2nd LRR Changes in FTRs in non-euro countries:
There have been substantial changes in the 2nd LRR of the FTRs reported by those countries
where the national currency is not euro, except for Switzerland and Sweden. The Swedish 2nd
LRR of the FTR has a modest increase of 1.35%.
10BoR (20) 97
Figure 7 Incumbents’ third lowest regulated rate per country (eurocent per minute)
Source: NRAs, BEREC
3rd LRR Changes in FTRs in non-euro countries/participants:
There have been no changes in the 3rd LRR of the FTRs reported by those
countries/participants where the national currency is not euro.
2.5. FTR regulatory models and symmetry overview
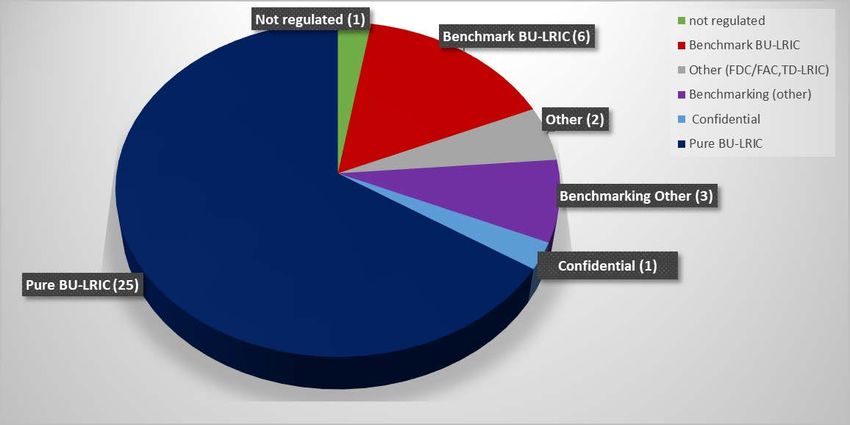
25 NRAs use Pure BU LRIC models to set FTRs, 8 NRAs use Benchmarking approaches and
FDC/FAC is used by 3 NRAs. Further, 1 NRA uses a BU LRAIC+ model and 1 NRA reported
its cost model as confidential (Figure 8).
11BoR (20) 97
Figure 8 Cost accounting models for FTR used by NRAs
Not regulated (1)
Benchmark BU-LRIC
(5)
Other (3)
Benchmarking (3)
Pure BU-LRIC (25) Confidential (1)
Source: NRAs, BEREC
For more information see Annex 2.
According to the Commission Recommendation of 7 May 2009 on the Regulatory Treatment
of Fixed and Mobile Termination Rates in the EU (2009/396/EC), NRAs should set termination
rates based on the costs incurred by an efficient operator. This implies that they should be
symmetric. According to BEREC’s information, 25 NRAs use Pure BU-LRIC models and 5
NRAs use benchmarking based on Pure BU LRIC.
Furthermore, in most of the respondent countries/participants (33), FTRs are symmetric
across all operators. 4 NRAs reported partial symmetry in only 1 NRA reported non-symetric
rates. In one case, there is only one operator in the country, therefore, symmetry is not
applicable.
Figure 9 FTRs symmetry
Partially (4)
No (1)
Symmetric (33)
Source: NRAs, BEREC
12BoR (20) 97
For more information see Annex 3.
2.6. Number of lines and market shares
In Annex 4 the number of active fixed telephony lines in the retail market is provided for each
operator included in the report. For a number of countries this information is confidential.
13BoR (20) 97
3. Mobile networks – voice interconnection
This section benchmarks the mobile termination rates (MTR) as of 1 January 2020 and its
recent evolution. The purpose of this comparison is to provide an indication of the level of
MTRs across the countries/participants, their variations and the cost models adopted for
setting MTRs. Moreover, this benchmarking exercise includes a section devoted to the future
evolution of MTRs 8.
The overview of MTRs is based on the replies of a request for information sent to all NRAs in
January 2020. It includes data from thirty-eight (38) NRAs that provided responses.
3.1. Assumptions made for the benchmarking
For the present benchmarking exercise, the following assumptions have been made in order
to make tariffs comparable 9:
- Operators with a market share below 1.5% have been excluded from the calculation of the
national MTR average.
- Only nominal tariffs are represented in the report, defining them as “the price (in cent per
minute) set by the regulator that represents the maximum price per minute which operators
may charge each other (without any adjustment for purchasing power parity or real effects
– inflation).”
- Four averages have been calculated: a simple average and a weighted average, each at
the European level (including all 38 countries/participants reporting data) and at EU level
(including only the 27 EU member states). The weighted averages weight each country’s
average rate with the share of the country’s subscribers (total subscribers per country /
total subscribers in all countries).
- Regarding the number of subscribers, it should be noted that different estimation methods
are used among European countries (especially in the case of pre-paid consumers).
Mobile subscribers (active SIM cards) mean both 2G, 3G and 4G subscribers of a Mobile
Network Operator or Mobile Virtual Network Operators. An active subscriber of mobile
telephony means a subscriber of post-paid mobile telephony who has a valid contract,
and/or a pre-paid subscriber who has made or received a call, sent an SMS or MMS or
used data services at least once in the last 3 months. M2M, M2P and data-only SIMs cards
should be excluded. 10
Regarding the short-term MTR evolution (from July 2019 to January 2020), some variation
may be a consequence of any of the following reasons:
i. Modifications in the tariff structure (for instance, disappearance of the set-up
charge or initial period);
ii. Currency exchange rate variations in non-Euro countries 11;
8 See Annex 6
9 Generally speaking, these assumptions may create margins of error in the present comparison, making it difficult
to draw valid conclusions for policy purposes.
10 Please note that due to a specification of the definition of mobile subscribers the number of total subscribers in
some countries changed significantly compared to the previous reports.
11 This only affects short-term MTR evolution (figure 12) because the percentage of tariff variation in each country
(figure 13) has been calculated by comparing rates expressed in terms of the national currency.
14BoR (20) 97
iii. Changes in operators’ market shares (e.g. due to a change in methodology in the
calculation of subscriber rates) may have an effect on the average MTR for an
individual country;
iv. Inclusion of new operators that were not present in the previous benchmarks.
3.2. Average MTR per country/participant: rates per voice minute
(as of January 2020)
Table 1
Average MTR per
Country/Participant country/Participant
(eurocents/min)
AL 0.9024
AT 0.8049
BE 0.9900
BG 0.7158
CH 2.7909
CY 0.1700
CZ 0.9696
DE 0.9000
DK 0.5153
EE 0.7800
EL 0.9460
ES 0.6400
FI 0.8900
FR 0.7400
HR 0.6049
HU 0.5152
IE 0.5500
IS 0.6993
IT 0.7600
LI 2.6455
LT 0.9400
LU 0.8900
LV 0.8868
ME 0.7600
MK 1.0547
MT 0.4045
NL 0.5810
NO 0.3171
PL 1.0007
PT 0.4000
RO 0.7600
15BoR (20) 97
Average MTR per
Country/Participant country/Participant
(eurocents/min)
RS 1.2167
SE 0.2657
SI 1.1400
SK 0.8180
XK* 1.1460
TR 0.4133
UK 0.5565
Avg (S) 0.8442
Avg (W) 0.7400
EU Avg (S) 0.7251
EU Avg (W) 0.7725
Figures 10 and 11 show the short-term variations of MTRs in Euro and in national currency.
These two figures illustrate the effect of the exchange rate on the short-term evolution.
16BoR (20) 97
Variation of MTRs per country (from July 2019 to January 2020)
Figure 10 Variation in eurocent and percentage 12
Source: NRAs, BEREC
12
Calculation for Iceland is based on data from 1 January 2019 and 2020.
17BoR (20) 97
Variation of average MTRs in national currency other than euro per country (from July
2019 to January 2020)
Figure 11 Variation in national currency (%)
0%
-4,26% -0,06% -1,03%
-10% -1,29%
-9,02% -7,46%
-20%
-30% -25,58%
-40%
-50%
-51,54%
-60%
AL CH HR NO RO SE TR UK
Source: NRAs, BEREC
Most countries did not experience a real short-term variation of MTRs and therefore are not shown in
figure 11.
3.3. Average MTR per operator
There are several countries where the number of subscribers and/or market shares have been declared
as confidential data and thus they are not published in this report. Nevertheless, market shares have
been taken into account for the average MTR calculations.
For further details see Annex 5.
18BoR (20) 97
3.4. Average MTR: Time series of simple average and weighted average at European level
Figure 12 Evolution of simple and weighted averages
16,00
14,00
12,00
10,00
€-cent/min
8,00
6,00
4,00
2,00
0,00
Jan July Jan July Jan July Jan July Jan July Jan July Jan July Jan July Jan Jul Jan Jul Jan Jul Jan Jul Jan Jul Jan Jul Jan Jul Jan Jul Jan
2004 2004 2005 2005 2006 2006 2007 2007 2008 2008 2009 2009 2010 2010 2011 2011 2012 2012 2013 2013 2014 2014 2015 2015 2016 2016 2017 2017 2018 2018 2019 2019 2020
Avg (S) 14,0 14,0 13,0 12,3 11,4 11,0 10,4 10,0 9,02 8,70 7,83 7,00 6,50 6,07 4,91 4,45 4,03 3,57 2,58 2,21 1,97 1,69 1,55 1,52 1,41 1,27 1,10 1,06 0,97 0,94 0,88 0,88 0,84
Avg (W) 14,4 14,4 13,3 13,2 11,3 11,0 10,4 9,71 8,81 8,74 7,92 6,21 6,29 5,65 4,46 3,74 3,50 2,76 1,90 1,46 1,32 1,23 1,23 1,22 1,17 1,14 0,97 0,93 0,89 0,85 0,78 0,78 0,74
Source: NRAs, BEREC
Note to figure 12: Averages are based on nominal rates per minute of service. The number of countries/participants and operators considered has increased over the
years, thus affecting the average slightly. Moreover, the weighted average does not take into account countries/participants not providing the total number of subscribers
and those that could have changed over the years. Considering these caveats, the graph shows the general trend.
19BoR (20) 97
Figures 13 and 14 show the cumulative decline of the simple and the weighted average of European
MTRs since 2004.
Considering the number of countries/participants and operators included over the years, the simple
average MTRs dropped by 94% since January 2004, from 14.08 eurocent to 0.84 eurocents in January
2020.
Figure 13 European MTRs simple average and cumulative decline
16 100%
14.08
90%
94,00%
14
93,74%
93,08%
93,72%
92,50%
93,32%
89,99%
85,98%
80%
12
70%
10
65,13%
60%
% decrease
€-cent/min
7,83
8 50%
40%
6 4,91
44.36%
30%
4
20%
1,97 1,41 1,06
0,97
2 0,84
0,94 0,88 0,88 10%
0 0%
Jan Jan Jan Jan Jan Jul Jan Jul Jan Jul Jan
2004 2009 2011 2014 2016 2017 2018 2018 2019 2019 2020
Cumulative % A(s) decrease since 2004 Avg (S)
Source: NRAs, BEREC
20BoR (20) 97
Figure 14 European MTRs weighted average and cumulative decline
The weighted average of European MTRs has declined even more, from 14.47 eurocent to 0.74
eurocent in the same period from January 2004.
16 100%
14,47
90%
94,89%
94,60%
90,86%
14
94,58%
93,83%
93,60%
91,91%
94,15%
80%
12
70%
69,18%
10
% decrease
60%
€-cent/min
7,92
8 50%
40%
45.24%
6
4,46 30%
4
20%
0,93 0,89
2 1,32 1,17
0,85 0,78 0,78 0,74 10%
0 0%
Jan Jan Jan Jan Jan Jul Jan Jul Jan Jul Jan
2004 2009 2011 2014 2016 2017 2018 2018 2019 2019 2020
Cumulative % A(w) decrease since 2004 Avg (W)
Source: NRAs, BEREC
21BoR (20) 97
3.6. Regulatory model implemented and glide paths for MTRs
In the majority of countries BU LRIC models are used to calculate the MTRs. However, a significant
number of NRAs base their price decision on benchmarking. In one country (Switzerland) MTRs are
not regulated and one NRA reported its model to be confidential.
Figure 15 Cost accounting models used by NRAs
Source: NRAs, BEREC
For further details, see Annex 6 .
22BoR (20) 97
Annex
Annex 1 Fixed termination rates as of 1 January 2020
13
Table 2
Country Lowest
Operator WA in cents
/Participant Regulated Rate
Albtelecom Single-rate 0.5749
AL
Abcom Single-rate 0.5749
Albanian Satellite Communications Single-rate 0.5749
Rest of operators Single-rate 0.5749
A1 Telekom Austria Single-rate 0.1110
AT Operator 2 Single-rate 0.1110
Operator 3 Single-rate 0.1110
Operator 4 Single-rate 0.1110
Operator 5 Single-rate 0.1110
Operator 6 Single-rate 0.1110
Rest of operators Single-rate 0.1110
BE Proximus Single-rate 0.1160
Rest of operators Single-rate 0.1160
Bulgarian Telecommunication Company
BG Single-rate 0.0716
(BTC)
A1 Bulgaria Single-rate 0.0716
Telenor Bulgaria Single-rate 0.0716
CH Swisscom LRR 0.5235
Swisscom 2nd LRR 0.6307
Cyta Single-rate 0.0440
CY
Primetel Single-rate 0.0440
Cablenet Single-rate 0.0440
EPIC Single-rate 0.0440
CETIN a.s. Single-rate 0.1290
CZ
UPC Česká republika, s.r.o. Single-rate 0.1290
Vodafone Czech Republic a.s. Single-rate 0.1290
T-Mobile Czech Republic a.s. Single-rate 0.1290
IPEX a.s. Single-rate 0.1290
Nej.cz.s.r.o. Single-rate 0.1290
DE Telekom Deutschland GmbH Single-rate 0.0600
DK TDC Single-rate 0.0574
Telia Single-rate 0.0574
Telenor Single-rate 0.0574
EE Telia Eesti AS Single-rate 0.0850
STV Single-rate 0.0850
Elisa Single-rate 0.0850
13
For a Decimal separator in the tables is used comma to separate whole numbers from decimals and a point is used to
indicate thousands in whole numbers. More information: http://publications.europa.eu/code/en/en-360500.htm
23BoR (20) 97
Country Lowest
Operator WA in cents
/Participant Regulated Rate
OTE Single-rate 0.0545
EL
FORTHNET Single-rate 0.0545
VODAFONE Single-rate 0.0545
WIND Single-rate 0.0545
Telefónica de España Single-rate 0.0593
ES Vodafone - Ono Single-rate 0.0593
Orange Single-rate 0.0593
Grupo MASMOVIL Single-rate 0.0593
Euskaltel Single-rate 0.0593
Rest of operators Single-rate 0.0593
DNA Oyj Single-rate 2.8000
FI
Elisa Oyj Single-rate 2.8000
Telia Finland Oyj Single-rate 2.8000
Rest of operators Single-rate 3.2000
Weighted average of all operators Average 2.8827
FR All operators Single-rate 0.0770
HR HT Single-rate 0.0950
OPTIMA Single-rate 0.1001
A1 Single-rate 0.0983
Magyar Telekom Single-rate 0.0783
HU
Digi Single-rate 0.0783
Vodafone Single-rate 0.0783
Rest of operators Single-rate 0.0783
Eir Single-rate 0.0570
IE
Virgin Media Single-rate 0.0570
Vodafone Single-rate 0.0570
Rest of operators Single-rate 0.0570
IS* Siminn Single-rate 0.0874
Vodafone Single-rate 0.0874
Telecom Italia Single-rate 0.0410
IT Vodafone Single-rate 0.0410
Wind Tre Single-rate 0.0410
Fastweb Single-rate 0.0410
Linkem Single-rate 0.0410
Tiscali Single-rate 0.0410
Rest of operators Single-rate 0.0410
Telia Lietuva, AB Single-rate 0.0900
LT
UAB „CSC Telecom“ Single-rate 0.0900
AB Lietuvos gelezinkeliai Single-rate 0.0900
Rest of operators Single-rate 0.0900
LI Telecom Liechtenstein AG Single-rate 2.6455
24BoR (20) 97
Country Lowest
Operator WA in cents
/Participant Regulated Rate
Backbone Solutions AG Single-rate 2.6455
POST Telecom Single-rate 0.1380
LU
Proximus S.A. Single-rate 0.1380
Luxembourg Online S.A. Single-rate 0.1380
Rest of operators Single-rate 0.1380
Tet (ex. Lattelecom) Single-rate 0.0956
LV
Latvijas Mobilais Telefons Single-rate 0.0956
CSC Telecom Single-rate 0.0956
D-COM Single-rate 0.0956
Rest of operators Single-rate 0.0956
Crnogorski Telekom Single-rate 0.5800
ME
Mtel Single-rate 0.5800
Telenor Single-rate 0.5800
Telemach Single-rate 0.5800
Go plc Single-rate 0.0443
MT
Melita Ltd Single-rate 0.0443
Vodafone Malta Ltd Single-rate 0.0443
Ozone Single-rate 0.0443
Vanilla Telecoms Ltd Single-rate 0.0443
Makedonski Telekom Single-rate 0.5858
MK*
One.VIP Single-rate 0.5858
Robi Single-rate 0.5858
Neotel Single-rate 0.5858
NL KPN Single-rate 0.1400
Ziggo Single-rate 0.1400
T-Mobile/Tele2 Single-rate 0.1400
Telenor Single-rate 0.0495
NO
Telia Single-rate 0.0495
Altibox Single-rate 0.0495
Nextgentel Single-rate 0.0495
Rest of operators Single-rate 0.0495
Orange Polska S.A. Single-rate 0.4782
PL
Orange Polska S.A. 2nd LRR 0.5680
Orange Polska S.A. 3rd LRR 0.8362
UPC Polska Sp. z o.o. 2nd LRR 0.4782
Netia S.A. Single-rate 0.4782
Multimedia Polska S.A. 2nd LRR 0.5073
MEO Single-rate 0.0470
PT
NOS Group Single-rate 0.0470
Vodafone Single-rate 0.0470
ONI/NOWO Single-rate 0.0470
Rest of operators Single-rate 0.0470
RO Telekom RC S.A. Single-rate 0.1400
25BoR (20) 97
Country Lowest
Operator WA in cents
/Participant Regulated Rate
S.C. RCS&RDS S.A. Single-rate 0.1400
S.C. UPC Romania S.R.L. Single-rate 0.1400
S.C. VODAFONE ROMANIA S.A. Single-rate 0.1400
Telekom Srbija LRR 0.4850
RS Telekom Srbija 2nd LRR 0.5701
Telekom Srbija 3rd LRR 0.6381
Orion Single-rate 0.5275
Telenor Single-rate 0.5275
SBB Single-rate 0.5275
Rest of operators Single-rate 0.5275
Telia Company AB LRR 0.0272
SE Telia Company AB 2nd LRR 0.0573
Com Hem AB LRR 0.0272
Tele2 Sverige AB LRR 0.0272
Telenor Sverige AB LRR 0.0272
Telavox AB LRR 0.0272
Rest of operators LRR 0.0272
Telekom Slovenije Single-rate 0.0876
SI Telemach Single-rate 0.0876
T-2 Single-rate 0.0876
A1 Slovenija Single-rate 0.0876
Rest of operators Single-rate 0.0876
Slovak Telekom a.s. Single-rate 0.0976
SK
Orange Slovensko a.s. Single-rate 0.0976
UPC Broadband Slovakia s.r.o. Single-rate 0.0976
SWAN, a.s. Single-rate 0.0976
Türk Telekom LRR 0.2167
TR Türk Telekom 2nd LRR 0.2666
Türk Telekom 3rd LRR 0.3493
TTNet Single-rate 0.4989
Türksat Single-rate 0.4989
Superonline Single-rate 0.4989
Rest of operators Single-rate 0.4989
Telekom of Kosovo* SH.A. Single-rate 0.6600
XK*
IPKO TELECOMMUNICATIONS L.L.C. Single-rate 0.6600
KUJTESA.NET SH.P.K. Single-rate 0.6600
mts d.o.o. Single-rate 0.6600
BT Single-rate 0.0357
UK
TalkTalk Single-rate 0.0357
Sky Single-rate 0.0357
Virgin Media Single-rate 0.0357
Vodafone Single-rate 0.0357
26BoR (20) 97
Notes to table 2:
Incumbents are indicated first in the table.
AL: Market analysis and SMP decisions for fixed call termination for the incumbent and 67 other fixed
network operators on 1.10.2018 imposed the regulation of FTRs through benchmarking methodology
and a glide path (1.12.2018 AKEP's decision): symmetrical FTRs starting from 1.01.2016 and only one
single layer FTR to be applied from the incumbent and the other FNOs; the FTR (one single rate) to be
applied from 01/01/2018 was calculated by AKEP as the simple average of FTRs in BEREC countries
with one layer interconnection as of 01/07/2017.
BE: The second lowest regulated rate is identical to the 1st LRR in Belgium.
BG: CRC Decision 550 from 20 October 2016 approved cost-oriented fixed terminating rates based on
Pure Bu-LRIC model as follows:
from 01.11.2016 - 0,0015 BGN/minute
from 01.01.2017 - 0,0015 BGN/minute
from 01.01.2018 - 0,0015 BGN/minute
from 01.01.2019 - 0,0014 BGN/minute
from 01.01.2020 - 0,0014 BGN/minute.
CH: The prices indicated are taken from the Swisscom price manual for TDM-Interconnection. For IP-
Interconnection the same prices as the ones for regional TDM-interconnection (LRR) apply.
Furthermore, there exists a "clause of reciprocity", meaning that the tariffs of other operators have to
be same as the ones of Swisscom.
CY: OCECPR has revised the FTR in May 2020. The new FTR rate based on the BU-LRIC Model latest
results was applied retroactively from 01.01.2020. No peak and off-peak separation of rates.
DE: BNetzA notified in May 2019 the following glide path for fixed termination rates of incumbent
Telekom Deutschland and 67 alternative network operators: 0.08 €cents/min in 2019; 0.06 €cents/min
in 2020; 0.05 €cents/min in 2021; 0.03 €cents/min in 2022. The tariffs for 2021 and 2022 only apply as
long as the tariffs are not yet in force according to the European Electronic Communications Code
(EECC) Article 75.
IE: ComReg Decision D11/19 (document 19/48) set fixed terminations rates for all SMP FSP with effect
from August 2019. Prior to this Decision, the maximum regulated FTR was 0.072 euro cent per minute.
In order to reduce the possibility of FTRs being lowered pursuant to ComReg’s Decision and then raised
by operators when the Eurorate FTRs come into effect, and also in order to set maximum FTRs in a
manner consistent with the approach to setting maximum MTRs, ComReg decided to implement FTRs
using a glide path. Based on the glide path, the FTR rate fell to 0.063 euro cent per minute in August
2019 and then to 0.057 euro cent per minute in January 2020 and is expected to fall to 0.051 euro cent
per minute in January 2021. These rates are expected to remain in place until replaced by the Euro
Rates.
IT: Last market analysis review was concluded in 2016 and defined termination rates until 2019. The
new market analysis review is ongoing and in the meantime operators are still applying termination
rates of 2019. Therefore, AGCOM has not yet calculated rates for 2020.
LI: The operator Backbone Solutions AG has just entered the market in 2019.
TR: In Turkey, there is no differentiation in fixed termination rates such as peak and off-peak.
27BoR (20) 97
Annex 2 FTR regulatory cost accounting model implemented
Table 3
Country
Cost Accounting Model
/Participant
AL Benchmark (Other)
AT Pure BU LRIC
BE Pure BU LRIC
BG Pure BU LRIC
CH BU LRAIC +
CY Pure BU LRIC
CZ Pure BU LRIC
DE Pure BU LRIC
DK Pure BU LRIC
EE Benchmark (Pure BU LRIC)
EL Pure BU LRIC
ES Pure BU LRIC
FI FDC/FAC
FR Pure BU LRIC
HR Pure BU LRIC
HU Pure BU LRIC
IE Pure BU LRIC
IS Benchmark (Pure BU LRIC)
IT Pure BU LRIC
LI FDC/FAC
Benchmarking (Pure BU
LT
LRIC)
LU Pure BU LRIC
LV Benchmark (Pure BU LRIC)
ME Other (TD LRIC)
MT Pure BU LRIC
NMK Pure BU LRIC
NL Pure BU LRIC
NO Pure BU LRIC
PL TD-FDC/FAC
PT Pure BU LRIC
RO Pure BU LRIC
RS Other (TDC-FAC/FDC-CCA)
SE Pure BU LRIC
SI Pure BU LRIC
SK Pure BU LRIC
TR Confidential
XK* Benchmarking (Other)
28BoR (20) 97
Country
Cost Accounting Model
/Participant
UK Pure BU LRIC
Notes to table 3:
CH: Source of the Swisscom-Tariffs:
https://www.swisscom.ch/dam/swisscom/de/ws/documents/D_IC-Dokumente/de_handbuch-
preiseicv1-21.pdf, p.11.
DE: The calculation of rates is based on a pure LRIC cost model. The tariffs for 2021 and 2022 only
apply as long as the tariffs are not yet in force according to the European Electronic Communications
Code (EECC) Artikel 75.
EL: A Pure BU LRIC model applies since 28.5.2014 as a result of EETT’s decision 714/09/10-4-2014
(Official Gazette 1049/28-04-2014). During Q4 2019 EETT launched a national consultation regarding
a new market analysis for fixed termination services.
FI: In Finland there are no (ex ante) price caps on FTRs. FNOs have a cost-oriented pricing obligation.
The obligation is monitored ex post.
IE: The termination rates are based on a Pure BU-LRIC model however a glide path was chosen to
implement them to minimise the possibility of the termination rates being lower than the Eurorates when
they come into force.
LI: FTR regulation is not finalizedCurrent FTR cap was decided in 2007. Market analysis and remedies
M3 decided in 2010. New FTR decision expected in 2020/2021, based on benchmarking. (EFTA
Surveillance Authority Recommendation of 13th April 2011 on the Regulatory Treatment of Fixed and
Mobile Termination Rates in the EFTA States).
LT: Rates of termination on alternative fixed networks should not be higher than rates applied by Telia
Lietuva, AB at particular network level.
No differentiation Peak/Off-peak".
LU: Règlement16/209/ILR du 28 novembre 2016 portant sur la fixation des plafonds tarifaires pour les
prestations de la terminaison d’appel sur divers réseaux téléphoniques publics individuels en position
déterminée (Marché 1/2014)
ME: Current FTR are regulated according to the TD LRIC costing methodology. Incumbent operator
Crnogorski Telekom had developed TD LRIC cost model, and NRA approved results every year. Other
SMP operators apply symmetrical FTR.
SE: A new Pure BU LRIC model was adopted by PTS in September 2018; prices applicable from
01.10.2018.
SI: On 20.12.2019 new decision was issued for market 1 with new value of FTR which will be in use
from 1.2.2020 on and its value is 0,000717 EUR/min.
SK: Ru has not used any glide path.
UK: Rates have been set on a BU LRIC basis since 01.01.2014.
29BoR (20) 97
Annex 3 FTR symmetry
The following table emphasises the level of symmetry among the operators when interconnection in
fixed networks is offered. The information below is directly reported by each NRA explaining its
particular situation.
Table 4
Country
Symmetry Comments
/Participant
AL Yes
AT Yes Full symmetry.
BE Yes
BG Yes
Symmetry is ensured on the basis of geographical coverage from a certain
point of interconnection (e.g. regional termination is priced the same both ways
CH Yes
regardless of actual network hierarchy). Symmetry is evaluated on the basis
of the average FTR (i.e. pricing flexibility is left for operators).
CY Yes Yes, the same regulated terminations rates apply for all providers.
CZ Yes
Tariffs are symmetrical because of contractual agreements between
DE Yes incumbent Telekom Deutschland and alternative fixed network operators to
charge reciprocal tariffs
Same FTR apply to all price regulated operators, cf. market decisions as of
DK Yes
18.12.2013.
EE Yes Same FTR applies for 13 operators with SMP.
EL Yes
ES Yes
The biggest operators (DNA, Elisa and Telia) have the same FTRs (2,8 cents),
FI Partially
smaller operators have a little bit higher FTRs (3,2 cents).
FR Yes
Symmetry in fixed network is prescribed for all operators as of the 1st January
HR Yes
2013
HU Yes
FTRs are symmetrical based on interconnection at primary exchange level for
all those operators found by market review to have SMP in fixed voice call
termination. Interconnection at higher levels in the network could result in
transit fees. Transit fees are not regulated.Following a consultation process,
ComReg identified 22 Fixed Service Providers as having SMP (see ComReg
IE Yes
Decision document 19/47 D10/19, Section 6.2.15). A price control obligation
of cost orientation was imposed on such.
Some operators have not, up to now been designated with SMP and so their
FTR rate has not been regulated. ComReg has recently issued a consultation
(i.e. ComReg document 20/19) regarding this issue (amongst others).
IS Yes
IT Yes
Rates between fixed net operators are symmetrical.
LI Yes
FTRs of all fixed operators having SMP, are symmetrical, i.e. FTRs are the
LT Yes same despite number of customers, difference in network topologies, level of
interconnection, etc.
30BoR (20) 97
Country
Symmetry Comments
/Participant
A maximal price cap is defined by the regulation, but operators may implement
LU Partially
the solution in their own way.
LV Yes
ME Yes
NMK Yes Based on incumbent operators' rates.
Due to national characteristics interconnection is at layer 1. The FTR charge
MT Yes applicable to all those operators having an SMP in the wholesale fixed
termination market is on a symmetrical basis.
NL Yes
NO Yes
PL Partially
Prices applied by operators with SMP in the wholesale markets for call
PT Yes termination on the public telephone network at a fixed location must be
symmetrical.
RO Yes Symmetric FTRs irrespective of interconnection level.
Operators have different topology and different number of the levels of
interconnection. Telekom Srbija have 3 levels of interconnection. Other
RS Partially
operators have 1 level of interconnection. As of 1st February 2020 the FTRs
for all 3 levels are equal to single rate of other operators.
SE Yes
SI Yes Based on national coverage of layer.
SK Yes The FTR is non-discriminatory for all operators without any exception.
All operators have flat hierarchy of the network and all of them are
XK* Yes
interconnected at central level.
TR No
UK Yes
31BoR (20) 97
Annex 4 Number of active fixed telephony lines and Market shares
Table 5
Country Number of Total number of Market
Operator
/Participant lines lines share
Albtelecom 176,653 72.76%
Abcom 11,409 4.70%
AL 242,791
Albanian Satellite Communications 35,558 14.65%
Rest of operators 19,171 7.90%
A1 Telekom Austria 1,826,807 58.71%
Operator 2 561,631 18.05%
Operator 3 406,296 13.06%
AT Operator 4 67,133 3,111,530 2.16%
Operator 5 61,027 1.96%
Operator 6 32,310 1.04%
Rest of operators 156,326 5.02%
Proximus 2,297,141 58.45%
BE 3,930,410
Rest of operators 1,633,269 41.55%
Bulgarian Telecommunication
Confidential Confidential
Company
BG A1 Bulgaria Confidential 1,054,894 Confidential
Telenor Bulgaria Confidential Confidential
Rest of operators 65.825 6.24%
CH Swisscom N/A N/A
Cyta 203,319 63.39%
Primetel 46,545 14.51%
CY 320,756
Cablenet 46,225 14.41%
EPIC 24,667 7.69%
CETIN a.s. Confidential 37.03%
UPC Česká republika, s.r.o. Confidential 13.58%
Vodafone Czech Republic a.s. Confidential 5.08%
CZ Confidential
T-Mobile Czech Republic a.s. Confidential 6.99%
IPEX a.s. Confidential 3.91%
Nej.cz s.r.o. Confidential 2.74%
Rest of operators Confidential 30.66%
Telekom Deutschland GmbH 17,760,000 46.47%
DE 38,220,000
Rest of operators 20,460,000 53.53%
TDC 363,578 77.0%
Telia 58,463 12.4%
DK 472,463
Telenor 31,217 6.6%
Rest of operators 19,205 4.1%
32BoR (20) 97
Country Number of Total number of Market
Operator
/Participant lines lines share
Telia 273,207 85.9%
Elisa 10,566 3.3%
EE 317,975
Elisa Teleteenused 23,220 7.3%
STV 10,982 3.5%
OTE 2,658,870 56.5%
FORTHNET Confidential Confidential
EL 4,706,366
VODAFONE Confidential Confidential
WIND Confidential Confidential
Telefónica de España 8,787,959 45.04%
Vodafone - ONO 4,383,606 22.47%
Orange 3,985,854 20.43%
ES 19,511,193
Grupo MASMOVIL 1289333 6.61%
Euskaltel 773,628 3.97%
Rest of operators 290,813 1.49%
DNA Oyj Confidential Confidential
Elisa Oyj Confidential Confidential
FI 266,000
Telia Finland Oyj Confidential Confidential
Rest of operators Confidential Confidential
FR N/A N/A N/A
HT Confidential Confidential
OPTIMA Confidential Confidential
HR 1,335,562
A1 Confidential Confidential
Rest of operators Confidential Confidential
Magyar Telekom 1,470,149 48.22%
DIGI 677,942 22.23%
HU 3,049,000
Vodafone 650,658 21.34%
Rest of operators 250,251 8.21%
Eir 543,406 43.55%
Virgin Media 335,459 26.66%
IE Vodafone 194,291 1,401,321 14.98%
Sky 195,316 14.80%
Rest of operators 132,849 9.48%
Siminn 80,073 62.53%
IS 128,056
Vodafone 47,983 37.47%
Telecom Italia 9,305,681 47.43%
Vodafone 2,678,750 13.65%
Wind Tre 2,721,569 13.87%
IT 19,621,082
Fastweb 2,950,395 15.04%
Linkem 626,562 3.19%
Tiscali Italia 354,541 1.81%
33BoR (20) 97
Country Number of Total number of Market
Operator
/Participant lines lines share
Rest of operators 983,584 5.01%
Telecom Liechtenstein AG Confidential Confidential
LI 20,700
Backbone Solutions AG Confidential Confidential
Telia Lietuva, AB 295,494 80.43%
UAB „CSC Telecom“ 20,470 5.57%
LT 367,375
AB Lietuvos gelezinkeliai 3,482 0.95%
Other 47,929 13.05%
POST Telecom 178,600 65.95%
Proximus S.A. 40,800 15.07%
LU 270,800
Luxembourg Online S.A. 17,300 6.39%
Rest of operators 34,100 12.59%
Tet (ex. Lattelecom) 112,128 48.11%
Latvijas Mobilais Telefons 41,171 17.67%
LV CSC TELECOM 20,771 233,062 8.91%
D-COM 12,482 5.36%
Rest of operators 46,510 19.96%
Crnogorski Telekom 108,636 56.02%
Mtel 61,983 33.66%
ME 188,175
Telenor 1,830 6.34%
Telemach 15,726 3.97%
Makedonski Telekom 210,333 56.02%
One.VIP 126,387 33.66%
MK 375,441
Robi 23,805 6.34%
Rest of operators 14,916 3.97%
Go plc 153,168 53.34%
Melita Ltd 107,024 37.27%
MT Vodafone Malta Ltd 21,514 287,164 7.49%
Ozone 538 0.19%
Vanilla Telecoms Ltd 4,920 1.71%
KPN 2,862,140 47.84%
NL Vodafone/Ziggo 2,490,240 5,982,500 41.63%
T-Mobile/Tele2 630,120 10.53%
Telenor 315,426 62.75%
NextGenTel 71,293 14.18%
NO Get 32,385 502,706 6.44%
Telia 17,826 3.55%
Rest of operators 65,776 13.08%
Orange Polska S.A Confidential Confidential
PL 4,098,701
Netia S.A. Confidential Confidential
34BoR (20) 97
Country Number of Total number of Market
Operator
/Participant lines lines share
Multimedia Polska S.A. Confidential Confidential
Multimedia Polska Poludnie S.A. Confidential Confidential
Rest of operators Confidential Confidential
MEO Confidential 44.66%
NOS Group Confidential 33.81%
PT Vodafone Confidential 5,128,698 17.47%
ONI/NOWO Confidential 3.48%
Rest of operators Confidential 0.58%
Telekom RC S.A. 1,238,707 36.70%
S.C. RCS&RDS S.A. 1,116,987 33.09%
RO S.C. UPC Romania S.R.L. 632,563 3,375,644 18.74%
S.C. VODAFONE ROMANIA S.A. 173,492 5.14%
Rest of operators 213,895 6.34%
Telekom Srbija Confidential Confidential
RS Serbia Broadband Confidential 2,565,091 Confidential
Rest of operators Confidential Confidential
Telia Company AB 1,146,579 59.56%
Tele2 Sverige AB 242,821 12.61%
SE Telenor Sverige AB 124,690 1,924,972 6.48%
Telavox AB 96,442 5.01%
Rest of operators 314,440 16.33%
Telekom Slovenije Confidential 51.31%
Telemach Confidential 19.64%
SI T-2 Confidential Confidential 14.97%
A1 Slovenija Confidential 9.39%
Rest of operators Confidential 4.69%
Slovak Telekom, a. s. Confidential Confidential
Orange Slovensko, a. s. Confidential Confidential
SK UPC Broadband Slovakia, s.r.o. Confidential 764,446 Confidential
SWAN, a. s. Confidential Confidential
Rest of operators Confidential Confidential
Türk Telekom 5,539,241 48.03%
TTNet 4,354,498 37.76%
TR Türksat 277,866 11,532,903 2.41%
Superonline 237,386 2.06%
Rest of operators 1,123,912 9.75%
Telekom of Kosovo* SH.A. 28,050 59.08%
IPKO TELECOMMUNICATIONS
XK* 10,912 55,825 39.39%
L.L.C.
KUJTESA.NET SH.P.K. 1,349 0.00%
35BoR (20) 97
Country Number of Total number of Market
Operator
/Participant lines lines share
mts d.o.o. 15,514 1.53%
BT Confidential Confidential
TalkTalk Confidential Confidential
UK Sky Confidential 26,515,976 Confidential
Virgin Media Confidential Confidential
Vodafone Confidential Confidential
Notes to table 5:
AT: Number of lines as of end Q3/19..
BE: Number of access channels to the fixed telephone network at the 1st of January 2020.
BG: Data on number of lines (network termination points) per operators as of 31.12.2019 should be
treated as confidential.
CY: Number of lines as of 01.01.2020.
DE: Number of lines as of the end of 2019.
FI: Market shares as of 1.7.2019. Volumes are confidential. NRA has not set price caps for FTRs.
HR: Data refers to Q3 2019.
IE: Data refers to Q4, 2019. The market shares refer to market shares at a retail level.
IT: note that the number of lines refer to September 2019.
LT: Data about number of lines as of 2019 Q4.
LI: The operator Backbone Solutions AG just entered the market in 2019.
MT: Data reflects the position as at Q4 2019. Data includes the number of channels.
NO: Number of subscribers are provided as of 30.06.2019., instead of number of lines per 1.1.2020.
The number of subscribers per 1.1.2020 will not be available before Q2 2020.
RS: Number of lines as of 31.12.2019. Number of lines are collected by using ITU indicator i112 Fixed-
telephone subscriptions which refers to the sum of active number of analogue fixed-telephone line,
voice-over-IP (VoIP) subscriptions, fixed wireless local loop (WLL) subscriptions, ISDN voice-channel
equivavelnts and fixed public payphones. Number of fixed telephone subscriptions over FWA networks
and number of fixed subscriptions over mobile networks (CLL technology) are also included. Information
on individual number of lines per operator is confidential.
SE: PTS has no information of the number of lines. Instead the number of subscriptions has been used.
The market shares represent the wholesale level, i.e. including WLR (WLR is considered as belonging
to the incumbent).
SI: Absolute number of lines per operator is confidential. Absolute number of all lines is confidential if
this number is published with market shares of operators together.
TR: The number of lines specified above table for alternative network operators includes the number of
wholesale line rental and VoIP subscribers .Number of lines can be given as total number of lines
including layer 1, layer 2 and layer 3 termination points.
36BoR (20) 97
Annex 5 Average MTR per operator as of 1 January 2020
Table 6
Average
Country effective Mobile Total mobile Real Mkt
Operator (B)
/Participant prices Subscribers subscribers[1] Shares
(eurocents)
Telekom
0.9024 853,339 34.45%
Albania
AL Vodafone 2,476,814
0.9024 1,229,177 49.63%
Albania
Albtelecom 0.9024 394,298 15.92%
A1Telekom
0.8049 Confidential Confidential
Austria
T-Mobile
AT Austria
0.8049 Confidential 10,804,165 Confidential
Hutchison Drei
0.8049 Confidential Confidential
Austria
Proximus 0.9900 Confidential Confidential
Orange 0.9900 Confidential Confidential
Telenet 0.9900 Confidential Confidential
BE 11,509,573
Vectone 0.9900 Confidential Confidential
DPG Media 0.9900 Confidential Confidential
Lycamobile 0.9900 Confidential Confidential
A1 Bulgaria 0.7158 Confidential 38.48%
Telenor
BG 0.7158 Confidential Confidential 33.41%
Bulgaria
BTC 0.7158 Confidential 28.11%
Swisscom 2.5543 4,960,000 56.76%
CH Sunrise 3.1016 2,085,000 8,738,303 23.86%
Salt 3.1016 1,693,303 19.38%
CYTA 0.1700 663,376 53.36%
EPIC 0.1700 438,024 35.23%
CY 1,243,151
PRIMETEL 0.1700 126,374 10.17%
CABLENET 0.1700 15,377 1.24%
T-Mobile
Czech 0.9696 Confidential 36.85%
Republic a.s.
O2 Czech
0.9696 Confidential 28.46%
Republic a.s.
CZ Confidential
Vodafone
Czech 0.9696 Confidential 26.56%
Republic a.s.
Nordic
0.9696 Confidential 0.11%
Telecom s.r.o.
Telekom
Deutschland 0.9000
DE GmbH N/A 107,200,000 N/A
Vodafone
0.9000
GmbH
37BoR (20) 97
Average
Country effective Mobile Total mobile Real Mkt
Operator (B)
/Participant prices Subscribers subscribers[1] Shares
(eurocents)
Telefónica
Germany
0.9000
GmbH & Co.
OHG
TDC 0.5153 2,873,544 39.65%
Telenor 0.5153 1,433,365 19.78%
Telia 0.5153 1,089,692 15.04%
DK 7,241,638
3 (Hi3G) 0.5153 1,091,458 15.06%
Rest of the
0.5153 759,579 10.48%
operators
Telia Eesti AS 0.7800 832,423 42.78%
EE Tele2 Eesti AS 0.7800 472,716 1,945,690 24.30%
Elisa Eesti AS 0.7800 640,551 32.92%
Cosmote 0.9460 Confidential Confidential
Vodafone 0.9460 Confidential Confidential
EL 11,168,585
WIND 0.9460 Confidential Confidential
CYTA Hellas 0.9460 Confidential Confidential
TME 0.6400 16,261,859 29.59%
Orange 0.6400 13,855,699 25.21%
ES 54,961,112
Vodafone 0.6400 12,433,716 22.62%
Masmovil 0.6400 7,154,067 13.02%
DNA Oyj 0.8900 Confidential Confidential
Elisa Oyj 0.8900 Confidential Confidential
FI Telia Finland 7,140,000
0.8900 Confidential Confidential
Oyj
Ålcom 0.8900 Confidential Confidential
Orange 0.7400 Confidential
SFR 0.7400 Confidential
Bouygues
FR 0.7400 Confidential 76,800,000 Confidential
Telecom
Free Mobile 0.7400 Confidential
MVNOs 0.7400 Confidential
HT 0.6049 2,104,093 45.70%
HR A1 0.6049 1,584,709 4,604,635 34.42%
Tele2 0.6049 915,833 19.89%
Magyar
0.5152 Confidential Confidential
Telekom
Telenor 0.5152 Confidential Confidential
HU Vodafone 0.5152 Confidential 10,247,842 Confidential
UPC 0.5152 Confidential Confidential
Netfone 0.5152 Confidential Confidential
Tarr 0.5152 Confidential Confidential
38BoR (20) 97
Average
Country effective Mobile Total mobile Real Mkt
Operator (B)
/Participant prices Subscribers subscribers[1] Shares
(eurocents)
Vodafone 0.5500 1,797,311 34.93%
Three Ireland
0.5500 1,640,174 31.88%
Group
IE 5,145,256
Eircom Group
0.5500 1,087,874 21.14%
Mobile
Tesco Mobile 0.5500 415,842 8.08%
Siminn 0.6993 138,241 32.68%
Vodafone 0.6993 128,011 30.26%
IS 422,992
Nova 0.6993 147,248 34.81%
Hringdu 0.6993 9,492 2.24%
Telecom Italia 0.7600 22,092,151 27.42%
Vodafone 0.7600 20,191,922 25.06%
IT WindTre 0.7600 24,738,495 80,580,548 30.70%
Iliad Italia
0.7600 4,541,000 5.64%
S.p.A.
PosteMobile 0.7600 4,737,096 5.88%
Telecom
Liechtenstein 2.6455 Confidential Confidential
AG
Swisscom
LI 2.6455 Confidential 16,266 Confidential
(Schweiz) AG
Salt
(Liechtenstein) 2.6455 Confidential Confidential
AG
Tele2 0.9400 1,957,750 42.02%
Telia Lietuva,
0.9400 1,346.645 28.91%
AB
LT 4,658,823
Bite Lietuva 0.9400 1,191,203 25.57%
Rest of the
0.9400 163,225 3.50%
operators
POST
0.8900 371,700 42.02%
Telecom
LU Proximus 814,100
0.8900 275,500 28.91%
Luxembourg
Orange 0.8900 121,100 25.57%
Bite Latvija 0.8868 473,397 22.86%
Latvijas
LV Mobilais 0.8868 721,034 2,070,424 34.83%
Telefons
Tele2 0.8868 875,993 42.31%
Telenor 0.7600 378,023 32.84%
Crnogorski
ME Telekom
0.7600 374,918 1,150,998 32.57%
Mtel 0.7600 398,057 34.58%
Luca Mobile 2.4392 43,984 2.14%
2,055,339
MK A1 1.0244 996,428 48.48%
Makedonski
1.0244 1,003,211 48.81%
Telekom
39BoR (20) 97
Average
Country effective Mobile Total mobile Real Mkt
Operator (B)
/Participant prices Subscribers subscribers[1] Shares
(eurocents)
Telekabel/Robi 1.0244 11,715 0.57%
Go plc 0.4045 234,909 37.03%
Melita Ltd 0.4045 150,208 23.68%
MT 634,386
Vodafone 0.4045 249,240 39.29%
Yom 0.4045 29 0.00%
KPN 0.5810 6,600,716 30.22%
Vodafone
0.5810 4,966,792 22.74%
NL Ziggo 21,841,364
T-Mobile 0.5810 4,012,729 18.37%
Tele2 0.5810 1,379,000 6.31%
Telenor 0.3171 2,755,449 48.03%
NO Telia 0.3171 2,125,178 5,737,455 37.04%
ICE 0.3171 536,061 9.34%
Orange Polska
1.0007 Confidential Confidential
S.A.
Polkomtel sp.
1.0007 Confidential Confidential
PL z o.o. 46,853,711
P4 sp. z o.o. 1.0007 Confidential Confidential
T-Mobile
1.0007 Confidential Confidential
Polska S.A.
MEO 0.4000 Confidential Confidential
PT NOS 0.4000 Confidential 11,909,751 Confidential
Vodafone 0.4000 Confidential Confidential
Vodafone
0.7600 6,901,462 30.44%
Romania S.A.
Orange
0.7600 8,801,928 38.82%
RomaniaS.A.
Telekom RMC
0.7600 2,938,278 12.96%.
RO S.A. 22,673,892
RCS & RDS
0.7600 3,184,686 14.05%
S.A.
LycaMobile 0.7600 17,225 0.08%
Rest of the
0.7600 830,313 3.66%
operators
Telekom Srbija
1.2167 Confidential 44.3%
- MTS
RS Telenor 1.2167 Confidential 8,453,887 31.4%
Vip mobile 1.2167 Confidential 24%
Telia
0.2657 4,993,394 34.91%
Company
Tele2 0.2657 4,036,741 28.22%
SE Telenor 0.2657 2,741,270 14,302,677 19.17%
Hi3G 0.2657 1,975,716 13.81%
Lycamobile 0.2657 182,637 1.28%
Telavox AB 0.2657 77,507 0.54%
40BoR (20) 97
Average
Country effective Mobile Total mobile Real Mkt
Operator (B)
/Participant prices Subscribers subscribers[1] Shares
(eurocents)
Rest of the
0.2657 295,412 2.07%
operators
Telekom
1.1400 Confidential 40.52%
Slovenije
SI A1 Slovenija 1.1400 Confidential Confidential 30.94%
Telemach 1.1400 Confidential 22.49%
T-2 1.1400 Confidential 6.05%
Orange
Slovensko, a 0.8180 Confidential Confidential
s.
Slovak
0.8180 Confidential Confidential
SK Telekom, a. s. 6,163,433
O2 Slovakia,
0.8180 Confidential Confidential
s. r. o.
Swan Mobile,
0.8180 Confidential Confidential
a. s.
Turkcell 0.3898 30,510,768 40.42%
TR Vodafone 0.4023 23,422,645 75,479,251 31.03%
Avea 0.4615 21,545,838 28.55%
Telecom of
1.1460 1,225,697 59.08%
Kosovo*
Ipko
Telecommunic 1.1460 817,145 39.39%
XK* ations 2,074,556
Dukagjini
telecommunic 1.1460 77 0.00%
ations
mts d.o.o. 1.1460 31,637 1.53%
EE 0.5565 Confidential Confidential
Telefonica 0.5565 Confidential Confidential
UK 79,148,841
Vodafone 0.5565 Confidential Confidential
H3G 0.5565 Confidential Confidential
Notes to table 6:
AL: The subscribers data refers to yearly reported for 2019, M2M SIM cards are excluded from
'Subscribers'
AT: Individual operator subscriber data strictly confidential, not to be published in the report.
BE: Subscriber data as of the 1st of January 2020.
BG: Data as of 31.12.2019. Individual data on number of subscribers/M2M SIM Cards by operators is
confidential. M2M, M2P and data-only SIMs cards are not included in the figure of total mobile
subscribers.
CH: Subscriber base as of 31.12.2019.
41BoR (20) 97
CY: OCECPR has revised the MTR in May 2020. The new MTR rate based on the BU-LRIC Model
latest results was applied retroactively from 01.01.2020.
CZ: Regulated MTR is defined as a single price per minute. SIM cards filled in column "rest of operators"
are MVNOs (Service Providers) with no MTR regulation - however, termination is carried out by their
MNOs for regulated rates. The total number of SIM cards as of 30th June 2019 is available as the latest
information.
DE: Current MTR is valid until 30.11.2019. The total number of active subscribers is not available by
individual operator. The data are as of the end of 2019.
DK: Total subscribers is derived as of ultimo H1 2019. Usually the DBA issues MTR ultimo any year for
the entire following year. However, due to the EU MTR will be applicable for use from 1/1/2021, DBA
has decided to reuse the 2019 rate for 2020.
EL: As far as the subscriptions are concerned, please note that: a) data refers to 31/12/2019, and b)
data per operator is considered confidential. The price on 1/1/2020 was 0.946 eurocents/min for all
operators. However, EETT very recently issued a new decision that sets the MTR at 0.622 eurocents
per minute. Operators are obliged to apply this price from February 2020. Please note that in the table
of Annex 6 the next sheet the new value is inserted and not the one of 1/1/2020 because the new rate
will be applied for a longer period within the first semester of 2020.
FI: Subscriber and M2M figures per operator are confidential. Subscriber figures per 1.7.2019.
Subscriber figures depict the number of subscriptions not SIM cards. Subscription figures include all
subscriptions other than data-only subscriptions and M2M. SIM card volumes are very close to the
subscription number in Finland. Traficom does not collect detailed information of SIM cards (e.g. data-
only SIM cards) and therefore the figure would not have reflected the asked figures. Number of M2M
cards is collected and is reported in the figures.
FR:Subscribers' base and M2M SIM Cards Volume per operator are confidential data. Only aggregated
market data are provided.
HR: Data refers to Q3 2019. Please note that MRs are regulated only for the calls originated on A
numbers belonging to the EU/EEA operators and terminated into the individual fixed networks in
Croatia.
LT: Data as of 2019 Q4.
LU: Règlement ILR/T17/4 du 9 juin 2017 portant fixation du plafond tarifaire pour les prestations de la
terminaison d’appel vocal sur les réseaux mobiles individuels (Marché 7/2007) , Price cap based on
Pure-LRIC. Individual data of operators is confidential.
MT: Data reflects as at Q4 2019.
NO: Number of subscribers are provided as of 30 June 2019. The total number of subscribers per 1.
January 2020 will be available in Q2 2020.
PT: Information on the number of subscribers of each operator is confidential. In June 21, 2018,
ANACOM approved a new decision establishing the new MTR also in accordance with the EC
Recommendation on Termination rates - BU-LRIC. According to this decision, in 01.07.2020 the MTRs
will be further updated on the basis of existing and foreseen inflation data.
42You can also read


