Investor Presentation - Bharti Airtel Limited June 2009 - Amazon S3

Page created by Ashley Zimmerman
 
CONTINUE READING
Investor Presentation - Bharti Airtel Limited June 2009 - Amazon S3
Investor Presentation
Bharti Airtel Limited
June 2009
Investor Presentation - Bharti Airtel Limited June 2009 - Amazon S3
Disclaimer
The information contained in this presentation is only current as of its date. All actions and statements made herein or otherwise shall be subject to the
applicable laws and regulations as amended from time to time. There is no representation that all information relating to the context has been taken
care off in the presentation and neither we undertake any obligation as to the regular updating of the information as a result of new information, future
events or otherwise. We will accept no liability whatsoever for any loss arising directly or indirectly from the use of, reliance of any information
contained in this presentation or for any omission of the information. The information shall not be distributed or used by any person or entity in any
jurisdiction or countries were such distribution or use would be contrary to the applicable laws or Regulations. It is advised that prior to acting upon this
presentation independent consultation / advise may be obtained and necessary due diligence, investigation etc may be done at your end. You may
also contact us directly for any questions or clarifications at our end.
This presentation contain certain statements of future expectations and other forward-looking statements, including those relating to our general
business plans and strategy, our future financial condition and growth prospects, and future developments in our industry and our competitive and
regulatory environment. In addition to statements which are forward looking by reason of context, the words ‘may, will, should, expects, plans, intends,
anticipates, believes, estimates, predicts, potential or continue’ and similar expressions identify forward looking statements.
Actual results, performances or events may differ materially from these forward-looking statements including the plans, objectives, expectations,
estimates and intentions expressed in forward looking statements due to a number of factors, including without limitation future changes or
developments in our business, our competitive environment, telecommunications technology and application, and political, economic, legal and social
conditions in India. It is cautioned that the foregoing list is not exhaustive
This presentation is not being used in connection with any invitation of an offer or an offer of securities and should not be used as a basis for any
investment decision.

 “The information contained herein does not constitute an offer of securities for sale in the United States. Securities may not be sold in the United
 States absent registration or an exemption from registration under the U.S. Securities Act of 1933, as amended. Any public offering of securities to be
 made in the United States will be made by means of a prospectus and will contain detailed information about the Company and its management, as well
 as financial statements. No money, securities or other consideration is being solicited, and, if sent in response to the information contained herein, will
 not be accepted.”

Investor Relations :- http://www.bhartiairtel.in
For any queries, write to: ir@bharti.in
Investor Presentation - Bharti Airtel Limited June 2009 - Amazon S3
Bharti Airtel crosses 100 Mn customers
 9 Third company in the world to cross 100 million subscriber mark in a Single country

 9 Joins China Mobile and China Unicom in the 100M-Plus Club

 9 Sixth largest integrated operator in the world after China Mobile, China Unicom, China
   Telecom, AT&T and Verizon

 9 Started in 1995…took 13-1/2 years to reach 100 million mark

 9 If Airtel customers were to form a single country, it would be 12th the largest country in
   the world

 9 Continues to lead Revenue Market Share and Subscriber Market Share

What’s Next …
 9 Plans to reach 200 million users in the next 2-1/2 years
 9 Next phase of growth will come from Rural India which is still under penetrated
 9 MNP and 3G will also act as catalyst in spurring further growth

    Proud to lead the telecom revolution…positively impacting the lives of people

                                                             3
Mobile Services   Telemedia Services   Enterprise Services
Investor Presentation - Bharti Airtel Limited June 2009 - Amazon S3
Advantage India

                                                                                                  ƒ Population: 1.1 billion
                                                                                                        → increasing urbanisation
                                                                                                        → relatively large youth population
                                                                                                  ƒ GDP Growth (Real) : ~6.7%
                                                                                                        → second highest growing economy
                                                                                                  ƒ GDP Size (PPP adjusted): US$ 3 trillion
                                                                                                        → fourth largest economy in the world
                                                                                                  ƒ Telecom penetration: 38.88% (452.91 mn
                                                                                                    telecom subs)
                                                                                                        → one of the lowest
                                                                                                        → Govt. target to reach 500 mn. telecom
                                                                                                          subs by 2010
                                                                                                  ƒ Broadband penetration: 0.55% (6.40 mn)
                                                                                                        → one of the lowest
                                                                                                        → Govt. target to reach 20 mn.
                                                                                                          Broadband subs by 2010

                                      Deep Domestic Demand…Huge Growth Potential
 Note: (1) Telecom and Broadband penetration is as at May 31st 2009, as per TRAI press release.

                                                                                              4
Mobile Services     Telemedia Services       Enterprise Services
Investor Presentation - Bharti Airtel Limited June 2009 - Amazon S3
The Company...Bharti Airtel – An Integrated Telco

    ‰ Wireless Services                                           ‰ Enterprise Services
                    ‰ 2G/3G                                              ‰ Carriers
                    ‰ Rural Market                                       ‰ Corporate

      ‰ Telemedia Services                                        ‰ Passive Infrastructure
                                                                    Services
                    ‰ Fixed Line
                    ‰ Broadband
                    ‰ DTH (Media)/IPTV

              Fully integrated telecom player offering end to end solutions

                                                              5
 Mobile Services   Telemedia Services   Enterprise Services
Investor Presentation - Bharti Airtel Limited June 2009 - Amazon S3
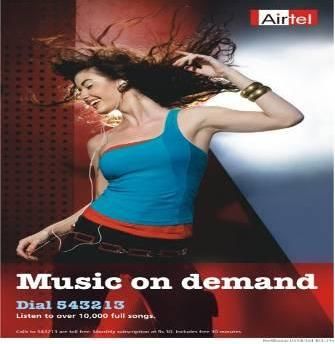
Bharti Airtel - positioning in the world and India

                                   3rd LARGEST wireless operator in the world1

                LARGEST private INTEGRATED telecom company in India

                6th LARGEST INTEGRATED telecom operator in the world

                                          LARGEST WIRELESS operator in India

                               LARGEST private FIXED LINE operator in India

                        LARGEST operator in NLD, ILD and VSAT business

      LARGEST TELECOM company listed on Indian Stock Exchanges
 Note: (1) 3rd largest wireless operator in the world refers to in-country (single country) operator based on the number of subscribers.

                                                                                                     6
Mobile Services       Telemedia Services         Enterprise Services
Investor Presentation - Bharti Airtel Limited June 2009 - Amazon S3
Latest Results – Q4 FY08/09

  Key operating and financial metrics                                                                    Continued Strong Performance

                                     Q4 FY 09              Y-on-Y                               ƒ Wireless Customer market share leadership at
                                                                                                  24.0%.
  Customers                          96.65 mn              50.0%
                                                                                                ƒ Total minutes on network carried in Q4 – 150 billion
  Revenue                          $ 1,928 mn              25.6%                                ƒ Total employee strength – 24,538
                                                                                                ƒ Balance sheet strength:
  EBITDA                             $ 785 mn              23.1%
                                                                                                         ƒ Assets - $ 12 billion
  Cash Profit                        $ 743 mn              24.8%
                                                                                                         ƒ Net debt - $ 629 million*
  Net Income                         $ 440 mn              20.9%                                         ƒ Net debt to EBITDA - 0.25 times*
                                                                                                ƒ Continues to be FCF positive on a standalone basis

  EBITDA Margin                        40.7%
                                                                                                ƒ Company declared Maiden dividend of 20% of face
  Net Profit Margin                    22.8%                                                     value for the year.
                                                                                                ƒ Board has also proposed sub-division (share split)
  ROCE                                 30.8%
                                                                                                 of existing equity shares of Rs. 10/- each into two
  ROE                                  32.6%                                                     equity shares of Rs. 5 each.

  Note: * Net Debt is excluding fully and compulsory convertible, non-cumulative, unsecured and interest free Debentures of US$ 738.

                                                                                                 7
 Mobile Services      Telemedia Services       Enterprise Services
Investor Presentation - Bharti Airtel Limited June 2009 - Amazon S3
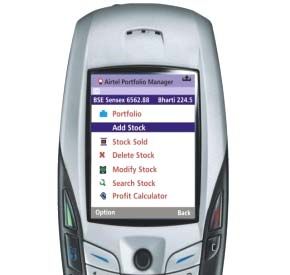
Segment contribution…Rev, EBITDA and Investment
                                   Revenue                                                                                 EBITDA

                           4% 7% 1%                                                                              5% 7% -3%
                  18%
                                                                                                           20%

                  9%                                                                                                                         65%
                                                            84%                                                  9%

 Mobile Services                             Telemedia Services                                Mobile Services                   Telemedia Services
 Enterprise Services - Carriers              Enterprise Services - Corporates                  Enterprise Services - Carriers    Enterprise Services - Corporates
 Passive Infrastructure Services             Others                                            Passive Infrastructure Services   Others

                                                                               INVESTMENTS

                                                                                     1%
                                                                         24%
                                                                                                        49%
                                                                   1%
                                                                   13%
                                                                               11%

                                                  Mobile Services                         Telemedia Services
                                                  Enterprise Services - Carriers          Enterprise Services - Corporates
                                                  Passive Infrastructure Services         Others

  Note: (1) Revenue and EBITDA is gross of inter segment eliminations.

                                                                                           8
 Mobile Services     Telemedia Services        Enterprise Services
Performance dashboard - 3 line graph

                   110,000        74%                          74%             73%                          72%
                                                                                                                         70%
                                                                                                                                         70.0%
                   100,000
Amount in Rs. Mn

                                                                                                           96,334      98,245
                    90,000                                                                                                               60.0%
                                                                              90,2 03
                    80,000                                    84,833
                                                                                                                                         50.0%
                                      78,191
                    70,000

                                                                                                            35%                          40.0%
                    60,000                                     34%             35%                                       34 %
                                    33%
                    50,000                                                                                                               30.0%
                                      Q4FY08

                                                                                                             Q3FY 09

                                                                                                                          Q4FY 09
                                                                Q 1FY09

                                                                                Q2FY09

                                               Gross Revenue (Rs mn.) (LHS)                  Opex to Gross Rev (RHS)   Capital Productivity

                   Productivity Indicators = growing revenues + cost efficiencies + capital productivity

                                                                                         9
Mobile Services              Telemedia Services    Enterprise Services
Recently in news...
• Announced Managed Services Joint Venture with Alcatel-Lucent to manage Bharti Airtel’s pan-
  India Broadband and Telephone services and help Airtel’s transition to Next Generation Networks.

• Offered Net PC by launching cloud computing service on broadband – a low-cost online computer
  for its broadband customers.

• Airtel digital TV launched “Magic dekho, talk time pao” offer - Exclusive offer only for Airtel Prepaid
  Mobile customers across the country where on buying a digital TV connection at Rs. 2000 with 3
  months of Super Value Pack, the Airtel Prepaid Mobile customer receives 1000 minutes of local Airtel to
  Airtel talk time.

• Partnered with UK based in-flight solutions company, AeroMobile, to offer in-flight cell phone
  connectivity to its customers.

• Signed a 5 year multi million dollar content partnership deal with Manchester United (world’s
  second richest football club) to provide Airtel’s subscribers across India, Sri Lanka and Seychelles,
  exclusive access to United football’s content over mobile.

• Announced managed services deal with Comviva for its value added portfolio to manage around
  2000+ of Airtel’s VAS nodes across India from various partners to meet the defined service level
  agreements.

                                                             10
Mobile Services   Telemedia Services   Enterprise Services
Wireless Services

                                                             11
Mobile Services   Telemedia Services   Enterprise Services
Indian Wireless Market…KPIs

                           JK                                                                 ƒ Sub Base : 415.25 mn
                                                                                                                   →second largest market
                            HP
                       PB                                                                     ƒ Wireless Penetration: 35.8%
                                UP(W)                                                                              →lowest in the world
                       HAR
                                                                                              ƒ HHI Index: very high
                                 DELHI
                                DEL
                                                                                                        →one of the most competitive market
              RAJ                                                          AS
                                             UP(E)                                            ƒ Prepaid Base: 90%+
                                                        BH
                                                                                 NE                          →one of the highest in the world
        GUJ          MADHYA MP
                            PRADESH`                          WB
                                                                                              ƒ Usage per sub per month:
                                                     OR        Kol                                ƒ Minutes: 430
                    MAH                                                                                            →one of the highest
   MUM
                                                                  Metros                          ƒARPU: ~ US$ 5.95
                                                                                                                   →one of the lowest
                                AP                                 A Cat.
                   KK                                                                         ƒ Rate per minute: 1.4 cents
                                                                  B Cat.                                     → one of the lowest in the world
                                     CHN
                                                                                              ƒ VAS: ~ 9%
                            TN                                    C Cat.
               KER                                                                                                 →One of the lowest

  Note: (1) Subscriber numbers and wireless penetration numbers as at May 31, 2009 as per TRAI. (2) Other indicators on the slide are based on QE Mar, 2009 Global Wireless
  Matrix released by Merrill Lynch, and reflective of Industry numbers.

                                                                                               12
 Mobile Services     Telemedia Services        Enterprise Services
Rapidly Growing Wireless Market

     Net Adds in May…11.6 Mn, a more sustainable
    number than 15 Mn average net adds per month                                                                    S-curve triggered
                    in last quarter

                            Closing Customers (mn)           Net Adds (mn)                       90%

    450                                                                                11        80%
    400                                                                                10        70%
                                                                                       9
    350                                                                                          60%
                                                                                       8
    300                                                                                7         50%
    250                                                                                6
                                                                                                 40%
    200                                                                                5
                                                                                       4         30%
    150
                                                                                       3         20%
    100
                                                                                       2
        50                                                                                       10%
                                                                                       1
    -                                                                                  -         0%
                                                                                                       1999 2001 2003 2005 2007 2009 2011 2013 2015 2017 2019

                                                Fastest Growing Market in the World

  Note: (1) Actual Data as per Industry Association Releases and Industry Estimates.

                                                                                            13
 Mobile Services      Telemedia Services        Enterprise Services
Wireless Market Structure

                            Subscriber Trends                                                                   Customer Market Share – CMS (%)

                                                                                                        25.0%   24.0%
                                                                                                                           24.0%
       120.00                                                                                           23.0%
                99.55                                                                                   21.0%
       100.00                                                                                                                 18.6%    17.8%
                                                                                                        19.0%
                            77.22                                                                                                  17.6%   17.1%
        80.00                            74.08                                                          17.0%                                                       16.3%
                                                      58.17                                             15.0%                                             14.0%
(mn)

        60.00
                                                                    41.24                               13.0%
                  32.72                                                       36.49                                                                                       9.9%
        40.00                  28.18                                                   28.50            11.0%
                                             26.61                                                                                                                            9.4% 8.8% 9.2%
                                                         12.96         15.10                             9.0%
        20.00                                                                    11.01     10.74                                                                                               6.9%
                                                                                                         7.0%                                                                                            6.4%

          -                                                                                              5.0%
                                                        BSNL+MTNL
                                           Vodafone
                 Airtel

                              Reliance

                                                                       Idea

                                                                                Tata

                                                                                          Others

                                                                                                                                               Vodafone

                                                                                                                                                            BSNL+MTNL
                                                                                                                  Airtel

                                                                                                                                                                            Idea

                                                                                                                                                                                      Tata
                                                                                                                                   Reliance

                                                                                                                                                                                                Others
                             May-09        May-08        Net adds during the year                                                             CMS(May'09)               CMS(May'08)

       • Airtel continuously consolidating its market leadership position despite intense competition
       • Airtel current monthly net adds at 2.81 million vs. 2.46 million a year ago
       • Airtel ranks 1& 2 in 19 circles in terms of number of subscribers
       • 64% of net adds coming from B&C circles (rural India)

                                             Airtel Continues to lead on Revenue Market Share
                                                                                                   14
 Mobile Services          Telemedia Services            Enterprise Services
Company Highlights on
                                                                    Wireless Services

                                                             15
Mobile Services   Telemedia Services   Enterprise Services
First mover advantage / Product innovations

Electronic
                                                                                                          Easy Music
Recharge /
  Micro
 Prepaid
                                                        Life time validity product

Hello Tunes
(Ring Back
  Tones)
                                                                                                          Song Catcher

                                               Call Home Service
                                                                                Music on Demand
  Airtel Live
   (Portal)                                                                            Google
                                                                                        search        Portfolio Manager
                                                                                                       (Stock Tracker)
                                           Money Transfers

                                                                                             iPhone

Blackberry
                                                                                                         M Commerce
                                                     ¨       focus on product innovations
                                                                           16
    Mobile Services   Telemedia Services   Enterprise Services
Performance Indicators - Financial

                     Revenues (USD mn)                                            EBITDA (USD mn) & Margin (%)

                                                                                   41.0   40.8   35.5   30.7   30.2   31.4   31.5
   1,700                                                       1,614        550
   1,600                                               1,558
   1,500                                       1,430                                                                         508
   1,400                               1,357                                500                                       490

   1,300                    1,260
   1,200            1,101                                                   450
                                                                                          449    447
   1,100                                                                                                       432
            993
   1,000                                                                                                416
                                                                                  407
     900                                                                    400
           Q208     Q308    Q408       Q109    Q209    Q309    Q409               Q208    Q308   Q408   Q109   Q209   Q309   Q409

                                                                       17
Mobile Services   Telemedia Services    Enterprise Services
Performance Indicators - Operational
          Customers & Market Share                                                                     Prepaid/Postpaid
100.0                                                                    28.0%   105.0%
                                                               93.9
 90.0                                                                    27.0%                                                               100.8%
                                                       85.7                      100.0%
 80.0                                          77.5                      26.0%
                                                                                                                          93.5% 94.2%
                                    69.4                                                     95.4%
 70.0                                                                    25.0%    95.0%                       92.3% 92.9%
                             62.0                                                                       91.6%
                    55.2                         24.6% 24.7%                                90.4% 91.0%
 60.0                                  24.2%                             24.0%
          48.9                 23.7%                             24.0%            90.0%
 50.0      23.4%     23.6%                                               23.0%
 40.0                                                                    22.0%    85.0%
         Q208     Q308       Q408   Q109       Q209    Q309    Q409                         Q208     Q308    Q408    Q109    Q209    Q309    Q409

                                                                                                    Prepaid Subs             Prepaid Net Adds
                           Customers (Mn)            CMS (%)

                           ARPU & RPM                                                             MoU/Sub/Month & MON

7.5     7.2                                                              1.6          550                   507      534    526                   150.0
          1.5     7.0  7.0                                                                                                          505   485
7.0                1.5              6.9                                  1.5          500                                                 130.7
                                                                                            469      474                            123.6
                         1.4                   6.5                       1.4                                                115.8                 100.0
6.5                                                  6.4                              450                          105.2
                                       1.3       1.2   1.3     6.0       1.3                                89.1
6.0                                                                                   400            73.8
                                                               1.2       1.2                 64.4                                                 50.0
5.5                                                                      1.1          350
5.0                                                                      1.0          300                                                         0.0
        Q208 Q308 Q408 Q109 Q209 Q309 Q409                                                  Q208 Q308 Q408 Q109 Q209 Q309 Q409

                 ARPU (US$)                  RPM (US Cents)                                          MOU / sub             Total mins (bn)

                                                                                 18
  Mobile Services    Telemedia Services        Enterprise Services
Road map – Wireless Market
                                                       Current                                Proposed

         Presence                  Operational in 22 circles of India on GSM         Looking for options primarily in
                                                  technology.                              emerging markets.

                                         Launched Operations in Srilanka              Option in emerging markets….

       Population                  81% of population covering 5060 census        • Poised to cover all census towns and
       Coverage                      towns and over 4 lakh non-census               majority of non-census towns and
                                             towns and villages.                                 villages
                                                                                 • Penetration wider and deeper into rural
                                                                                                   India

  Network Rollout &                • Hive off of passive infrastructure into a         • Network sites ~ 100,000 +
      Strength                       separate independent tower company
                                                                                  • Plan to get 3G license and spectrum.
                                       • Largest GSM (900/1800 Mhz) network
                                          in India comprising of over 93,368
                                                     network sites
                                        • Strong partners: Ericsson; Nokia;
                                               Huawei; Alcatel Lucent

                                                                     19
Mobile Services   Telemedia Services   Enterprise Services
Road map – Wireless Market
                                                        Current                             Proposed

        Sales &                           • One of the widest distribution       • Continue distribution expansion,
      Distribution                                    network.                         especially in rural areas
       Network
                                         • Following the FMCG company
                                           distribution model - Match Box
                                                      Approach
                                   • Present in over a million PoP in India.
                                        • Tie-up with IFFCO, an edge over
                                         others to reach out to Rural India

  Customer Service                      • Continuous improvement in CSAT         • Focus on service through service
                                                      scores                       training and employee sensitivity
                                        • Multi pronged service strategy in    • Unified service backend for enhanced
                                                       place                              customer experience

      Employee                             • Significant improvement in           • Sustain employee engagement
     Engagement                                employee engagement
                                                                                  • Focus on employee capability
                                   • Awarded “Great Work Place 2008” by         development and leadership pipeline
                                                  Gallup

                                                                     20
 Mobile Services   Telemedia Services   Enterprise Services
Current positioning and way forward…
       Leadership Positioning                                                Growth strategy and plans

                      Revenue                                                             New Revenue
                                                                                            Streams
                               ‰ Revenue size ($ 6 Bn)                                          ‰ Changing face of
                               ‰ Revenue Market                                                 growth through M-Com,
                               Share                                                            M-entertainment & 3G

                                                       Cost
                                                                                                               Net Adds
                                    ‰ Improving cost efficiencies           Maximizing
   Non financial                                                                                      ‰ Driven by rural strategy
                                    ‰ Lowest cost GSM network                 usage
      vitals
 ‰ Brand                                                                 ‰ Increasing the usage through U&R drive
 ‰ Distribution                                                          ‰ Wallet share
 ‰ Churn lower than industry
 ‰ Spectrum Mix (900/1800 MHz)

                                                                    21
 Mobile Services   Telemedia Services   Enterprise Services
Telemedia Services

                                                             22
Mobile Services   Telemedia Services   Enterprise Services
A snapshot

 ‰     Largest private operator having presence in the voice and data (broadband).

 ‰     Foraying into the media space - IPTV & DTH (Direct-To-Home) services.

 ‰     Key Performance Indicators

         1.       Voice (wire-line) and Data (DSL) Presence in 95 top cities of India.

         2.       Target Segment : Retail and Small and Medium Enterprises.

         3.       Customer base: 2.8 million (end May,2009)

         4.       Broadband (DSL with speeds>256 kbps) penetration at 39% of customer base.

         5.       Average ARPU for Quarter ended March’09 $ 21.0 per month.

         6.       Segment contributing to 9% of overall revenues of the company.

         7.       EBITDA margin of over 42.1%.

          Broadband revolution to follow wireless revolution in India

                                                                   23
Mobile Services    Telemedia Services   Enterprise Services
Telemedia Services

  Business Units                               Media                   SMBs                       Homes

                                                              • Voice
                                 • DTH                                                    • Broadband
      Products                                                • Data
                                 • IPTV                                                   • Voice
                                                              • Mobile Services

                                  A Pan-India DTH                                         Dominant Broadband &
                                                              One-Stop Shop for All
                                  Businesses; and a                                       Fixed Voice share of the
         Goal                                                 Airtel Services and
                                  targeted IPTV Presence                                  affluent in targeted 95
                                                              Solutions to SMBs
                                  in top metros                                           cities

                                                                                          • Deeper & Not Wider: 95
                                 • Best-in-class
                                                              • Data Products:              Cities
                                   technology:
                                                                Internet, MPLS etc        • Vertical & Not
                                 • World-class Installation
                                                              • Integrated Solutions to     Horizontal: Hi-Rise
                                   & Customer Service
     Strategies                                                 Drive Share of wallet     • Network Enhancement
                                 • Interactive VAS to Drive
                                                              • Strategic Alliances         to Deliver 8+ MBPS
                                   ARPU enhancement
                                                              • Indirect Channel to       • New Products & VAS to
                                 • One Airtel Synergies for
                                                                Drive Penetration           drive Flat, Combo
                                   Distribution, Brand & IT
                                                                                            Plans

                                                                24
Mobile Services   Telemedia Services   Enterprise Services
Product Portfolio

       Our Media Play

                                                              25
 Mobile Services   Telemedia Services   Enterprise Services
Performance Indicators
                      Revenues (USD mn)                                                                EBITDA (USD Mn) & Margin (%)

  190                                                                                                  39.7     43.4     43.8     42.2     43.6     41.7    42.1
                                                                                            80.0
  180                                                                                       75.0                                            73
                                                                                                                                                     69      71
                                                                                 168        70.0                                   66
                                                       167                                                                66
  170                                                              166
                                                                                            65.0                 62
                                          157                                               60.0
  160
                                                                                            55.0        55
                              150
  150                                                                                       50.0
                     143
                                                                                            45.0
  140                                                                                       40.0
         Q208       Q308      Q408        Q109      Q209        Q309         Q409                      Q208     Q308     Q408     Q109     Q209     Q309    Q409

           Customers (overall & DSL)                                                                                     ARPU (USD)

2,750                                                                    1,072     1,200        28.0
                                                             992
                                                 922                                                     22.6     22.4     22.3     22.3     22.5    21.6
2,500                                 853                                2,726     1,000        24.0                                                         21.0
                    751      795
                                                             2,619                              20.0
2,250    705                                     2,509                             800
                            2,283    2,394
                    2,178                                                                       16.0
2,000   2,075                                                                      600
                                                                                                12.0
1,750                                                                              400
                                                                                                 8.0
1,500                                                                              200           4.0
1,250                                                                              0             0.0
         Q208       Q308     Q408    Q109        Q209        Q309        Q409                           Q208      Q308    Q408      Q109    Q209     Q309    Q409
                   B&T Customers ('000)         DSL Customers ('000)

                                                                                           26
 Mobile Services     Telemedia Services      Enterprise Services
Enterprise Services

                                                             27
Mobile Services   Telemedia Services   Enterprise Services
A snapshot

‰ Carrier: - one of the largest carriers of voice and data, both domestic and international.

‰ Corporate: - providing end to end telecom solutions to large corporate and Small &

     Medium Businesses.

‰ Present Competition:

       ‰     National Long Distance: BSNL; Reliance; VSNL; Vodafone; Tata

       ‰     International Long Distance: VSNL, Bharti, Reliance, BSNL

                                                             28
Mobile Services   Telemedia Services   Enterprise Services
Enterprise Services – Carriers NLD

                                                                                                   Voice Network

                                                                                                       Jalandhar

                                                                                                            Chandigarh

                                                                                                            Delhi
                                                                                             Jaipur                  Lucknow

                                                                                       Ahmedabad
                                                                                                          Bhopal
                                                                                                                               Kolkata
                                                                                                             Nagpur

                                                                                        Mumbai
                                                                                                                   Hyderabad

                                                                                           Bangalore               Chennai

                                                                                                       Coimbatore
                                                                                         Ernakulam

                                                                            captive traffic (group traffic)                                   ~ 90 %
                                                 Legend
                                                  Existing OFC Route        NLD minutes carried (Q4FY09)                                 11.7 Bn Min
                                                  Under Execution
                                                                            optic fibre capacity (Q4FY09)                                101,337 km

                                                                       29
Mobile Services   Telemedia Services   Enterprise Services
Enterprise Services – Carriers ILD

                    London
      Bude
EIG

             Marseilles
                            Monaco

       Sesimbra                  Palermo                                                                                                                                                            Los Angeles
                                      Catania
       Gibraltar
                   Annaba                 IMEWE                                                                                                                   Chikura
                            Bizerte
                                                                Tripoli
                                      EIG                                                                                                                                         UNITY
                                                                                                                                                                                                     San Luis
                               Tajoura                                                                                                                                                                Obispo
                                         Alexandria
                                                             Suez
                                                                                  Fujairah
                                                                                             Karachi
                                                                                                                                                            SJC
                                                                                                                                        Hong Kong                                 Hawaii
                                                                                                                 Cox’s Bazaar
                                                                             Muscat                                                                    La Union

                                                                                                                                                                            AAG
                                                Port Sudan          Jeddah
                                                                                        E              Mumbai
                                                                                                                                                                        Guam
                                                                                    W
                                                                              I   ME                                                                  Nasugbu

                                                                                                                                           C
                                                                                            W4

                                                                                                                                       AAG
                                                                                                                                        SJ
                                                                                                                           Sri Racha

                                                            Djibouti                     SM            Chennai                 Vung Tau
                                                                                                                         Satun
                                                                                                       Colombo   i2 i         Songkhla
                                                                                                                           Melaka
                                                                                                                                 Kuantan
                                                                                                                 4
                                                                                                               W

                                                         Mogadishu                                                                           Tungku
                                                                                                                          Mersing
                                                                                                             SM
                                                                              y

                                                      Mombasa                                                                    Singapore
                                                                             S
                                                                          EAS

                                                Dar es Salaam
                                                                                                                                 SEA-ME-WE-4                                         Connectivity to West
                                                                             Toliary
                                                                                                                                 i-2-i                                               Connectivity to East
                                                   Maputo
                                                                                                                                 ILD minutes carried (Q4FY09)                                 2.8 Bn Min
                                                                                                                                 ILD gateways                                                          4
                                                    Mtunzini
                                                                                                                                 landing stations                                                      2

                                                                                                                                30
Mobile Services               Telemedia Services                   Enterprise Services
Performance Indicators - Carriers
                  Revenues (USD mn)                                                              EBITDA (USD mn) & Margin (%)
                                                                                                 34.5     32.2     32.0      43.9   43.2   45.4   45.1
400.0
                                                                                    160.0                                                  158    155
                                                          348                                                                       144
360.0                                           334                  344            140.0                                     135
                                   308                                              120.0
320.0
                                                                                    100.0
280.0                                                                                80.0                  72           79
                           247                                                                   68
240.0             223                                                                60.0
         197                                                                         40.0
200.0
                                                                                     20.0
160.0                                                                                 0.0
        Q208      Q308    Q408    Q109      Q209          Q309       Q409                       Q208      Q308      Q408     Q109   Q209   Q309   Q409

                                                      Voice Minutes on Network

                                       12,000                                               11,349 11,609 11,690
                                                                                 10,322
                                       10,000                            9,398
                                                           7,898
                                        8,000     6,774
                                        6,000

                                        4,000
                                                                                    2,048       2,284    2,603    2,772
                                                                 1,591     1,850
                                        2,000         1,345
                                           0
                                                  Q208        Q308       Q408      Q109        Q209     Q309     Q409

                                                                 NLD Minutes (mn)      ILD Minutes (mn)

                                                                                          31
Mobile Services   Telemedia Services   Enterprise Services
Enterprise Services - Corporates

Mobile services                        Voice services

Satellite services                     Managed data &
                                       Internet services

                                                             competition                        limited
                                                             segment       one stop telecom solution
                                                             target        2,000 top large corporates
  Managed e -                      Managed customized        leveraging                integrated play
business services                  integrated solutions

                                                               32
Mobile Services   Telemedia Services   Enterprise Services
Performance Indicators - Corporates
                  Revenues (USD mn)                                         EBITDA (USD mn) & Margin (%)

                                                                            41.9   41.9   57.0   45.7   41.4   42.9   49.3
                                                                     60.0
120.0

                                                                     40.0
100.0                                          96                                          42
                                                                                                         40            40
                                                                                                  35            34
                                                        80     81            28    27
 80.0                       74         76                            20.0
          67
                   65

 60.0                                                                 0.0
         Q208     Q308     Q408    Q109       Q209     Q309   Q409          Q208   Q308   Q408   Q109   Q209   Q309   Q409

                                                                      33
Mobile Services   Telemedia Services    Enterprise Services
Passive Infrastructure Services

                                                             34
Mobile Services   Telemedia Services   Enterprise Services
A snapshot
 ‰ Bharti Infratel operates in 11 circles.
 ‰ Indus Tower operates in 16 circles.
 ‰ Standard Master Services Agreement with competitive rates already in place.
 ‰ Key focus areas:
         ‰        To increase sharing factor (tenancy) from current levels of 1.34 for Infratel and 1.48 for Indus.
         ‰        Provide energy optimization solutions and other network management services.
         ‰        Evaluate other revenue streams.
         ‰        To reduce sharing revenue per sharing operator through increased sharing factor and
                  efficiencies
 ‰ Key performance Indicators (Infratel):
         ‰        Total Towers: 27,548 (nos)
         ‰        Sharing Factor: 1.34
         ‰        Sharing Revenue per sharing operator per month at Rs. 33,586.
         ‰        EBITDA margin: 40.1%
 ‰ Key performance Indicators (Indus):
         ‰        Total Towers: 95,154 (nos)
         ‰        Sharing Factor: 1.48

  Aim to be the preferred choice of vendor for all existing and new operators

                                                                 35
Mobile Services    Telemedia Services   Enterprise Services
Recent Honours

                                                             36
Mobile Services   Telemedia Services   Enterprise Services
Bharti Airtel – Leadership in business                                                                             Recent Honours

                                                                                                           Bharti Airtel and IFFCO JV
Awarded with top honors at the                         Adjudged Wireless Service                           bagged the “Best Content
GSMA Mobile World Congress                             Provider of the Year 2009 -                        Service” award and Gujrat E-
Conference 2008 in Barcelona                           Frost & Sullivan Asia Pacific                        Gram project executed by
for the category “Best Billing/                                ICT Awards                                     Bharti Airtel won “Best
  Customer Care solution”                                    ( in recognition of innovation, vision ,
                                                                                                          Project Management” award
                                                                    strategy and profitability)
                                                                                                          at the world Communications
                                                                                                                Awards at London
   Best Cellular Service
     Provider and Best
    Broadband Service
                                                       Voted as the India’s Most
  Provider at the 2008 V&D                                                                              Sunil Bharti Mittal, Chairman &
                                                       Innovative company in a
        100 Awards                                                                                      Group CEO
                                                       survey conducted by Wall
                                                            Street Journal                              • GSM Association Chairman’s
                                                                                                        Award 2008
                                                                                                        • Chosen for Padma Bhushan Awards
                                                                                                        in 2007
Best Carrier India at the                            Won Platinum Trusted
Telecom Asia Award 2008                              Brand Award in Mobile                              Sarvjit Dhillon, Group Director
                                                   Service Provider category in                         • Best Performing CFO in Telecom
                                                   Reader Digest Asia Trusted                           sector by CNBC-TV18 in Mar’09
                                                         Brand’s Survey

                                                                                     37
Mobile Services   Telemedia Services   Enterprise Services
Disclaimer
The information contained in this presentation is only current as of its date. All actions and statements made herein or otherwise shall be subject to the
applicable laws and regulations as amended from time to time. There is no representation that all information relating to the context has been taken
care off in the presentation and neither we undertake any obligation as to the regular updating of the information as a result of new information, future
events or otherwise. We will accept no liability whatsoever for any loss arising directly or indirectly from the use of, reliance of any information
contained in this presentation or for any omission of the information. The information shall not be distributed or used by any person or entity in any
jurisdiction or countries were such distribution or use would be contrary to the applicable laws or Regulations. It is advised that prior to acting upon this
presentation independent consultation / advise may be obtained and necessary due diligence, investigation etc may be done at your end. You may
also contact us directly for any questions or clarifications at our end.
This presentation contain certain statements of future expectations and other forward-looking statements, including those relating to our general
business plans and strategy, our future financial condition and growth prospects, and future developments in our industry and our competitive and
regulatory environment. In addition to statements which are forward looking by reason of context, the words ‘may, will, should, expects, plans, intends,
anticipates, believes, estimates, predicts, potential or continue’ and similar expressions identify forward looking statements.
Actual results, performances or events may differ materially from these forward-looking statements including the plans, objectives, expectations,
estimates and intentions expressed in forward looking statements due to a number of factors, including without limitation future changes or
developments in our business, our competitive environment, telecommunications technology and application, and political, economic, legal and social
conditions in India. It is cautioned that the foregoing list is not exhaustive
This presentation is not being used in connection with any invitation of an offer or an offer of securities and should not be used as a basis for any
investment decision.

 “The information contained herein does not constitute an offer of securities for sale in the United States. Securities may not be sold in the United
 States absent registration or an exemption from registration under the U.S. Securities Act of 1933, as amended. Any public offering of securities to be
 made in the United States will be made by means of a prospectus and will contain detailed information about the Company and its management, as well
 as financial statements. No money, securities or other consideration is being solicited, and, if sent in response to the information contained herein, will
 not be accepted.”

Investor Relations :- http://www.bhartiairtel.in
For any queries, write to: ir@bharti.in
Option in emerging markets….
 9 Renewed effort of possible partnership between Bharti and MTN

 9 Potential transaction between the two would create a leading telecommunications service
 provider with combined subscriber base of over 200 million and revenues of over $20
 billion.

 9 Pursuant to the scheme, Bharti will acquire a stake of 49% in the enlarged capital of MTN
 and in turn, give MTN & its shareholders 36% economic interest in Bharti.

 9 Bharti would have substantial participatory and governance rights in MTN enabling it to
 fully consolidate the accounts of MTN

 9 MTN would have appropriate representation on the Bharti Board.

 9 Both the companies will stand to benefit from sharing each other’s best practices in
 addition to savings from enhanced scale.

 9 The two companies have decided to discuss the potential transaction exclusively with
 each other until 31st July 09.

   Discussion at an early stage and may or may not lead to any transaction
                                                              39
 Mobile Services   Telemedia Services   Enterprise Services
You can also read