Cover 1Q 2021 Business Updates - 30 April 2021 - Far East Hospitality Trust ...
←
→
Page content transcription
If your browser does not render page correctly, please read the page content below
Cover

        Business Updates
        1Q 2021
        30 April 2021
Important Notice

Information contained in this presentation is intended solely for your personal reference and is strictly confidential. The information and opinions in this presentation are subject to change without notice, its accuracy
is not guaranteed and it may not contain all material information concerning Far East Hospitality Trust (the “Trust”), a stapled group comprising Far East Hospitality Real Estate Investment Trust and Far East
Hospitality Business Trust. Neither FEO Hospitality Asset Management Pte. Ltd. (the “Manager”), FEO Hospitality Trust Management Pte. Ltd. (the “Trustee-Manager”, and together with the Manager, the
“Managers”), the Trust nor any of their respective affiliates, advisors and representatives make any representation regarding, and assumes no responsibility or liability whatsoever (in negligence or otherwise) for, the
accuracy or completeness of, or any errors or omissions in, any information contained herein nor for any loss howsoever arising from any use of these materials. By attending or viewing all or part of this
presentation, you are agreeing to maintain confidentiality regarding the information disclosed in this presentation and to be bound by the restrictions set out below. Any failure to comply with these restrictions may
constitute a violation of applicable securities laws.

The information contained in these materials has not been independently verified. No representation or warranty, expressed or implied, is made as to, and no reliance should be placed on, the fairness, accuracy,
completeness or correctness of, the information or opinions contained herein. None of the Trust, the Managers, DBS Trustee Limited (as trustee of Far East Hospitality Real Estate Investment Trust), Far East
Organization, controlling persons or affiliates, nor any of their respective directors, officers, partners, employees, agents, advisers or representatives shall have any liability whatsoever (in negligence or otherwise)
for any loss howsoever arising, whether directly or indirectly, from any use, reliance or distribution of this presentation or its contents or otherwise arising in connection with this presentation. It is not the intention to
provide, and you may not rely on these materials as providing a complete or comprehensive analysis of the Trust's financial or trading position or prospects. The information and opinions contained in these materials
are provided as at the date of this presentation and are subject to change without notice. Nothing contained herein or therein is, or shall be relied upon as, a promise or representation, whether as to the past or the
future and no reliance, in whole or in part, should be placed on the fairness, accuracy, completeness or correctness of the information contained herein. Further, nothing in this document should be construed as
constituting legal, business, tax or financial advice. None of the Joint Bookrunners or their subsidiaries or affiliates has independently verified, approved or endorsed the material herein.

Nothing in this presentation constitutes an offer of securities for sale in Singapore, United States or any other jurisdiction where it is unlawful to do so.

The information in this presentation may not be forwarded or distributed to any other person and may not be reproduced in any manner whatsoever. Any forwarding, distribution or reproduction of this information in
whole or in part is unauthorised. Failure to comply with this directive may result in a violation of the Securities Act or the applicable laws of other jurisdictions.

This presentation contains forward-looking statements that may be identified by their use of words like “plans,” “expects,” “will,” “anticipates,” “believes,” “intends,” “depends,” “projects,” “estimates” or other words of
similar meaning and that involve assumptions, risks and uncertainties. All statements that address expectations or projections about the future and all statements other than statements of historical facts included in
this presentation, including, but not limited to, statements about the strategy for growth, product development, market position, expenditures, and financial results, are forward-looking statements. Such forward-
looking statements are based on certain assumptions and expectations of future events regarding the Trust's present and future business strategies and the environment in which the Trust will operate, and must be
read together with those assumptions. The Managers do not guarantee that these assumptions and expectations are accurate or will be realized. Actual future performance, outcomes and results may differ
materially from those expressed in forward-looking statements as a result of a number of risks, uncertainties and assumptions. Although the Managers believe that such forward-looking statements are based on
reasonable assumptions, it can give no assurance that such expectations will be met. Representative examples of these risks, uncertainties and assumptions include (without limitation) general industry and
economic conditions, interest rate trends, cost of capital and capital availability, competition from other companies, shifts in customer demands, customers and partners, changes in operating expenses including
employee wages, benefits and training, governmental and public policy changes and the continued availability of financing in the amounts and the terms necessary to support future business. Predictions, projections
or forecasts of the economy or economic trends of the markets are not necessarily indicative of the future or likely performance of the Trust. Past performance is not necessarily indicative of future performance. The
forecast financial performance of the Trust is not guaranteed. You are cautioned not to place undue reliance on these forward-looking statements, which are based on the Managers’ current view of future events.
The Managers do not assume any responsibility to amend, modify or revise any forward-looking statements, on the basis of any subsequent developments, information or events, or otherwise.

This presentation is for information purposes only and does not constitute or form part of an offer, solicitation or invitation of any offer, to buy or subscribe for any securities, nor should it or any part of it form the basis
of, or be relied in any connection with, any contract or commitment whatsoever. Any decision to invest in any securities issued by the Trust or its affiliates should be made solely on the basis of information contained
in the prospectus to be registered with the Monetary Authority of Singapore (the “MAS”) after seeking appropriate professional advice, and you should not rely on any information other than that contained in the
prospectus to be registered with the MAS.

These materials may not be taken or transmitted into the United States, Canada or Japan and are not for distribution, directly or indirectly, in or into the United States, Canada or Japan.

These materials are not an offer of securities for sale into the United States, Canada or Japan. The securities have not been and will not be registered under the Securities Act and, subject to certain exceptions, may
not be offered or sold within the United States. The securities are being offered and sold outside of the United States in reliance on Regulation S under the United States Securities Act of 1933, as amended. There
will be no public offer of securities in the United States and the Managers do not intend to register any part of the proposed offering in the United States.

This presentation has not been and will not be registered as a prospectus with the MAS under the Securities and Futures Act, Chapter 289 of Singapore and accordingly, this document may not be distributed, either
directly or indirectly, to the public or any member of the public in Singapore.

                                                                                                                                                                                                                                       2
Contents

▪ Financial Highlights

▪ Portfolio Performance

▪ Ongoing and Upcoming Projects

▪ Outlook & Prospects

                                  3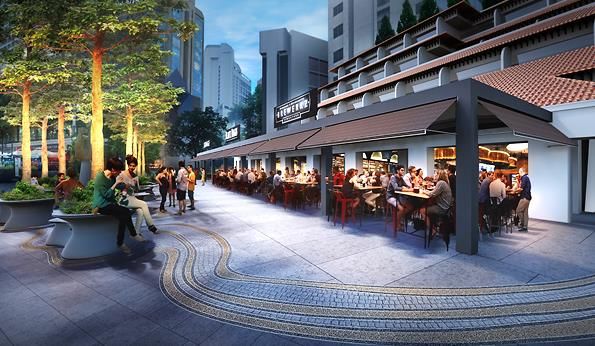
Financial Highlights
Executive Summary for 1Q 2021 – Performance vs LY

                                                      1Q 2021                    1Q 2020                  Variance
                                                       S$’000                    S$’000                      %

   Gross Revenue                                       21,303                    22,873                     (6.9)

            Hotels                                     14,250                    14,250                      -
            Serviced Residences (“SR”)                 2,884                     3,357                     (14.1)
            Commercial Premises                        4,169                     5,266                     (20.8)

   Net Property Income                                 18,199                    19,864                     (8.4)

            Finance Expenses                           (5,553)                   (7,063)                    21.4
            REIT Manager’s fees                        (2,282)                   (2,386)                     4.4

   Income Available for Distribution                   12,539                    12,671                     (1.0)

   ▪   Gross Revenue for 1Q 2021 was S$21.3 million, 6.9% lower year-on-year, due to lower occupancies in the SRs and
       rental assistance given to tenants at the commercial premises. While the master lease rental for the hotel segment
       was at the fixed rent level, the SR segment continued to perform above the fixed rent.

   ▪   Net Property Income was 8.4% lower year-on-year.

   ▪   Finance Expenses were 21.4% lower, mainly due to lower short-term interest rates. The REIT Manager’s fees were
       lower by 4.4%, due to lower value of the Deposited Property. As a result, Income Available for Distribution was
       S$12.5 million.

                                                                                                                            5
Balance Sheet summary

                                                                        As at 31 Mar 2021                       As at 31 Dec 2020
                                                                             S$’ million                             S$’ million

    Total Assets                                                               2,578.2                                 2,581.4

            Comprising:

            Investment Properties1                                             2,527.8                                 2,528.7
            Joint Venture                                                         2.8                                     4.1

            Cash and Cash Equivalents                                             7.1                                    10.9

            Trade and other receivables2                                         39.3                                    37.6

            Other Assets                                                          1.2                                     0.1

    Total Liabilities                                                          1,030.4                                 1,023.7

    Net Assets                                                                 1,547.8                                 1,557.7

    NAV per Stapled Security (S$)                                                0.79                                    0.79

   (1)   Investment properties based on valuation as at 31 December 2020 appraised by Savills Valuation And Professional Services (S) Pte
         Ltd or Knight Frank Pte Ltd, and adjustment to capital expenditure capitalised previously.

   (2)   This includes a shareholders’ loan and accrued interest due from Fontaine Investment Pte Ltd of S$30.7 million (S$30.6 million as at
         31 Dec 2020).
                                                                                                                                                6
Capital Management
 As at 31 Mar 2021                                                                               Debt Maturity Profile (figures in S$ million)

 Total Debt                                   S$1,008.5m

 Available revolving                                                                             210                                     225
                                               S$269.4m
 facility                                                                                                            161                                     157
                                                                             131                                                                                                 125

 Aggregate Leverage                                41.6%
                                                                            2021                2022                2023                2024                2025                2026

 Unencumbered asset                                                                                                Interest Rate Profile
                                                   100%
 as % total asset

 Proportion of fixed rate                          54.3%
                                                                                             Floating
                                                                                                                   45.7%
                                                                                             S$461.3m                                         54.3%
 Weighted average debt                                                                                                                                         Fixed
                                                2.6 years
 maturity                                                                                                                                                      S$547.2m

 Average cost of debt                               2.2%
                                                                      ▪ Refinanced the term loan of S$125 million due in March 2021 with a sustainability-linked
                                                                        loan facility for a term of 5 years.
 Interest Coverage Ratio1                           2.7x              ▪ Discussions with lenders for the refinancing of the S$100 million term loan due in Dec 2021
                                                                        are ongoing.
 1 Interest
          coverage ratio is computed based on EBITDA over interest expense as per the definition in the loan covenants. This would be 2.5x based on the definition prescribed by Appendix 6
 of the Code on Collective Investment Schemes.
                                                                                                                                                                                              7
Portfolio Performance
Portfolio Performance 1Q 2021 – Hotels
                Average Occupancy                       Average Daily Rate (ADR)                    Revenue Per Available Room
  %                                             $                                               $           (RevPAR)
100.0                                       200.0                                         200
                       +10.8pp   76.1
                                            160.0           144      -54.2%
 80.0                                                                                     160
                65.3

 60.0                                       120.0                                         120            94       -45.7%
                                                                              66
 40.0                                        80.0                                          80
                                                                                                                           51

 20.0                                        40.0                                          40

  0.0                                         0.0                                           0
            1Q 2020          1Q 2021                   1Q 2020         1Q 2021                      1Q 2020        1Q 2021

        ▪   Occupancy improved 10.8pp year-on-year to 76.1% as the hotels were able to secure contracts from companies that
            required accommodation their workers as well as from the Government for isolation purposes.

        ▪   The average daily rate (“ADR”) was 54.2% lower year-on-year at $66, reflecting the lower ADRs associated with the nature
            of business secured.

        ▪   Consequently, revenue per available room (‘RevPAR’) declined by 45.7% year-on-year at $51.

                                                                                                                                       9
Portfolio Performance 1Q 2021 – Serviced Residences
Average Occupancy Average Daily Rate (ADR) Revenue Per Available Unit
(RevPAU)
% $ $
100.0 -8.9pp
83.6 240 213 -12.2% 240
74.7 187
80.0 200 200 178 -21.3%
160 160 140
60.0
120 120
40.0
80 80
20.0
40 40
0.0 0 0
1Q 2020 1Q 2021 1Q 2020 1Q 2021 1Q 2020 1Q 2021
▪ The serviced residences (“SRs”) demonstrated greater resilience despite the challenging market circumstances and lack
of inbound travel. The support from long-stay corporate sources helped to minimise the negative impact of the pandemic
and kept the SRs performing above fixed rent.
▪ The average occupancy for SRs declined to 74.7% (-8.9pp year-on-year) due to the curtailment of inbound travel. ADR
fell by 12.2% to $187 due to the nature of business available. As a result, revenue per available unit (‘RevPAU’) was
21.3% lower at $140.
10Breakdown of Gross Revenue – Total Portfolio
1Q 2020 1Q 2021
Serviced Serviced
14.7% Residences Residences
13.5%
23.0% 66.9%
19.6%
62.3%
Hotels
Commercial Hotels Commercial
11Market Segmentation 1Q 2021– Hotels
Hotels (by Revenue) Hotels (by Region)
Leisure/ 2.1% 1.0% 0.5%
Independent 6.2%
11.8%
6.4%
SE Asia
S Asia
N Asia
15.5%
Europe
Oceania
N America
Others
Corporate
88.2% 68.3%
▪ The corporate segment contributed 88.2% to the overall hotel revenue. This was mainly from the Government
contracts and from companies requiring accommodation for their workers. Border closures continued to limit Leisure
travel bookings.
▪ The proportion of revenue contribution from South-East Asia increased significantly reflecting the nature of business
available due to increased travel restrictions.
12Market Segmentation 1Q 2021– Serviced Residences
Serviced Residences (by Revenue) Serviced Residences (by Industry)
Leisure/ Services, 17.8%
Independent Others,
21.0% 28.6%
Banking &
Logistics, 3.1% Finance, 15.1%
Corporate
79.0% Electronics &
Manufacturing, FMCG, 12.4%
11.3%
Oil & Gas,
11.7%
▪ Revenue contribution by the Corporate segment was 79.0% in 1Q 2021, up from 73.3% a year ago, supported by pre-
existing long leases and lease extensions by corporate accounts. Contribution by the Independent segment dropped
from 26.7% to 21.0%, due to general restrictions on cross-border travel.
▪ The FMCG and Oil & Gas industries delivered a year-on-year increase in percentage revenue contribution for the
quarter.
13Ongoing and Upcoming Projects
Ongoing and Upcoming Projects

             The Elizabeth Hotel
 Upgrading of rooms, reception and common areas

                                                  Artist impression of upgraded room

Artist impression of upgraded lobby

                                                                                       15
Ongoing and Upcoming Projects
Orchard Rendezvous Hotel
Enhancement to outdoor refreshment area
(“ORA”) and forecourt
Artist Impression of ORA and forecourt
16Ongoing and Upcoming Projects
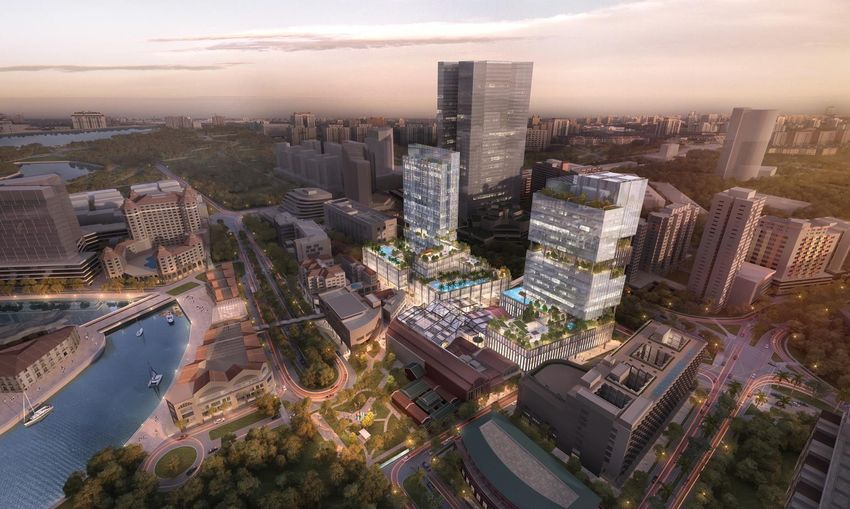
Central Square
Outline Advice issued by URA under the
Strategic Development Incentive Scheme
▪ An Outline Advice has been
issued by URA in relation to
Central Square under the
Strategic Development Incentive
Scheme in response to a joint
application.
▪ The proposed plan is intended to
rejuvenate the precinct with an
integrated development and
involves a potential rezoning and
uplift in GFA, subject to approvals
from the relevant authorities.
▪ The REIT Manager will explore
various options for the site to
deliver optimal value for stapled
securityholders.
Artist Impression of Redeveloped Precinct
17Outlook & Prospects
Pace of vaccinations on an upward trend globally
▪ The pace of vaccinations has
been trending upwards in
2021.
▪ As of 27 Apr 21, the US, China
and India have each
administered more than 100m
doses of vaccinations as they
ramp-up their vaccination
drives to achieve herd
immunity.
▪ Singapore started vaccinations
in Dec 20 and has targeted to
inoculate its entire population
by 3Q 2021. As of 27 Apr 21,
Singapore had administered
2.21m doses of vaccinations
and had 850k residents fully
vaccinated against COVID-19.
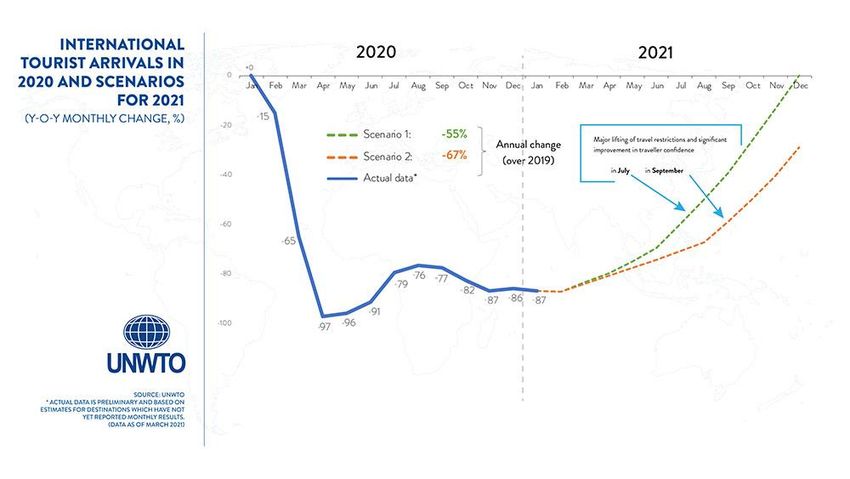
Sources : Our World in Data Covid Vaccinations (https://ourworldindata.org/covid-vaccinations) 19International arrivals could start recovery in 2H 2021
▪ UNWTO expects international tourist arrivals to be down 85% in 1Q 2021 compared to pre-
COVID levels but outlined two scenarios for a possible rebound in 2H 2021.
▪ Forecasts hinge on major lifting of travel restrictions, success of vaccination programmes and
widespread use of vaccination passports/certificates.
Sources : UNTWO (https://www.unwto.org/news/tourist-arrivals-down-87-in-january-2021-as-unwto-calls-for-stronger-coordination-to-restart-tourism) 20Airline passenger capacity continues to grow
3,500 30.0%
SIA Group passenger capacity (% of pre-Covid)
3,000
25.0%
Available Seat Kilometre (“ASK”) (m)
2,500
20.0%
2,000
15.0%
1,500
10.0%
1,000
5.0%
500
- 0.0%
Apr-20 May-20 Jun-20 Jul-20 Aug-20 Sep-20 Oct-20 Nov-20 Dec-20 Jan-21 Feb-21
Series1
ASK Series2
% of pre-COVID
▪ As the main conduit for arrivals in Singapore, airlines’ passenger capacity is a leading indicator for the recovery in
cross-border travel.
▪ SIA Group passenger capacity continues to improve month-on-month. SIA is targeting to achieve ~25% of pre-
Covid capacity by April 2021.
Sources : Singapore Airlines Limited 21Travel arrangements mostly unilateral now
Country Arrangement Conditions/Restrictions of entry
Quarantine-free travel
Hong Kong Air Travel Bubble Remain in either city 14 days (excl. quarantine) before
departure, 1 flight of 200 pax daily
No entry to Australia unless traveller is in an ‘exempt’ category
Air Travel Pass
Australia (ie. Australian citizen/PR/family member, NZ citizen residing in
(Travel Bubble under discussion)
Australia etc); 14-day quarantine upon arrival.
Air Travel Pass 2-14 days isolation at hotel depending on Ministry of Health’s
Brunei
Reciprocal Green Lane risk assessment
Air Travel Pass 14-day centralized quarantine upon arrival followed by 7-day
China (6 provinces)
Reciprocal Green Lane home quarantine (depending on province)
7-day Home Surveillance Order in Malaysia, 14-day Stay
Malaysia Periodic Commuting Arrangement
Home Notice in Singapore
No entry to New Zealand unless traveller is in an ‘exempt’
New Zealand (“NZ”) Air Travel Pass category (ie. NZ citizen/PR/family member, Australian citizen
residing in NZ, etc); 14-day quarantine upon arrival
All except UK / South Only for business and official travel of up to 14 days and
Connect@Singapore
Africa allowed to stay only within a ‘bubble’ at Appointed Facilities
▪ Since mid-2020, the Ministry of Foreign Affairs in Singapore established special travel arrangements with 10 countries. As
of Apr 2021, over 18,200 travellers have entered Singapore under the Air Travel Pass scheme with 70% of the total
number from China.
▪ The resurgence of COVID-19 and emergence of new strains has led to the suspensions of certain arrangements.
Remaining travel arrangements are mostly unilateral with various restrictions on travellers arriving from Singapore.
▪ The Air Travel Bubble with Hong Kong starting on 26 May 2021 is the only firm bilateral arrangement as of Apr 2021.
22Potential travel arrangements under discussion
Hong Kong Australia
Source: South China Morning Post
Taiwan
Source: Business Traveller Asia Pacific
Malaysia
Source: TTG Asia
Source: The Straits Times
23Outlook & Prospects
Outlook for 2021
▪ Global travel restrictions expected to continue impacting demand with near-term business
supported by government contracts and long-stay corporate contracts.
▪ Widespread vaccination drives and travel arrangements expected to bring the industry closer
normalcy from Q4 2021 onwards1
▪ Further easing of capacity restrictions on MICE events allowing events of up to 750 attendees
▪ Muted average new room supply of 1,842 rooms annually from 2021 to 2024 compared to an average
of 2,400 annually from 2015 to 20191
(1) Savills report issued as at March 2021.
24Outlook & Prospects
Long-Term Outlook
▪ Future-proofing infrastructure
▪ Government strategy to future-proof local infrastructure with projects such as the Tuas Mega Port,
Terminal 5, the North South Corridor, and the Cross Island MRT line
▪ Growing business hub
▪ Decade-high S$17.2 billion in fixed asset investments secured in 2020 despite COVID-19
▪ Regional headquarters for firms which are critical nodes in the global value chain such as Alibaba
(technology), Pfizer (pharmaceutical), Micron (electronics), and DHL (logistics)
▪ New infrastructure projects and investments will drive demand for accommodation from corporate
travellers and project groups
▪ Expanding tourism offerings
▪ Major expansion of key tourism areas such as the Mandai precinct, Sentosa (including development of
Pulau Brani, collectively known as the Greater Southern Waterfront project), and the Integrated Resorts
25Thank You
For more information please visit
http://www.fehtrust.comFar East H-Trust Asset Portfolio Overview
Hotels
Orchard Rendezvous Total /
Village Hotel Village Hotel The Elizabeth Village Hotel Oasia The Oasia Hotel
Rendezvous Hotel Weighted
Albert Court Changi Hotel Bugis Hotel Novena Quincy Hotel Downtown
Hotel Singapore Average
Mid-tier / Mid-tier /
Market Segment Mid-tier Mid-tier Mid-tier Mid-tier Upscale Upscale Upscale NA
Upscale Upscale
1 Netheravon 24 Mount 22 Mount Elizabeth 9 Bras Basah
180 Albert Street, 390 Victoria Street, 8 Sinaran Drive, 1 Tanglin Road, 100 Peck Seah St,
Address Road, Elizabeth, S’pore Road, S’pore Road, S’pore
S’pore189971 S’pore 188061 S’pore 307470 S’pore 247905 S’pore 079333
S’pore 508502 228518 228517 189559
Date of Completion 3 Oct 1994 30 Jan 19902 3 May 1993 19 Oct 1988 2 June 2011 20 June 19872 27 Nov 2008 5 June 20002 30 Dec 2015
# of Rooms 210 380 256 393 428 388 108 298 314 2,775
Lease Tenure1 67 years 57 years 67 years 58 years 84 years 42 years 67 years 63 years 62 years NA
GFA/Strata Area (sq m) 11,426 22,826 11,723 21,676 22,457 34,072 4,810 19,720 17,793
Retail NLA (sq m) 1,003 805 583 1,164 NA 3,778 NA 2,799 NA 10,132
Office NLA (sq m) NA NA NA NA NA 2,515 NA NA NA 2,515
First Choice Far East Golden Transurban Golden Far East
Golden Landmark Far East Orchard Serene Land Pte
Master Lessee / Vendor Properties Organization Development Properties Development SOHO
Pte. Ltd. Limited Ltd
Pte Ltd Centre Pte. Ltd. Private Limited Pte. Ltd. Private Limited Pte Ltd
Valuation (S$ ‘mil)1 121.1 192.1 161.2 223.0 309.0 406.6 77.8 270.0 242.2 2,003.0
1 As at 31 December 2020
2 Date of acquisition by Sponsor, as property was not developed by Sponsor
27Far East H-Trust Asset Portfolio Overview
Serviced Residences
Village Residence Village Residence Village Residence Regency Total /
Clarke Quay Hougang Robertson Quay House Weighted Average
Market Segment Mid-tier Mid-tier Mid-tier Upscale NA
20 Havelock Road, 1 Hougang Street 91, 30 Robertson Quay, 121 Penang House,
Address
S’pore 059765 S’pore 538692 S’pore 238251 S’pore 238464
Date of Completion 19 Feb 1998 30 Dec 1999 12 July 1996 24 Oct 2000
# of Rooms 128 78 72 90 368
Lease Tenure1 72 years 73 years 70 years 73 years NA
GFA/Strata Area (sq m) 17,858 14,257 10,570 10,723 53,408
Retail NLA (sq m) 2,213 NA 1,179 539 3,931
Office: 1,473
Office NLA (sq m) NA NA 2,291 4,587
Serviced Office: 823
Master Lessee / Vendor OPH Riverside Pte Ltd Serene Land Pte Ltd Riverland Pte Ltd Oxley Hill Properties Pte Ltd
Valuation (S$ ‘mil) 1 198.3 61.5 102.9 163.0 525.7
1 As at 31 December 2020
28You can also read