WENTWORTH RESOURCES PLC - INVESTOR PRESENTATION - April 2019
←
→
Page content transcription
If your browser does not render page correctly, please read the page content below
April 2019

WENTWORTH
RESOURCES PLC
INVESTOR PRESENTATION
2
Disclaimer
The information set out in this presentation (the “Presentation”) has been produced by Wentworth Resources Limited (the “Company” or “Wentworth”) as at 14 Feb-19, and is being made available to recipients for information purposes only.
It does not constitute, nor is it intended to be an offer to sell, or an invitation to subscribe for, or purchase any securities in the Company. The information set out in this Presentation has not been independently verified and may be subject to
updating, completion, revision and amendment. The Presentation does not purport to summarize all the conditions, risks and other attributes of an investment in the Company.

The Presentation and its contents are strictly confidential and may not be reproduced or redistributed, in whole or in part, to any other person. By receiving this Presentation you acknowledge that you will be solely responsible for your own
assessment of the market and the market position of the Company and that you will conduct your own analysis and be solely responsible for forming your own view of the potential future performance of the Company’s business. The
distribution of the Presentation may in certain jurisdictions be restricted by law. Persons into whose possession the Presentation may come are required by the Company to inform themselves about, and to comply with all applicable laws and
regulations in force in any jurisdiction in or from which they invest or receive or possess the Presentation and must obtain any consent, approval or permission required under the laws and regulations in force in such jurisdiction, and the
Company shall not have any responsibility or liability for these obligations. No representation or warranty (express or implied) is made as to, and no reliance should be placed on, any information including projections, estimates, targets and
opinions, contained herein, and no liability whatsoever is accepted as to any errors, omissions or misstatements contained herein, and, accordingly, none of Wentworth or any of its directors, officers or employees accept any responsibility for
the information, statements, matters, facts or opinions stated herein, or any liability whatsoever arising directly or indirectly from the use of or any act or omission undertaken in reliance on the Presentation.

Certain of the information contained herein may include forward-looking statements relating to the business, financial performance and results of the Company and/or the industry in which it operates. Forward-looking statements concern
future circumstances and results and other statements that are not historical facts, sometimes identified by the words “believes”, expects”, “predicts”, “intends”, “projects”, “plans”, “estimates”, “aims”, “foresees”, “anticipates”,
“targets”, “may”, “will”, “should” and similar expressions. The forward-looking statements contained in the Presentation, including assumptions, opinions and views of the Company or cited from third party sources are solely opinions and
forecasts which are subject to risks, uncertainties and other factors that may cause actual events to differ materially from any anticipated development. The forward-looking statements in this Presentation are based on certain assumptions
including but not limited to expectations and assumptions concerning prevailing and future commodity prices and exchange rates, applicable royalty and tax rates, future well production rates, the performance of existing and future wells,
the sufficiency of budgeted capital expenditures, the availability and cost of labor, services and equipment, adequate weather and environmental conditions and ability to successfully construct or expand facilities. None of the Company or
any of its subsidiaries or any directors, officers or employees thereof provide any assurance that the assumptions underlying such forward-looking statements are free from errors, nor do any of them accept any responsibility for the future
accuracy of the opinions expressed in the Presentation or the actual occurrence of the forecasted developments. Given these uncertainties, prospective investors are cautioned not to place any undue reliance on such forward-looking
statements. Neither the Company nor its directors or officers assume any obligation to update any forward-looking statements or to conform these forward-looking statements to the Company’s actual results.

AN INVESTMENT IN THE COMPANY INVOLVES RISK, AND SEVERAL FACTORS COULD CAUSE THE ACTUAL RESULTS, PERFORMANCE OR ACHIEVEMENTS OF THE COMPANY TO BE MATERIALLY DIFFERENT FROM ANY FUTURE RESULTS, PERFORMANCE OR
ACHIEVEMENTS THAT MAY BE EXPRESSED OR IMPLIED BY STATEMENTS AND INFORMATION IN THIS PRESENTATION. SHOULD UNDERLYING ASSUMPTIONS ON WHICH THIS PRESENTATION IS BASED PROVE INCORRECT, ACTUAL RESULTS MAY VARY
MATERIALLY FROM THOSE DESCRIBED IN THIS PRESENTATION, AND INVESTORS IN THE COMPANY MUST BE PREPARED TO LOSE ALL OR PART OF THEIR INVESTMENTS. THE COMPANY DOES NOT INTEND, AND DOES NOT ASSUME ANY OBLIGATION, TO
UPDATE OR CORRECT THE INFORMATION INCLUDED IN THE PRESENTATION.

Certain information on a non-exhaustive list and summary of assumptions and risk factors that could affect the operations or financial results of Wentworth are included in Wentworth’s corporate filings which are available on its website at
www.wentplc.com. This document is being distributed to, and is directed only at: (i) persons in member states of the European Economic Area (“EEA”) who are “professional clients within the meaning of Part I and II and Annex II of the MIFID
directive (directive 2004/39/etc.) (“professional clients”); or (ii) persons in the United States who are “qualified institutional buyers” as defined in Rule 144A under the U.S. Securities Act of 1933, as amended (the “Securities Act”). Any
person in the EEA who receives this document will be deemed to have represented and agreed that they are a professional client. Any such recipient will also be deemed to have represented and agreed that they have not received this
document on behalf of persons in the EEA other than professional clients or persons in the United Kingdom and other member states (where equivalent legislation exists) for whom the investor has authority to make decisions on a wholly
discretionary basis. The Company and its affiliates and others will rely upon the truth and accuracy of the foregoing representations and agreements. Any person in the EEA who is not a professional client should not act or rely on this
document or any of its contents. With respect to the United Kingdom, the information set out in this Presentation has not been written or approved by an authorized person (as defined in the United Kingdom Financial Services and Markets Act
2000). It is considered by the Company that the communication of the Presentation will be exempt from the financial promotion restriction (as defined in Section 21(1) of the Financial Services and Markets Act 2000, as amended) pursuant to
Article 69 of the Financial Services and Markets Act 2000 (Financial Promotions) Order 2005 (the “Order”), as the Company’s shares are admitted to trading on the London Stock Exchange’s Alternative Investment Market (AIM). Any investment
or investment activity to which this document relates is only available in the United Kingdom to such persons as are permitted under the Order (“Relevant Persons”) and will be engaged only with such persons within the United Kingdom.
Persons who are not (within the United Kingdom) Relevant Persons should not in any circumstances rely on this Presentation. The contents of the Presentation are not to be construed as legal, business, investment or tax advice. Each recipient
should consult with their own legal, business, investment and tax adviser as to legal business, investment and tax advice. By receiving the Presentation you acknowledge that you will be solely responsible for your own assessment of the
market and the market position of the Company and that you will conduct your own analysis and be solely responsible for forming your own view of the potential future performance of the Company’s business.

The securities mentioned herein have not been, and will not be, registered under the Securities Act or under any U.S. state securities laws, and may not be offered or sold in the United States unless they are registered under the Securities
Act or pursuant to an exemption from or in a transaction not subject to the registration requirements of the Securities Act. The securities have not been approved or recommended by the U.S. Securities and Exchange Commission nor any U.S.
state securities commission or regulatory authority, nor have any of the foregoing authorities passed on the accuracy of this Presentation. Any representation to the contrary is a criminal offence.

The information contained in this Presentation does not constitute or form part of, and should not be construed as, an offer or invitation to subscribe for or purchase the securities discussed herein in any jurisdiction. This Presentation is
subject to English law, and any dispute arising in respect of this Presentation is subject to the exclusive jurisdiction of the English courts.

If you have received this Presentation from anyone other than the Company, your receipt is unauthorised. Please return this document to the Company immediately.

                                                                                                                                                                                                                                                          2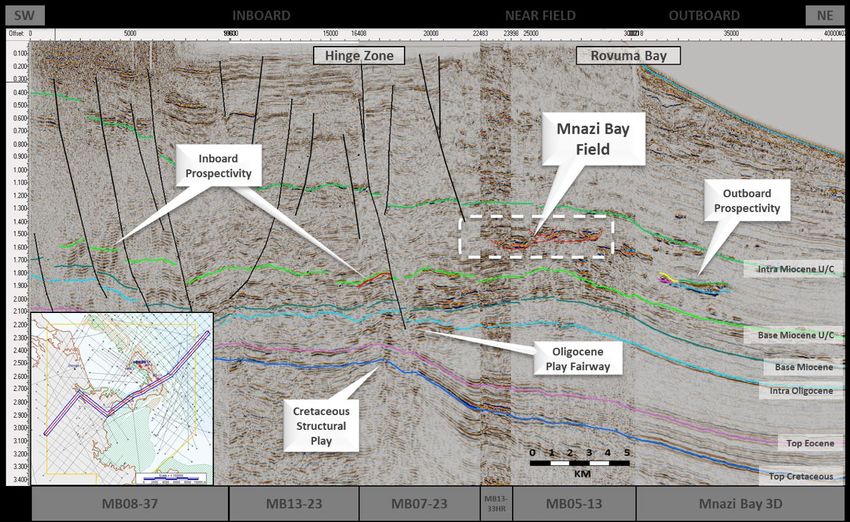
The Team
Deep and broad value delivery track record, globally from Majors to small Independents

             Eskil Jersing       Chief Executive Officer                                        Katherine Roe         Chief Financial Officer

          • 34 years experience across E&P in Africa, UK North Sea, Gulf                      • Previously VP Corporate Development & IR since 2014.
            of Mexico, DW Brazil, SE Asia and Australasia, Upstream and                       • Extensive O&G advisory and transactional experience for a
            New Business focus.                                                                 range of international companies. Most recently non-executive
          • Technical / Senior Management roles with Enterprise Oil,                            Director of Faroe Petroleum plc. 14 years’ experience in the City
            Shell International, Marathon Oil & Apache Corporation. Head                        of London including with Morgan Stanley and former Director of
            of New Ventures and Co-Head of M&A at Petrobras Oil & Gas                           Investment Banking at Panmure Gordon, heading up the Natural
            BV. CEO of AIM listed Sterling Energy plc from 2015-18.                             Resources franchise.
          • BSc in Geophysics from Cardiff University, MSc in Petroleum                       • B.Sc. Economics & Politics University of Bristol, England.
            Geology from Imperial College, London.

                                 Tanzania & Mozambique Country Manager                                                 Head of Business Development/Subsurface
            Richard Tainton      Country Manager Tanzania & Mozambique                         Cameron Snow

          • 26 years of diverse experience with engineering projects                          • Extensive experience across E&P in both conventional and
            around the world including gas and power development                         Chairman
                                                                                               unconventional assets.
            projects.                                                                         • Onshore USA, Gulf of Mexico, Canada, South America & Africa
          • Proven experience in the development and management of                              experience through roles with Apache, SDX Energy, and First
            integrated gas-to-power projects in Africa and Central Asia,                        Alpha Energy.
            including working with Government Agencies and Regulatory                         • BSc in Geology from NC State University, MSc in Geology from
            Authorities. Skilled negotiator and energy asset manager.                           Utah State University, PhD in Geology from Stanford University,
          • MSc Mining Engineering Degree from University of the                                and MBA from Imperial College London.
            Witwatersrand, Johannesburg.

                                                                                                                                                                  3
African focused, Domestic gas led E&P Company
At a glance

          Producing Tanzanian gas asset, c. 4,425 boepd1. Key
          supplier in surging demand-led landscape

               Sustainable revenues (2019e US$ 17-20mm, US$11.8
               mm cash. Net cash. Zero debt Q1 2020)2

                 Mnazi Bay reserves 2P 100Bcf (GSA/PSA to 2031 &
                 1.5Tcf unrisked upside2) 2P NPV15 US$106mm3

                 Robust fundamentals: 2019e P/FCF of c.2.5, c.61%
                 share price to core & contingent NAV4

               Strong shareholder roster (Vitol, AXA, Sustainable
               Capital, Invesco, Fidelity)

          Focus on revenue stream diversification, capital growth
          and returns from H2 2019

                                                                    1 Avg. daily net WI production 2018
                                                                    2 Management estimates 31 Dec-18
                                                                    3 RPS Canada CPR 31 Dec-18 (E.I.)
                                                                    4Stifel 229 Mar--19                   4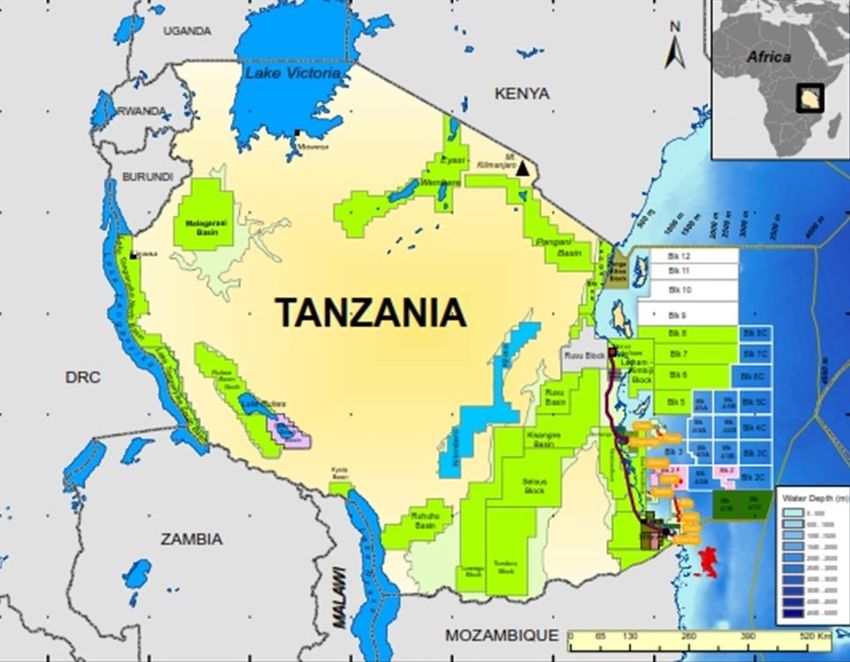
2019 Guidance: Simpler platform, robust fundamentals
     Refreshed for growth & capital returns

              Avg. Net Production (boepd)*                                           G&A (US$ mm)*                                              Debt (US$ mm)*
    5,000                                                          10                                                           30.00

    4,000
                                                                                                                                25.00
                                                                    8
                                                                                                                                20.00
    3,000                                                           6
                                                                                                                                15.00
    2,000                                                           4
                                                                                                                                10.00
    1,000                                                           2                                                            5.00
       0                                                            0                                                              -
            2014     2015       2016      2017     2018   2019           2014    2015     2016     2017      2018        2019           2014   2015     2016     2017   2018    2019
                   2019 Guidance 75-85 mmscfd (gross)                      2018 Transition & Redomicile “exceptionals”                                Debt free 2020

                                                                                  Revenues (US$ mm)                                             Cash (US$ mm)
                       Opex (US$ / mcf)
                                                                                                                                15.00
    14.00    12.81
                                                                 20.00
    12.00
    10.00                                                        15.00                                                          10.00

     8.00
                                                                 10.00
     6.00                                                                                                                        5.00
     4.00                2.28                                     5.00
     2.00                              0.92      0.84     0.44
                                                                    -                                                              -
       -
             2014        2015          2016      2017     2018            2014      2015       2016       2017       2018               2014    2015     2016      2017        2018
                                                                             2019 Completion of Ziwani “carry” repayments                         2019 Debt pay down
                        High margins (@$3.18/mcf)

*Management estimates for YE 2019                                                                                                                                                      5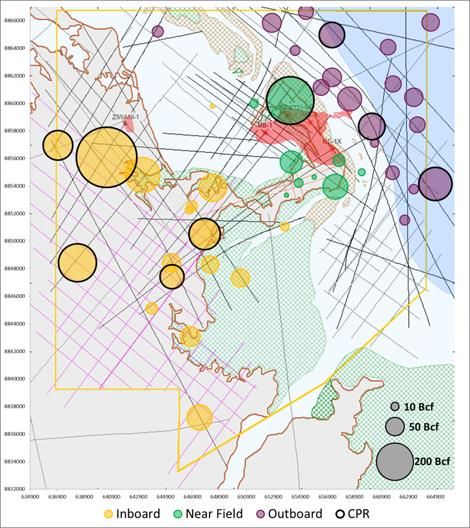
Mnazi bay gas producing asset
Strategically located in a rapidly developing world class gas region

 • Q4 2018 Avg. net 4,650 boepd production
 • NPV15 2P US$106 MM (after tax) 1
 • 2P 100 Bscf, 16.6 Mmboe1
 • 3P gross sales gas of ca.761 Bcf1

 •   Production Sharing Agreement (PSA) with Tanzanian Petroleum Development Corporation (TPDC) Long-term
     GSA (to 20312) with net back price of US$3 / mscf plus 2% p.a. plus annual CPI escalation. Currently US$ 3.18
     for Madimba (TPDC) and US$5.36 for Mtwara (TANESCO)
 •   Contracted to supply 80mmscfd & 2.5 mmscfd to Mtwara (GSA option to increase to 130mmscfd)

                     Mnazi Bay                        Maurel & Prom (Op.)                           Wentworth                   TPDC
                    Production                                 48.06%                                  31.94%                   20%
                    Exploration                               60.075%                                 39.925%

     1   Source: RPS Energy Canada Ltd. – Reserves Assessment as at Dec 31, 2018 (Life of field basis) net to Wentworth
     2   Provisions in Tanzanian Petroleum law for 10-year licence extension

                                                                                                                          893 MW from Natural Gas   Domestic gas has saved
Key Mtwara-Dar (490km                                              Natural gas contributes c.57%
                                                                                                                          573 MW from Hydropower    Tanzania c.US$4 Bn
785mmscfd capacity) pipeline                                       of power (1,565 MW) to
                                                                                                                          89 MW from Heavy Oil      between 2015-17
in place                                                           Tanzanian grid
                                                                                                                          10 MW from Biomass                                 6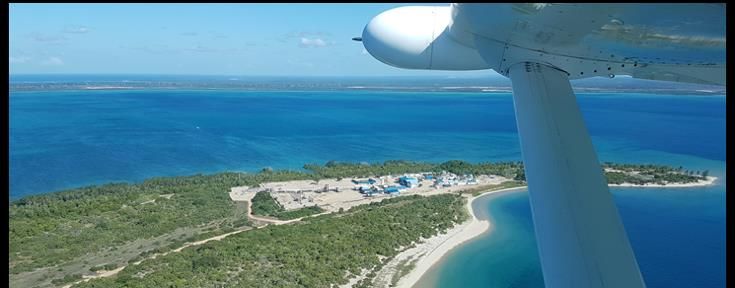
Mnazi bay gas production
    Average quarterly gas production (mmscfd)

                                              Q1 2019 Temporary decline due maintenance at K-1 and K2 Gas to
                                              Power stations, power evacuation issues at K-2, PAET sharing of
                                                                                                                                                  86.3      87.3        2019 Guidance
                                              National Natural Gas Pipeline (NNGP) demand from Jan-19, slick-
                                              line operations on Mnazi Bay in Mar-19.
                                                                                                                                        82.0                          79.3
                                                                                                                              76.2
      Gas Production in MMscf/day

                                                                                                          60.0      62.2

                                                        50.9                                     RAINY
                                              47.9                                              SEASON
                                                                                      43.3      (HYDRO)
                                                                            39.5
                                                                  34.3
                                                                                                 30.9

                                              Q1 2016   Q2 2016   Q3 2016   Q4 2016   Q1 2017   Q2 2017   Q3 2017   Q4 2017   Q1 2018   Q2 2018   Q3 2018   Q4 2018   Q1 2019
                                    Series1    47.9      50.9      34.3      39.5      43.3      30.9      60.0      62.2      76.2      82.0      86.3      87.3      79.3

1   As at 28 Feb-19 (Management estimate)
                                                                                                                      80 mmscfd plus 2.5 mmscfd Daily Committed Quotient (DCQ)      7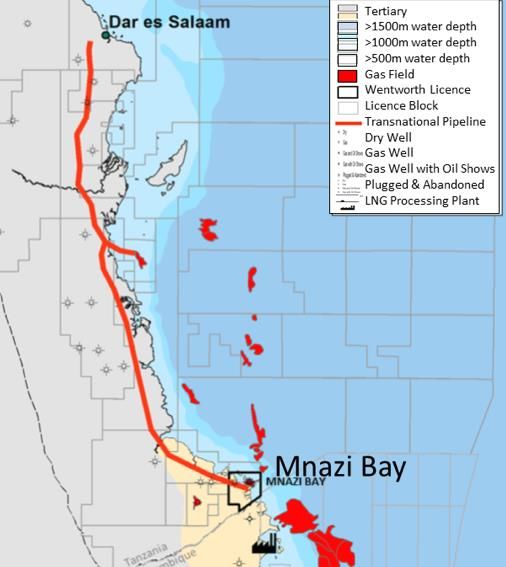
Tanzanian surging gas demand & GSA production uplift potential
Mnazi Bay (MNB) 2018-2022 demand forecast

                 Max: All projects on time & 100% executed projection
                 Mid: 6 month project delay & 70% demand & 90% uptime
                 Low: 12 month project delay & 50% demand & 85% uptime

                 Impending demand cliff from Q3 2019, potentially consuming up
                 to and beyond the 130mmscfd GSA agreed production quota
                 Mnazi Bay sufficient running room to address through additional
                 capex subject commercial triggers

                                                                                                130 mmscfd GSA

                                                                         MNB “as is” no capex
                                                                         (85mmscfd forward)

                                                                                                                 8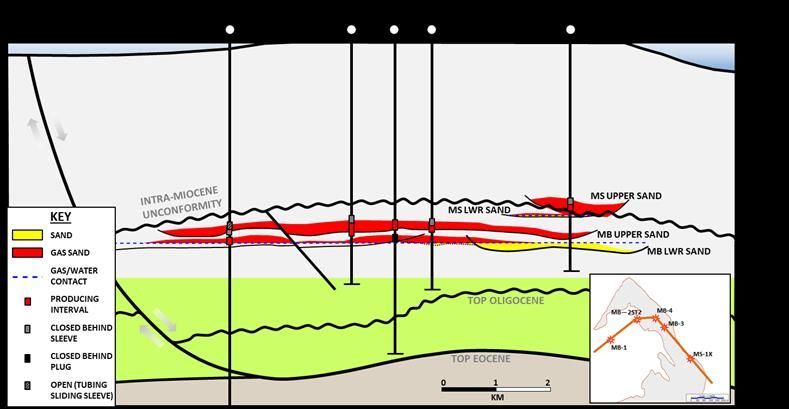
Mnazi bay
Value catalysts to a 130mmscfd GSA plateau

 Securing full GSA w/TPDC
      • Commercial Operations Date (COD) declaration (Security, stability &
         credibility) Ongoing negotiations

 Pipeline pressure reduction impact on Reserves AND Value
       • Plateau extension by ca.18 months on standalone basis and up to 7
          years with slickline/choke upgrades
       • Increases volumes available pre gas compression capex
       • Immediately accretive to core NAV (1P & 2P)

 Volumes and Productivity potential
     • Unlocking connected volume from existing well stock prior gas
        compression CAPEX and/or additional wells
     • 6 non-producing zones currently closed (smart completions and sliding
        sleeves allow for low cost production uplift via slickline perforations and
        inclusion) particularly for lower MB reservoir

 Development licence extension (2031)
      • Field management strategy & increasing production
      • Prospective running room
      • Ongoing discussions with PURA (Regulator) & JV partners

In-house dynamic field model           Focus on connected in place
                                                                         2019 Opex ca. $12.5 MM (gross)   Minimal near-term Capex (gas
for life of field scenarios &          volumes & zonal productivity
Mnazi bay running room
Composite 2D-3D regional seismic dip line – multiple play segments and upside potential

•   Exploration costs fully
    recoverable under PSA
•   Drilling sweet-spot in 2020+
•   Prospective resource
    assessment ca. 80+ leads and
    prospects. (1.5Tcf unrisked)1
                                           1   Source: RPS Energy Canada Ltd. – Reserves Assessment as at May 31, 2018, based on 20 leads/prospects
                                                                                                                                                      10
Refreshed (WEN) platform
Focus on Growth, Control, Diversification & Returns
Strategic Priorities Focus countries M&A Opportunity funnel
Materiality, control & risk
diversification
Low risk, low cost producing
assets with 2C-2P conversion Screen Evaluate / Due diligence Execute
options & Scope
• C.1 kbopd (net) onshore
Tanzanian growth options
• C.60 mmscfd onshore gas
Near term Capital returns • 10-15 kbopd onshore Brownfield • Corporate merger/RTO options
aspiration • 200mmscfd gas flaring- GTP • Tanzanian (various)
• 50mmboe SW offshore field
• OECD Onshore conventional
Declined
• c.20 Exploration assets
• 20+ producing assets
• 10 Corporate options
Strong shareholder register & Rapidly deleveraging balance Refreshed and aligned Board Sustainable cash source
support sheet for M&A led Growth intent
11African focused, Domestic gas led E&P Company
Market snapshot, WEN (AIM)
Market Cap1
US$55 MM
Share price1
£0.23
Shares in issue1
184.2 mm basic, 194,1 mm diluted
Reserves (E.I.)2 Mnazi Bay
Net 2P 100 Bscf, 16.6 Mmboe,
2P NPV15 US$106 MM (after tax)
Mnazi Bay W.I. Reserves
Significant shareholders1 (Mmboe)2
AXA Framlington 9.5%
Sustainable Capital 9.3%
Vitol 9.0% 40.50
Invesco 5.2% 25.70
R P McBean3 5.2% 15.40
Fidelity 3.9% 1 As at 29 Mar-19
1P 2P 3P 2 RPS Energy Canada Ltd. as at Dec 31, 2018
3 Chairman
4 Management estimates
Simpler UK Transactional
Material Production & US$15-20MM p.a.4 revenues M&A led growth mandate
platform
surging demand Debt free Q1 2020 Mid cap E&P aspiration
12For more information:
Eskil Jersing Wentworth Resources
Chief Executive Officer c/o Fora (2nd Floor)
Thames Tower
Station Road
Reading
RG1 1LX
Katherine Roe United Kingdom
Chief Financial Officer
More information available
online at:
www.wentplc.com
Contact
or: +44 01882065429
info@wentplc.com
13WENTWORTH
RESOURCES PLC
Appendices
14Wentworth PLC Non Executive Board (NED) Members
As of 1 April 2019
Robert McBean John Bentley Tim Bushell Iain McLaren
Senior Audit Chair NE
Chairman Chairman
Independent Director Deputy Chairman
Chief Financial Officer
Mr. Bentley has over 40 years of Mr. Bushell is a qualified geologist with more Mr. McLaren has significant experience in the
Mr.McBean is a mechanical engineer with
experience in international natural than 30 years' experience in the oil and gas oil and gas sector with deep experience as
over 40 years experience in the upstream,
resource corporations at both the industry. He has worked at British Gas, Audit committee chair. He is currently a Non-
midstream and downstream oil and gas
executive management and board level. Ultramar, LASMO, and Paladin Resources. Executive Director of Jadestone Energy Inc.
industries. He is an accomplished energy
He has a degree in Metallurgy from Brunel Most recently Tim was Chief Executive and until May 2018 was Senior Independent
project developer and both a private and
University. Mr. Bentley has had a specific Officer at Falkland Oil and Gas Limited and Director and Chair of the Audit Committee
public company senior executive and
focus in the upstream oil and gas industry Director/co-founder of Core Energy AS. He is for Cairn Energy plc. He is currently
director. His past accomplishments
in Africa having been instrumental in the currently serving as a Non-Executive Director Chairman of F&C UK High Income Trust plc
include: serving as the first Managing
formation of Energy Africa Ltd where he on the Board of Rockhopper Exploration PLC, as well as the director of four investment
Director of Qatar Fuel Additives Company,
was CEO during the period 1996 through Genel Energy plc and Petro Matad Limited trust Companies. He is a past President of
serving as the first Managing Director of
2000. Prior to this, he held a number of and as a Director of Point Resources AS and the Institute of Chartered Accountants of
Dubai Natural Gas Company (“DUGAS”) and
senior positions in the Glencore Group. He Redrock Energy Limited. Scotland and was a partner of KPMG for 28
co-founding Scarboro Resources with
is currently non-executive director of years until 2008.
interests and operations in Italy, Libya, Abu
Dhabi, Indonesia, France, Pakistan and Africa Energy Corp and Phoenix Global
Canada. Resources plc. More recently he has
served as Chairman of Faroe Petroleum
plc and as an NED at Caracal Energy Corp.
15Tanzania
At a glance
Macro Environment Key metrics Wentworth Resources core asset
60 Million, Urbanisation 34%,
✓ Centralised leadership, Annual Growth +3.1%
fiscal challenges, Dar es Salaam c.74 million by 2100
electoral law reforms,
protectionism $2,946 GDP/capita,
7.3%/pa growth
✓ Administration agenda
hinged on private sector 23 million, Annual Growth +173%
led growth 43.5 Mobile subscriptions 72%
✓ Policy predictability key 17.7 Median age
for sustainable E&P
sector development
Mnazi Bay
Onshore 3P c.3 Tcf GIIP
✓ Demographic dividend Offshore 3P c.43 Tcf GIIP
hugely underpins the
forward trending All 2P onshore domgas
landscape contracted: Mnazi Bay & Songo
Songo
SOURCES: UNITED NATIONS; U.S. CENSUS BUREAU; WORLD BANK; IMF; UNESCO; UNICEF; CIA WORLD FACTBOOK; PEW RESEARCH (JANUARY 2019), Global Cities institute, Management estimates. 16Tanzania: World class Natural Gas resource base with infrastructure
Two onshore producing assets and offshore LNG c.5-7 years away (still in HGA discussions)
Reserves & Resources (3P GIIP c.46Tcf*)- c.87 wells Licence Map Feb-19 (TPDC)- green open acreage
Kiliwani N
Mkuranga
Ntorya
Chaza
Mkizi
Mnazi Bay
Ngisi
Kamba
Tachui
Lavani-2
Gilligiani
Pweza Dar es Salaam
SongSongo
Mdalasini
Chewa
Papa
Mronge
Mnazi Bay
Piri
Lavani-1
Jodari
Mzia
Tangawizi
Zafarani
0 1000 2000 3000 4000 5000 6000 Bcf
893 MW from Natural Gas
Critical Mtwara-Dar (490km Natural gas contributes c.57% Domestic gas demand
573 MW from Hydropower
785mmscfd capacity, c.15% of power (1,565 MW) to 2017-2045 c.19Tcf (TPDC)
89 MW from Heavy Oil
utilized) pipeline in place Tanzanian grid
10 MW from Biomass 17
*Management estimatesMnazi Bay production 2015-18 & mid stream domgas infrastructure
Two domestic gas suppliers
18Tanzania Reserves summary
Mnazi Bay Competent Persons Report 31 Dec-18
Source: RPS Energy Canada Ltd. – Mnazi Bay Field Reserves Assessment as at Dec 31, 2018
19Compelling value: 2019e 48% Free cash flow yield1
Market cap US$45 mm as at 31 Jan-19
Share price /2019e Free Cashflow Share price /Core + Contingent NAV
37%
0.9 38%
1.2 39%
1.7 47%
1.9 47%
1.9 49%
2.1 55%
2.3 56%
2.4 69%
2.6 70%
2.6 71%
2.7 76%
3.7 78%
4.8 81%
5.5 83%
10.1 85%
18.9 134%
1Source Stifel 30-Jan-19. Companies: JSE, PMO, SQZ, NOG, OPHR, GENL, SDX, SEPL, SIA, TLW, DGOC, CNE, AMER, HUR, ENOG, RKH 2
0You can also read