Too Much E-Mail Decreases Job Satisfaction
←
→
Page content transcription
If your browser does not render page correctly, please read the page content below
Procedia
                                                                                                                         Social and
                                                                                                                         Behavioral
                                      Procedia - Social and Behavioral Sciences 00 (2009) 000–000
                                                                                                                          Sciences
                                                                                                                www.elsevier.com/locate/procedia

                               Collaborative Innovation Networks Conference 2009

                         Too Much E-Mail Decreases Job Satisfaction
                                               Frank Mertena*, Peter Gloorb
                                 a
                                   University of Cologne, Albertus-Magnus-Platz, Cologne 50923, Germany
                     b
                      MIT Center for Collective Intelligence, 5 Cambridge Center, Cambridge (MA) 02138, United States
                                 Elsevier use only: Received date here; revised date here; accepted date here

Abstract

In a 50 people company we compared various performance metrics with social networking structure obtained by mining e-mail
archives. We also calculated e-mail responsiveness and conducted an individual job satisfaction survey. We identified patterns of
productive and less-productive e-mail usage. Results indicate that central network position reduces e-mail responsiveness, while
this position in the organization’s social network also seems to be correlated with lower job satisfaction. In particular, the team
which sent and received the most e-mail reported the lowest job satisfaction.

Keywords: Social Network Analysis; E-Mail; Job Satisfaction

1. Introduction

   E-mail is ubiquitous in today’s organizations. Knowledge workers use e-mail constantly throughout their
workday, but at the same time it is a source of great stress (Hair, Renaud, & Ramsay, 2006). This paper investigates
positive and negative e-mail usage patterns and its influence on job satisfaction by modeling e-mail interaction as
communication in social networks.
   Social network analysis is currently a topic of active research as well as an increasingly popular method to better
understand and optimize organizational dynamics. One main stream of research deals with correlating social
network structure with performance. Until recently only a few studies (e.g. Balkundi & Harrison, 2006; Cummings,
2004; Reagans & Zuckerman, 2001; Sparrowe, Liden, & Wayne, 2001) have empirically linked structural properties
of a network to the performance of that collective (Cummings & Cross, 2003). In pioneering work, Aral & Van
Alstyne (2007) and Wu et al. (2009) found through analyzing contents of e-mail networks that diversity and
betweenness in social networks increase job performance. Using the same e-mail-based approach, Bulkley & Van
Alstyne (2007) illustrated the relationship between central position in the company network and high work
performance as well as e-mailing patterns of more productive workers who sent more but shorter e-mails, while
lower performers sent relatively less, but longer e-mails.
   In our work we have analyzed social network structure and performance of organizations based on inter- and
intra-organizational social network metrics by applying different means of data gathering. In a project analyzing

   * Frank Merten. Tel.: +49-2255-9592949; fax: +49-2255-9592948.
   E-mail address: fmerten@smail.uni-koeln.de.
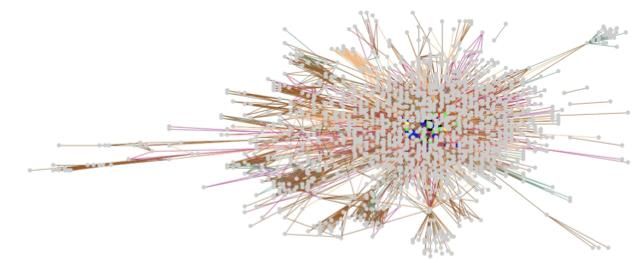
Frank Merten, Peter Gloor / Procedia – Social and Behavioral Sciences 00 (2009) 000–000

personal e-mailboxes of employees of a global consulting firm, we were able to track down emergence of team
creativity by locating new Collaborative Innovation Networks (COINs) (DiMaggio, Gloor, & Passiante, 2009).
   Comparing the individual network behavior at a business social networking hub, we found arguments illustrating
the competitiveness of the great Boston area cluster compared to the Silicon Valley (Gloor, Grippa, Kidane,
Marmier, & Von Arb, 2008). Networking behavior in the project was assessed through individual online name
generator questionnaires. In another project, using sociometric badges invented at the MIT Media Lab by the group
led by Sandy Pentland, we were able to identify interaction patterns of individual and team creativity at a marketing
team in a German bank (Gloor et al., 2007) as well as individual personality characteristics (Gloor, Oster, Raz,
Pentland, & Schoder, 2010). In a project at a large hospital, again using the sociometric badges, we found that
centrally coordinated behavior in the post anesthesia care unit was more effective than low-betweenness interaction
patterns (Chandrika & Gloor, 2009). At the same time, we also found that nurses’ more personal care increased
patient recovery, while varied daily activities reduced stress among nurses (Olguin Olguin, Gloor, & Pentland,
2009). In a project analyzing Eclipse open source programmers we found that group betweenness centrality
oscillating over time predicted group creativity (Gloor et al., 2008). Finally, analyzing communication among CEOs
of 100 software startups we were able to show that higher communication among the executives predicted survival
of their companies five years later (Raz & Gloor, 2007). This paper applies these insights to everyday e-mail usage
of knowledge workers with the goal of increasing their satisfaction and productivity through better use of e-mail.

1.1. Project background

   In this project we analyze the knowledge flow at a medium sized company in a German speaking country. We
obtained the full e-mail archive of this firm in the services sector with about fifty employees. The archive covers a
twelve-month period of major reorganization at the company, which had been totally restructured into seven
departments due to rapid organic growth.
   To analyze the e-mail archive, the company gave us a complete Exchange 2003 Server log, which provided both
incoming and outgoing e-mails with body content, subject line, timestamp of reception or mail dispatch. For our
analysis we converted the archive into the file format of our social network analysis tool Condor, formerly known as
TeCFlow (Gloor & Zhao, 2004) using database connectors and PHP scripts.

Figure 1   Full social network, only actors with more than 5 communications shown, internal and external communication
Frank Merten, Peter Gloor/ Procedia – Social and Behavioral Sciences 00 (2009) 000–000

    The converted log-file still contained irrelevant system-generated e-mails on server status and the like. Other
irrelevant mails also had to be filtered out, e.g. mails with the same sender and recipient addresses. At the end, we
obtained about 570,000 links trough e-mail for twelve months in 2006 and 2007. For our analysis, we created a
combined dataset for the whole one-year data and three separate datasets for the phases before, whilst and after the
reorganization.

    Another challenge was to maintain individual privacy and security of both individual employees and the
organization. We solved this issue by replacing employees’ mail addresses with randomly generated numbers. In the
end, we also decided not to include the body content of the mails into our analysis. This step contributed to keeping
the e-mail communication as private as possible.
    In Condor we visualize every actor (e-mail sender or recipient) as a node. An edge between to nodes means that
these actors exchange e-mails. The shorter the edge, the more frequent the mutual communication exchange. Fig. 1
illustrates the full communication network of the 50 employees including their external communication partners.
    We kept a lookup table from identifier to real employee name, to be able to give each employee feedback about
his/her communication behavior through pictures such as those in Fig. 2 and 4, 6, 7. Employees had the opportunity
to explicitly request individualized social network pictures. In the end every employee of the company asked for
such individualized feedback.

2. Hypotheses

   For this research we consider social network analysis metrics to identify the position of both individual
employees and whole departments within the communication network of the organization. To gain further insight
into the individual communication behavior, we also include the average response time (ART) to e-mail. This means
that we check how much time an employee needs on average to hit the reply button to respond to a particular e-mail.
This allows us to distinguish between fast and slow communicators.
   Putting these social network-based statistics into context, we also include a satisfaction survey of individual
employees to examine the interplay between job satisfaction of a team and its position both in the total and the
internal e-mail network of the company.
   Our first hypothesis is that the ART is positively correlated to betweenness centrality of teams, because central
communicators are overwhelmed with requests so that their responses often have to be postponed and they become
slower in answering e-mails and their ART is increasing. This leads to our first hypothesis:
          H1: A central network position causes slower responsiveness to e-mails.

Figure 2   Integration of new employee (red dot). Networks only show e-mail communication among employees on first working day of a
           particular employee (left) and after the first work week (right)
Frank Merten, Peter Gloor / Procedia – Social and Behavioral Sciences 00 (2009) 000–000
We also speculate that not being able to respond to e-mails as quickly as possible reduces job satisfaction. Our
second hypothesis is based on the idea that teams which are central in the communication network of an
organization suffer from information overload (Brown & Duguid, 1991) i.e. there might be a negative correlation
between job satisfaction and network betweenness centrality of teams, as their personal well-being decreases
through overload of work-related communication.
H2: The more central an individual is positioned in the organization’s social network, the lower is her/his
job satisfaction.
A third hypothesis looks at the roles of teams as aggregated senders or receivers of e-mails. Applying the
contribution index as defined in Gloor et al. (2003), we speculate that teams with higher contribution index, i.e.
teams which for their daily tasks need to send significantly more mails than they receive, are slower in responding to
e-mail.
H3: The higher the aggregated contribution index of teams, the higher the average response time (ART) of
the teams.
A fourth hypothesis compares job satisfaction and numbers of e-mails sent and received. Teams, which get too
many mails, are overworked, and might thus be less happy at their workplace. This is different from H1 and H2, as
they are about the number and importance of different people somebody is e-mailing with, while H3 and H4 are
about the quantity of messages exchanged.
H4: The more e-mail a team sends and receives, the lower its job satisfaction.
3. Methods
In our analysis we looked at the company wide network, measuring differences in team communication structure
as well as changes in individual network metrics such as increase or decrease in betweenness. Identifying high-
betweenness actors in non-executive functions gave indication of hidden influencers and future high potentials.
We conducted the e-mail analysis twice. First we did it for all e-mails exchanged among the employees of the
company. This resulted in a network reflecting the social position of an employee within the company. Secondly we
repeated the analysis using the full e-mail archive including all the messages exchanged between employees,
company customers, business partners, and the rest of the outside world. This resulted in a social network indicative
of the role of an employee as a member of a much larger ecosystem. This approach was developed in earlier work
by Joo Bae et al. (2005), because comparing the SNA metrics between internal and external networks gives
additional insights into individual roles and positions.
In addition, we also calculated average response time to answer an e-mail for each of the fifty members of the
organization. The average response time ranged from slightly more than a day to over a week. We combined this
automated analysis of the interaction archives with individual interviews of key personnel such as the CEO and
department heads. In addition, each employee answered an online survey about her/his satisfaction with company-
internal communication using the Communication Satisfaction Questionnaire II developed by Downs & Hazen
(1977). This allowed us to compare job satisfaction and other communication metrics.
To gain further insight into individual communication behavior, the contribution index (Gloor et al., 2003) of
each employee based on both company-internal and external exchange of information was also calculated. This way,
active communicators, sending and receiving many e-mail messages, could be compared with less communicative
people.
4. Results
Fig. 3 illustrates the detailed results of the satisfaction survey. The questions were broken down into assessing
relations to superiors, peers, and subordinates as well as general questions about the company climate. As Fig. 3
illustrates, there was one team that scored significantly lower on the satisfaction scale than all the others. This came
as a total surprise to the company, which immediately initiated appropriate measures to rectify this situation. For our
further analysis, we combined the eight different satisfaction ratings into one combined score. To conserve
individual privacy, we only did our analysis for combined team satisfaction scores, leading to one combined
satisfaction rating per team.Frank Merten, Peter Gloor/ Procedia – Social and Behavioral Sciences 00 (2009) 000–000
Table 1 Correlation: Metrics of SNA, Job Satisfaction and E-Mail Responsiveness (N=53 Internal, N=43587 Total Communication)
Correlation Total Communication Internal Communication
Agg. Teams Each Employee Agg. Teams Each Employee
Satisfaction ART -0.13 0,34
Satisfaction Betweenness -0,94** -0,34
ART Betweenness 0,381 0,42*** 0,742 0,33**
Satisfaction Contribution Index -0,49 -0,39
Satisfaction Total Mails -0.98*** -0.94**
ART Contribution Index -0,80 -0,13 -0,703 -0,05
ART Sent Mails -0,01 0,38*** -0,40 0,204
ART Received Mails 0,04 0,44*** -0,25 0,25*
# Answers Sent Mails 0,41 0,90*** 0,93** 0,90***
# Answers Received Mails 0,39 0,91*** 0,90** 0,89***
1
p = 0.11, p = 0.15, 3p = 0.19, 4p = 0.14
2
* p < 0.1, ** p < 0.05, *** p < 0.01
We found that when looking at the full communication network, job satisfaction decreased with increasing team
betweenness (N=53) (table 1). This means that the more central within the social network of the company the
members of a team were, the less satisfied they were with their work (-0.94**). This is further supported by the
similarly strong negative correlation between numbers of e-mails sent and received and job satisfaction of
individuals on both the internal (r=-0.94**) and the total network level (-0.98**). Team members, whose workday
consists to a large extent of writing and replying to e-mails, seem to become overwhelmed by their communication
tasks, which appears to lead to a lower level of satisfaction in the job.
Employee
1
Employee
2
Employee
3
Employee
4
Employee
5
Figure 3 Results of satisfaction survey, aggregated per Figure 4 Development of Betweenness over one year period of
team ( ) selected employees recognized as high potentials in
total communicationFrank Merten, Peter Gloor / Procedia – Social and Behavioral Sciences 00 (2009) 000–000
Both on the aggregated team (N=5) and individual level of information exchange (N=53), evidence was found
that a more central position in the social network also leads to slower responsiveness to e-mails (r=0.42***
internally, and r=0.33** for the total network). We speculate that a higher frequency of communication causes
messages with low priority to be postponed for later, which might create stress (Hair et al., 2006). The more central
the role of specific actors, the more prioritization of e-mails they have to do, leading to further increases in ART.
This could be at least a partial explanation for their overall slower responsiveness. As Kalman & Rafaeli (2005)
found, a very small number of people is sending and receiving a disproportionally large share of all e-mails,
becoming potential bottlenecks and driving up overall response time for a team.
Not surprisingly, the more e-mails somebody receives and answers, the longer it takes her/him to answer them.
We distinguished in our analysis between comparing ART and the number of e-mails sent and received, and the
number of mails that were answers to e-mailed requests (# Answers). This result was only significant on the
individual level, not on the team level. This could be because there are a few people who are not only very active e-
mailers, but also very quick in answering their mails.
To resume, our hypotheses have been proven. Teams that are central are less satisfied with their job (H2) and are
slower in responding to their e-mail (H1). Teams are also less satisfied, if they have to deal with more e-mail (H4),
and the more e-mails they have to send compared to receiving e-mail, the slower they get in responding to e-mails
(H3). This finding might also be related to the (non-significant) result that teams are more satisfied if they get more
e-mails than they send. In prior work we have found that this communication behavior is indicative of highly-trusted
and well-regarded people (Gloor et al., 2010).
Not surprisingly, the employees of the company occupy the central position in the organization’s social e-mail
network (Fig. 1). In prior results (DiMaggio et al., 2009; Raz & Gloor, 2007; Uzzi, 1997; Wuchty, Jones, & Uzzi,
2007), a strong connection between high levels of interpersonal communication and high individual and company
performance has been established. This would imply that teams, which communicate more, perform better (Gloor et
al., 2007; Gloor, Paasivaara, Schoder, & Willems, 2007; Raz & Gloor, 2007). As better performing teams should be
happier, we would expect that more central and more communicating teams should also be more satisfied. Because
we are finding the opposite in this project, we speculate that there are different types of communication. In previous
projects we focused on “creative communication” of COINs (DiMaggio et al., 2009), while the e-mail
communication in this project is about running an operational daily business. It might be that for “creative
communication” there can never be enough, while for running a daily business, “less is more”, i.e. it might be more
satisfactory to have to manage fewer e-mails.
Figure 5 Top 5 High Potentials from figure 3 were also ranked highly in peer surveyFrank Merten, Peter Gloor/ Procedia – Social and Behavioral Sciences 00 (2009) 000–000 Figure 6 High Potentials within total social network (communication frequency >= 30) No conclusive evidence regarding team satisfaction and speed in answering to e-mail could be found. Comparing team satisfaction obtained by the online survey with average response time to e-mail indicated that satisfied teams responded to e-mails somewhat faster on the total communication network (r=-0.13), while they responded slower to their peers within the company (r=0.34), none of the correlations was significant, however. 5. Discussion While our work has given us some general insights on what e-mail patterns support teams of knowledge production workers in organizations, it is worthwhile to also look at individual interaction patterns. We therefore looked if we could identify high performers both by betweenness and individual questioning (see Fig. 4, 5, 6, 7). Fig. 4 shows changes of betweenness over time of key individuals. As can be seen, employee 1 in Fig. 4 joins the company in month nine, employee 2 is most central in months six to eight, employee 3 is the most central, but his centrality goes down. Employee 4 increases his centrality in the first four months, it stays flat thereafter. Employee 5 stays on relatively low betweenness for the entire period of observation. Fig. 5 ranks the same employees based on peer nominations. All employees had been asked to nominate people they consider key contributors. Combining Fig. 4 and 5 permits us to draw some interesting conclusions. Employee 1 has been nominated many times, but is not central in the company network. Obviously this is an employee who has been hired with high expectations. Employee 2, on the other hand, is highly central, while not being nominated as key for the company. We can therefore assume that he is central by virtue of his function, and not by contribution to the company. Employees 3, 4, and 5 show a consistent picture of being central to the communication network, while at the same time being repeatedly nominated as a key person for the company. Fig. 6 shows the five key employees embedded into the full company e-mail network. As can be seen, all five employees, independent of their peer nominations, are fairly central in the total e-mail communication network. As we have found in previous work (Joo Bae et al., 2005), comparing the social network position of an actor in the total network and in the internal network offers insights about the role of the actor in the organization. Key individuals usually occupy central positions in both the internal and total network. The non-central role of employee 1 in Fig. 7 illustrates this finding. People expect him to assume a key role, which does not happen. Employee 2, who has highest betweenness, is not nominated as a key employee, his network position in Fig. 6 and 7 is not very central. Employees 3, 4, 5, who have been repeatedly nominated as key by their peers, are central in both internal and total social network.
Frank Merten, Peter Gloor / Procedia – Social and Behavioral Sciences 00 (2009) 000–000

Figure 7   High Potentials within internal social network

   As the four figures in this section illustrate, comparing betweenness over time of employees with other metrics
such as peer rankings permits interesting conclusions. We have found that high betweenness of individuals and
ART are positively correlated, which means that the higher betweenness of an individual, the slower she/he is in
answering e-mails. As it is in the best interest of a company to have e-mails answered quickly, a company might
specifically target central employees and assist them in dealing with potential communication overload and initiate
appropriate steps to increase employee satisfaction.
   One of the main insights of this project is that there exist no one-size-fits all rule for e-mail usage. While, in prior
work, we found that one could never communicate enough for creative work (DiMaggio et al., 2009; Gloor et al.,
2007; Raz & Gloor, 2007; Uzzi, 1997), in this project we clearly have found the opposite. Production workers are
more satisfied and respond to e-mails faster if they are less central in the social network of the organization, and
have fewer e-mails to work on.

6. Conclusions

   Knowledge flow analysis through e-mail can be an extremely valuable tool for managers to discover hidden
influencers and key personnel who otherwise might remain unrecognized, frustrated, and leave the company. In
addition, contribution index, team betweenness, e-mail volume, and average response time to answer an e-mail
might be predictors of individual and intra-team satisfaction.
   Main limitations of our study are the small sample size of 5 teams, and the fact that, because of privacy reasons,
we did not map results of the satisfaction survey to individual employees. We are currently working on a follow-on
project using an extended version of the same research design, with a company of 500 employees. We hope to verify
or disprove our results there. Our main goal is to gain a more in-depth understanding of the causality between e-mail
usage, job satisfaction, and job performance. In particular we hope to better understand the different usage patterns
of e-mail for production and creativity tasks in organizations. This way, we hope to contribute to a more productive,
more creative work environment, but even more importantly, more satisfied and happier employees.

7. Acknowledgements

    We are grateful to Arttu Piri, Bernd Peters, and Oliver Rath who, jointly with Frank and Daniel Oster, did the
initial analysis as part of a seminar on Collaborative Innovation Networks (COINs). We thank the other instructors
Frank Merten, Peter Gloor/ Procedia – Social and Behavioral Sciences 00 (2009) 000–000
of the seminar, Kai Fischbach, Johannes Putzke, Detlef Schoder, Maria Paasivaara, Tuomas Niinimäki and
Francesca Grippa for their support.
References
Aral, S., & Van Alstyne, M. (2007). Network structure and information advantage. Proceedings of the Academy of Management Conference, 3-8
August 2007. Philadelphia (PA), United States..
Balkundi, P., & Harrison, D.A. (2006). Ties, Leaders, and Time in Teams: Strong Inference About Network Structure's Effects on Team
Viability and Performance. Academy of Management Journal, 49 (1), 49-68.
Brown, J.S., & Duguid, P. (1991). Organizational learning and communities of practice: toward a unified view of working, learning and
innovation. Organization Science, 2 (1), 40–57.
Bulkley, N., & Van Alstyne, M. (2007). An Empirical Analysis of Strategies and Efficiencies in Social Networks. Proceedings of Sunbelt 2006,
26-29 April 2007. Vancouver, Canada.
Chandrika, S., & Gloor, P. (2009). Process Efficiency - Redesigning Social Networks to Improve Surgery Patient Flow. Journal of Healthcare
Information Management, 23 (1), 20-26.
Cummings, J.N. (2004). Work Groups, Structural Diversity, and Knowledge Sharing in a Global Organization. Management Science, 50 (3), 352-
364.
Cummings, J.N., & Cross, R. (2003). Structural Properties of Work Groups and their Consequences for Performance. Social Networks, 25, 197-
210.
DiMaggio, M., Gloor, P., & Passiante, G. (2009). Collaborative Innovation Networks, Virtual Communities, and Geographical Clustering.
International Journal of Innovation and Regional Development, 1 (4), 387–404.
Downs, C.W., & Hazen, M.D. (1977). A Factor Analytic Study of Communication Satisfaction. Journal of Business Communication, 14, 63-73.
Gloor, P., & Y. Zhao. (2004). TeCFlow - A Temporal Communication Flow Visualizer for Social Networks Analysis. ACM CSCW Conference,
6-10 November 2004. Chicago (IL), United States.
Gloor, P., & Cooper, S. (2007). The New Principles of a Swarm Business. Sloan Management Review, Spring 2007.
Gloor, P., Grippa, F., Kidane, Y., Marmier, P., & Von Arb, C. (2008). Location Matters - Measuring the Efficiency of Business Social
Networking. International Journal of Foresight and Innovation Policy, 4 (3-4), 230-245.
Gloor, P. Oster, D. Putzke, J., Fischbach, K., Schoder, D., Ara, K., Kim, T., Laubacher, R., Mohan, A., Olguin Olguin, D., Pentland, A., &
Waber, B. (2007a). Studying Microscopic Peer-to-Peer Communication Patterns. Proceedings of AMCIS Americas Conference on
Information Systems, 9-12 August 2007. Keystone (CO), United States.
Gloor, P., Oster, D., Raz, O., Pentland, A., & Schoder, D. (2010). The Virtual Mirror - Reflecting on Your Social and Psychological Self to
Increase Organizational Creativity. Journal on International Studies of Management & Organization (to be published), 40 (2).
Gloor, P., Paasivaara, M., Schoder, D., & Willems, P. (2007b). Finding Collaborative Innovation Networks Through Correlating Performance
With Social Network Structure. International Journal of Production Research, 46 (5), 1357-1371.
Gloor, P., Laubacher, R., Dynes, S., & Zhao, Y. (2003). Visualization of Communication Patterns in Collaborative Innovation Networks:
Analysis of some W3C working groups. ACM CKIM International Conference on Information and Knowledge Management, 3-8 November
2003. New Orleans (LA), United States.
Hair, M., Renaud, K.V., & Ramsay, J. (2006). The influence of self-esteem and locus of control on perceived email-related stress. Computers in
Human Behavior, 23 (6), 2791-2803.
Joo Bae, S., Gloor, P., & Schnorf, S. (2005). The Effects of Network Position and Usage Pattern on Diffusion of Innovation. Proceedings of
Application of Social Network Analysis Conference, 20-21 October 2005. Zurich, Switzerland.
Kalman, Y., & Rafaeli, S. (2005). Email Chronemics: Unobtrusive Profiling of Response times. Proceedings of 38th Hawaii International
Conference on System Sciences, 3-6 January 2005. Big Island (HI), United States.
Olguin Olguin, D., Gloor, P., & Pentland, A. (2009). Capturing Individual and Group Behavior with Wearable Sensors. Proceedings of AAAI
2009 Spring Symposium, 23-25 March 2009, Stanford (CA), United States.
Raz, O., & Gloor, P. (2007). Size Really Matters - New Insights for Startup's Survival. Management Science, 53 (2), 169-177.
Reagans, R., & E.W. Zuckerman (2001). Networks, Diversity, and Productivity: The Social Capital of Corporate R&D Teams. Organization
Science, 12 (4), 502- 517.
Sparrowe, R.T., Liden, R.C., & Wayne, S.J. (2001). Social Networks and the Performance of Individuals and Groups. Academy of Management
Journal, 44 (2), 316-326.
Uzzi, B. (1997). Social Structure and Competition in Interfirm Networks: The Paradox of Embeddedness. Administrative Science Quarterly, 42,
35-67.
Wu, L., Lin, C., Aral, S., & Brynjolfsson, E. (2009). Value of Social Network - A Large-Scale Analysis on Network Structure Impact to Financial
Revenue of Information Technology Consultants. Winter Information Systems Conference, 26-28 February 2009. Salt Lake City (UT),
United States.
Wuchty, S., Jones, B., & Uzzi, B.. (2007). Science Commentary: Why Do Team-Authored Papers Get Cited More? Science, 317, 1496-1498.You can also read