Gas Networks Ireland Transmission Tariffs and Allowed Revenue 2021/22
←
→
Page content transcription
If your browser does not render page correctly, please read the page content below
An Coimisiún um Rialáil Fóntas Commission for Regulation of Utilities

               An Coimisiún um Rialáil Fóntas
               Commission for Regulation of Utilities

              Gas Networks Ireland
              Transmission Tariffs and
              Allowed Revenue 2021/22
              Decision Paper

               Decision Paper

                                                     Date                            Closing
               Reference: CRU/21/058                                    04/06/2021             n/a
                                                     Published:                      Date:

0
An Coimisiún um Rialáil Fóntas Commission for Regulation of Utilities

CRU Mission Statement
The CRU’s mission is to protect the public interest in Water, Energy and Energy Safety.

The CRU is guided by four strategic priorities that sit alongside the core activities we undertake
to deliver in the public interest. These are:

      •   Deliver sustainable low-carbon solutions with well-regulated markets and networks
      •   Ensure compliance and accountability through best regulatory practice
      •   Develop effective communications to support customers and the regulatory process
      •   Foster and maintain a high-performance culture and organisation to achieve our vision

Executive Summary
This paper sets out the transmission network tariffs to apply from 01 October 2021 to 30
September 2022 (gas year 2021/22). Article 29 of the Tariff Network Code1, requires that
transmission reserve prices and a set of accompanying information is published 30 days ahead
of the annual yearly capacity auctions. The annual yearly capacity auctions will be held on 05
July 2021 for the forthcoming gas year which commences on 01 October 2021. As such this
information needs to be made available by 05 June. Although it is not required under Article 29,
the CRU is also publishing the distribution tariffs at this time, in a separate paper (CRU/21/059).

Each year, the network tariffs are reviewed to ensure that Gas Networks Ireland (GNI) only
recovers the necessary costs for efficient operation of the network. The review uses the most up
to date revenue and demand data, as submitted by GNI.

In its review of transmission tariffs, the CRU has carefully assessed the information presented by
GNI and has aimed to ensure that where additional allowances have been provided, they are
efficient and in the best interest of the customer. The review has resulted in the following tariffs
outlined in Table 1.

1   Commission Regulation (EU) 2017/460 – 16 March 2017

1
An Coimisiún um Rialáil Fóntas Commission for Regulation of Utilities
Table 1: Transmission tariffs 2021/22
Bellanaboy RNG Moffat (IP) Domestic Gormanston
entry entry entry exit (IP) exit
Firm2 capacity - 633.763 104.32 312.89 454.70 432.40
€/peak day MWh
Commodity - 0.114 0.238
€/MWh
For comparison, Table 2 below provides the 2021/22 transportation cost of Great British (GB)
gas in the context of recent years. The transportation cost of GB gas (Moffat Entry capacity tariff
+ Domestic Exit capacity tariff) is important because GB gas is the marginal supply for Ireland.
Generally, Irish wholesale gas prices are set by the GB price of gas plus the cost of transporting
gas from GB to Ireland via the interconnectors. The transportation cost of GB gas to Ireland will
increase by c.5% (in real terms (i.e. adjusted for inflation)). This increase in tariffs is mainly due
to increases in shrinkage costs and changes in how capacity is booked. The higher shrinkage
costs are associated with rises in CO2 and gas commodity costs. As regards to changes in
booking behaviours, there has been a reduction in the bookings of more expensive daily capacity
products at Exit. This has the effect of reducing revenue recovery and therefore places upward
pressure on Exit tariffs.
Table 2 shows the tariffs for 21/22 relative to those in recent years (in nominal terms (i.e. without
adjusting for inflation)). Tariff costs have increased in the last two years, mainly due to the cost of
shrinkage4 moving into the allowed revenue. Despite these increases, due to reductions in the
previous three years, the transportation cost of GB gas is similar to 2016/17 and 2017/18 levels.
Table 2: Recent cost of transportation for GB gas (nominal)
2016/17 2017/18 2018/19 2019/20 2020/21 2021/22
Capacity –
788.605 761.263 715.864 669.00 722.44 767.59
€/peak MWh
2 “Firm” means gas transmission capacity contractually guaranteed as uninterruptible by the
transmission system operator.
3 This is composed of two elements; one to remunerate the transmission services revenue of GNI
(€130.44) plus a Corrib Linkline Element (€503.32), which will remunerate the revenues relating to the
Corrib Linkline (Corrib Partners).
4 Shrinkage gas includes own use gas (OUG) and unaccounted for gas (UAG). In 2020/21 shrinkage
costs moved into the allowed revenue and are therefore recovered through tariffs. Previously, GNI billed
these costs to gas shippers directly on a monthly basis, based on their throughput. However, as part of
the CRU’s tariff network code decision (CRU/19/060), it was decided that from 2020/21 onwards,
shrinkage should be included in the allowed revenue as it is a transmission service. As this was a
movement of costs, not an increase in overall costs, it did not lead to an increase in costs for end
customers.
2An Coimisiún um Rialáil Fóntas Commission for Regulation of Utilities Network tariffs are charged to gas shippers/suppliers. It is up to suppliers whether to pass on these costs to their customers. Currently, the CRU estimates that network tariffs charges (transmission and distribution collectively) make up approximately 31% of a residential customer’s bill. The transmission network tariff charge, if fully passed onto gas customers, would equate to a c. 0.5% (or €4) increase (nominal) on an average residential gas customer’s annual bill. However, the CRU would note that the pricing decisions of suppliers do not just reflect network charges but also the other charges they are faced with. As in previous years, the CRU is also publishing, today, the distribution network tariffs. The distribution tariffs are set to decrease (by c. 3.1%). It is estimated that the combined change in transmission and distribution tariffs equates to a
An Coimisiún um Rialáil Fóntas Commission for Regulation of Utilities

Customer Impact Statement
The CRU is legally responsible for regulating network charges in the natural gas market. The
CRU may set the basis for charges for using the transmission system. Our mission is to protect
the public interest in water, energy and energy safety.

The tariffs set out in this paper are charged to suppliers for use of Gas Network Ireland’s
transmission network – this network consists of the larger gas pipes, for example the gas pipes
between larger cities and towns. The CRU conducts an annual review of transmission tariffs to
ensure that only necessary costs are included in the calculation of these tariffs. This work has
now completed and the transmission tariffs to apply from 01 October 2021 to 30 September 2022
are published in this paper.

Transmission network tariffs for 2021/22 are set to increase by c. 5% when compared to the
current gas tariffs for 2020/21. A reason for the increase in tariffs is that some of GNI’s costs
have increased significantly for the upcoming gas year. For example, there has been an increase
in the commodity cost of natural gas and CO2 emissions, which raises GNI’s shrinkage (i.e.
natural gas it uses to run the compressors) costs. As detailed in a separate publication alongside
this paper, distribution tariffs are set to decrease by c. 3.1%.

Network tariffs are charged to gas suppliers and it is a decision for suppliers whether to pass on
these costs to their customers.

Currently, the CRU estimates that network tariffs (transmission and distribution collectively)
charges make up approximately 31% of a residential customer’s bill. The combined transmission
and distribution tariffs, if fully passed onto gas customers, would equate to a
An Coimisiún um Rialáil Fóntas Commission for Regulation of Utilities

Table of Contents
Executive Summary ................................................................................................. 1

Customer Impact Statement .................................................................................... 4

Table of Contents ...................................................................................................... 5

Glossary of Terms and Abbreviations.................................................................... 6

1 Introduction ........................................................................................................... 7

    1.1 The Commission for Regulation of Utilities .......................................................................... 7
    1.2 Purpose of the Paper .......................................................................................................... 7
    1.3 Related Documents ............................................................................................................ 8
    1.4 Structure of the Paper......................................................................................................... 8
2 Irish Transmission Network ................................................................................. 9

    2.1 Introduction ....................................................................................................................... 9
    2.2 Irish Transmission Network ................................................................................................. 9
    2.3 Transmission Tariff Methodology for Gas .......................................................................... 10
    2.4 Parameters used in the Matrix Methodology ..................................................................... 11
3 Tariff Setting Process ......................................................................................... 13

    3.1 Introduction ..................................................................................................................... 13
    3.2 Price Control..................................................................................................................... 13
    3.3 Annual tariff setting process ............................................................................................. 13
      3.3.1 Pass-through costs and extra-over items ............................................................................ 14
      3.3.2 Correction Factor (or k-factor) ............................................................................................. 14
      3.3.3 Demand Projections ............................................................................................................. 15
4 TAR NC Article 30 information ........................................................................... 20

5 CRU Decision on Transmission Tariffs for 2021/22 ......................................... 25

    5.1 Transmission tariffs for 2021/22........................................................................................ 25
    5.2 Impact on a residential customer’s bill .............................................................................. 26
    5.3 Details of Multipliers ........................................................................................................ 26
    5.4 Virtual Reverse Tariff 2021/22........................................................................................... 27
6 Conclusion ........................................................................................................... 29

Appendix A Transmission Tariffs 2021/22 ........................................................... 30

5
An Coimisiún um Rialáil Fóntas Commission for Regulation of Utilities
Glossary of Terms and Abbreviations
Abbreviation or Term Definition or Meaning
AGI Above Ground Installation
Capex Capital expenditure
CAPM Capital Asset Pricing Model
CNG Compressed Natural Gas
CRU Commission for Regulation of Utilities
DM Daily Metered
GNI Gas Networks Ireland
GCS Generation Capacity Statement
HICP Harmonised Index of Consumer Prices
I/C Industrial & Commercial
IP Interconnection Point
LDM Large Daily Metered
LRMC Long Run Marginal Costs
NDM Non-Daily Metered
Opex Operating expenditure
RAB Regulated Asset Base
RNG Renewable Natural Gas
RPM Reference Price Methodology
TSO Transmission System Operator
VRF Virtual Reverse Flow
WACC Weighted Average Cost of Capital
6An Coimisiún um Rialáil Fóntas Commission for Regulation of Utilities
1 Introduction
1.1 The Commission for Regulation of Utilities
The Commission for Regulation of Utilities (CRU) is Ireland’s independent energy and water
regulator. The CRU was established in 1999 and now has a wide range of economic, customer
protection and safety responsibilities in energy and water. The CRU’s mission is to protect the
public interest in Water, Energy and Energy Safety.
Further information on the CRU’s role and relevant legislation can be found on the CRU’s
website at www.cru.ie.
1.2 Purpose of the Paper
Under the Gas (Interim) (Regulation) Act, 2002, the CRU is responsible for regulating charges in
the natural gas market. Under Section 14 of the Act, the CRU may set the basis for charges for
transporting gas through the transmission system.
This paper outlines the CRU’s decision in relation to the Gas Network Ireland’s (GNI) allowed
revenues and transmission tariffs that will apply from 01 October 2021 to 30 September 2022.
The CRU is now publishing additional information related to the calculation of allowed revenues
and transmission tariffs. This is in accordance with Article 30 of the Network Code on rules
regarding harmonised transmission tariff structures for gas (TAR NC).
The calculation of transmission tariffs is based on the Price Control (PC4) (CER/17/260), which
established revenues for Transmission over the 5 year period from October 2017 to September
2022.
Previously the two separate papers would have been published on the tariffs and on the Article
30 information. This led to a degree of repetition while also splitting useful transmission tariff
information into two papers. This year the CRU has combined these papers to remove any
repetition but also to provide a single resource for all tariff related information such as:
1. how the CRU sets tariffs on an annual basis,
2. the tariff methodology used,
3. the variables that cause changes in the tariffs from one year to the next and
4. the transmission tariffs for the gas year 2021/22.
7An Coimisiún um Rialáil Fóntas Commission for Regulation of Utilities
The publication of this information is to provide customers with tariff related information in the
most transparent and easily accessible manner.
1.3 Related Documents
Over the years there has been a large volume of tariff documentation published. The below
provides a convenient list of some of the key transmission tariff.
• CRU Transmission Revenue Model 2021/22 (CRU/21/058a)
• CRU Corrib Linkline Model (CRU/21/058b)
• GNI’s Simplified Transmission Tariff Matrix Model
• Gas Transmission Tariff Methodology – Tariff Network Code Article 28 Decision 2021/22
(CRU/21/049)
• Decision on October 2017 to September 2022 Transmission Revenue for Gas Networks
Ireland (CER/17/260)
• Harmonised Transmission Tariff Methodology for Gas Decision Paper (CRU/19/060)
• Establishing a Network Code on Harmonised Transmission Tariff Structures for Gas
(Commission Regulation (EU) 2017/460)
1.4 Structure of the Paper
This information paper is structured as follows:
• Section 1 provides an introduction and background
• Section 2 background as to the Irish transmission system and how transmission tariffs
are calculated;
• Section 3 outlines the way by which tariffs are updated and how the CRU updates
allowed revenues on an annual basis;
• Section 4 provides specific information required by Article 30 of the TAR NC;
• Section 5 sets out the transmission tariffs for 2021/22; and,
• Section 6 provides a conclusion.
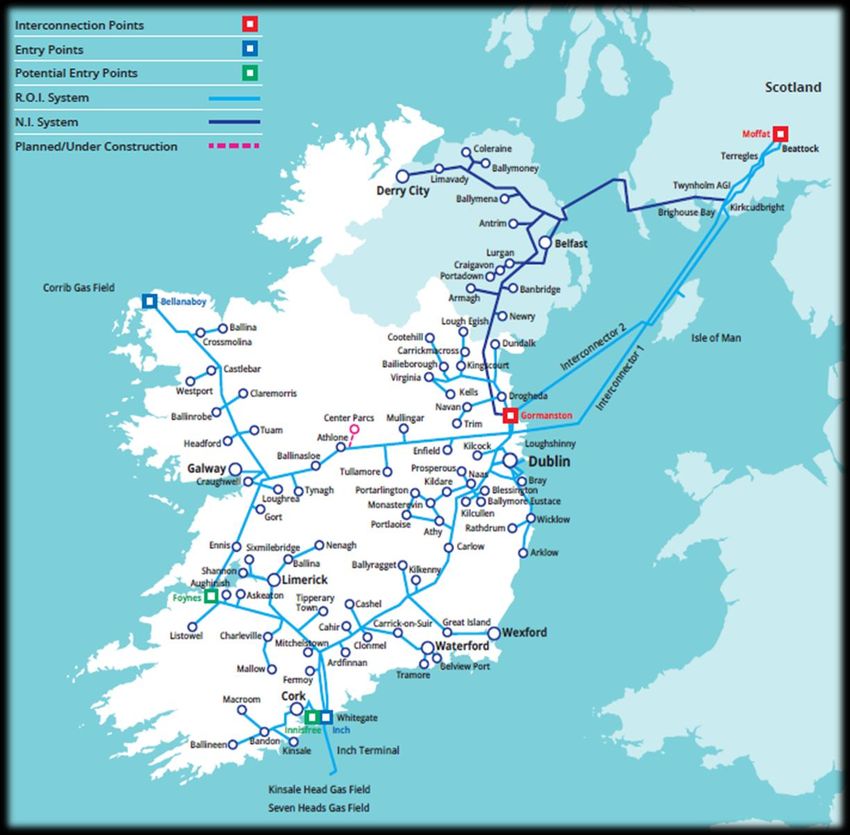
8An Coimisiún um Rialáil Fóntas Commission for Regulation of Utilities 2 Irish Transmission Network 2.1 Introduction The gas transmission and distribution networks are a key element of the energy sector in Ireland, delivering fuel to power stations as well as serving industrial, commercial and household consumers. This section provides a summary of the key economic and technical characteristics of the Irish gas transmission system, an outline of the reference price methodology5 (RPM) (Matrix methodology) and the parameters used within the Matrix methodology. 2.2 Irish Transmission Network The natural gas transmission network is 2,477km in length, consisting of high-pressure steel transmission pipelines. There are both onshore and offshore pipelines. See Figure 1 for a map of the Irish gas transmission system. The offshore portion of the network consists of the two gas interconnectors (IC1 and IC2) that connect Ireland to Brighouse Bay, Scotland. There is a sub- sea offtake point from IC2 that supplies the Isle of Man depicted in Figure 1. The onshore network covers the country in a ring-shaped fashion linking Dublin, Galway, and Limerick. It also consists of several spur lines to Cork, Waterford and lower pressure local area (regional) networks in large urban centres. In addition, the Mayo-Galway pipeline connects the ring-main to the Bellanaboy terminal, Co. Mayo, where gas from the Corrib gas field enters the Irish transmission system. At the end of 2015 the Corrib entry point (known as Bellanaboy) came into operation. The Bellanaboy entry point and the Moffat interconnection point (IP) in Scotland are the only entry points in operation since flows ceased in mid-2020 from the Inch entry point for gas from the Kinsale gas fields. In addition, to the Moffat IP there is also an IP with the Northern Irish gas transmission system at Gormanston. However, no commercial gas currently flows to NI from the Irish system and this pipe is currently used for emergency support only. In the event that commercial flows to Northern Ireland (NI) did occur the Gormanston IP could also become an entry point for virtual reverse flow (VRF) from the NI system to the Irish system. 5 Reference Price Methodology (RPM) is the methodology applied to the part of the transmission services revenue to be recovered from capacity-based transmission tariffs with the aim of deriving reference prices. 9
An Coimisiún um Rialáil Fóntas Commission for Regulation of Utilities

Figure 1 Gas Network Ireland's transmission system

2.3 Transmission Tariff Methodology for Gas

In 2019, in line the European network code on harmonised transmission tariff structures for gas
(TAR NC)6, the CRU completed a review of the methodology for calculating transmission tariffs
for gas. The aim of the TAR NC was to overcome issues relating to Member States using
different approaches to tariff setting for gas transmission services, which could add to the
complexity of using the various transmission systems. As part of the tariff methodology review

6Establishing a network code on harmonised transmission tariff structures for gas (Commission
Regulation (EU) 2017/460).

10
An Coimisiún um Rialáil Fóntas Commission for Regulation of Utilities

process, the CRU held a number of industry stakeholder workshops and published a consultation
paper which set out key proposals and invited comments from interested parties. In June 2019,
the CRU set out its decision in CRU/19/060. A key component of that paper was the CRU’s
decision to continue to calculate transmission tariffs using a forward-looking Matrix RPM, also
referred to as the Matrix model. This Matrix model was used to set the tariffs for the 2021/22 gas
year. In accordance with Article 30 of the TAR NC a simplified version of this Transmission Tariff
Model is available alongside this information paper at the following link. It will be updated to
reflect the gas tariffs in this paper before they come into effect. Some of the key inputs to this
methodology are highlighted in Table 4.1.

2.4 Parameters used in the Matrix Methodology

In accordance with Art. 30 (1)(a)(i) of the TAR NC, this section includes information on
parameters used in the Matrix RPM that relate to the technical characteristics of the transmission
system.

The Matrix RPM is a forward-looking methodology based on long run marginal costs (LRMC).
The model contains a representative network of pipelines, which is based on actual pipeline
distances between entry points and exit points in Ireland. The model uses these distances and
an estimate of the cost of building additional gas pipeline capacity (i.e. expansion constant) to
approximate the cost of expansion between each entry and each exit point in a matrix. To
determine the reference price at each of the points, a mathematical formula uses least squares
to minimise the total difference between the cost of the paths and the sum of the entry and exit
reference price. Following this step, the ‘primary’ tariffs are rescaled to recover any transmission
services revenue shortfall. The same approach is applied at exit.

As noted above, the cost of expansion is calculated using expansion constants. An expansion
constant provides a numerical value for the cost of expanding capacity so that one unit of gas
travels over a specified distance. This is measured in €/gigawatt hour/day/kilometre
(€/GWh/d/km). To determine the values of an expansion constant, actual pipeline and
compressor capital and operating costs are used to forecast forward-looking costs. As the GNI
system is comprised of both dry (onshore) and wet (subsea) pipelines, the CRU has calculated
separate expansion constants to reflect the different costs associated with each. Both dry and
wet expansion constants are comprised of pipeline costs and compression costs.

The expansion constant can be used to calculate the cost of building a pipeline (including
compression) but it does not give any indication of the annual revenues that would be required to
finance such an asset. In order to calculate the annual revenues an annuitisation factor is used.
The annuitisation factor uses the capital costs of the assets, the cost of capital, the annual

11
An Coimisiún um Rialáil Fóntas Commission for Regulation of Utilities

depreciation and the annual operating costs to calculate the average annual payment that would
be made on this asset over the lifetime of the asset.

The wet expansion constant is €8,783 GWh/d/km, and the dry is 7,810 GWh/d/km. See
CRU/18/247 sections 4.7 & 4.8 for further information on expansion constants and annuitisation
factors. Table 2.1 below outlines further details required under Article 30 of the TAR NC relating
to the parameters used with the Matrix model.

Table 2.1 Parameters used in the reference price methodology

 TAR NC Article           Description                     Detail
 Art. 30(a)(i)            Technical capacity at           The technical capacity at the entry points to the
                          entry and exit points           transmission network is available on GNI’s
                                                          transparency dashboard, available at the following
                                                          link. However, it should be noted that the technical
                                                          capacity at entry and exit points of the transmission
                                                          network is not a relevant variable for the purpose of
                                                          the methodology of calculation of the transmission
                                                          tariffs.
 Art. 30(a)(ii)           Forecasted contracted           The forecasted contracted capacity at the entry points
                          capacity at entry and           and at exit is available in Table 3.3. The assumptions
                          exit points                     underlying the calculation of forecasted contracted
                                                          capacity are detailed in Table 3.1.
 Art. 30(a)(iii)          Quantity and direction          Demand is assumed to be met first by domestic
                          of the gas flow for entry       production (i.e. Bellanaboy), with Moffat providing the
                          and exit points                 marginal source of gas. The direction of gas flow from
                                                          entry to exit is not a variable in the Matrix RPM that
                                                          effects the calculation of the transmission tariffs.
                                                          However, a representation of how gas flows around
                                                          the network is available on GNI’s transparency
                                                          dashboard, available at the following link.
 Art. 30(a)(iv)           Structural                      The structural representation of the GNI’s
                          representation of the           transmission system is provided in Figure 1.
                          transmission network
 Art. 30(a)(v)            Additional technical            The information involved in the calculation of the
                          information related to          expansion constants and annuitisation factor has been
                          the transmission                provided in CRU/18/247. The files which detail the
                          system, such as length          calculation of these parameters are available for
                          and diameter of                 download at the following link.
                          pipelines

12
An Coimisiún um Rialáil Fóntas Commission for Regulation of Utilities
3 Tariff Setting Process
3.1 Introduction
This section outlines how the CRU sets GNI’s allowed transmission revenue every five years
through a process known as a Price Control. It also details the process followed by the CRU in
setting the transmission tariffs on an annual basis. By charging these tariffs, GNI recovers its
allowed revenue, as approved by the CRU.
3.2 Price Control
The CRU’s role is to protect gas customers by ensuring that GNI spends customers’ money
appropriately and efficiently to deliver necessary services. The CRU does this through what is
called a Price Control, which is carried out every five years. The current five year period started
on 01 October 2017 (PC4). A Price Control sets out the allowed revenue for the 5 year period to
ensure that GNI can safely operate, maintain and invest in the network effectively.
The transmission business’s allowed revenue is made up of three parts:
i. Revenue to cover the transmission business’s operational costs;
ii. A return on capital on the transmission business’s assets; and,
iii. Revenue to cover depreciation of the transmission business’s assets.
In August 2017, the CRU published its decision paper (CER/17/260) on the allowed revenue that
GNI’s transmission business may recover over the Price Control period from 01 October 2017 to
30 September 2022. That decision allowed €924m to be recovered for transmission over the 5-
year period.
GNI as the transmission network operator, then recovers this allowed revenue on an annual
basis through network tariffs which are set by the CRU. Network tariffs are charged to gas
suppliers who may choose to pass them on to their customers.
3.3 Annual tariff setting process
As part of the annual tariff setting process, the CRU analyses any additional revenue requests
from GNI (pass-through costs and extra-over items), over/under recoveries in the previous years
and updated demand projections. These items are now discussed.
13An Coimisiún um Rialáil Fóntas Commission for Regulation of Utilities 3.3.1 Pass-through costs and extra-over items Each year GNI send a tariff submission to the CRU. This submission includes requests for additional revenues which are considered either pass-through costs or extra-over items. Pass- throughs are cost items that GNI has no control over or limited control over. Extra-over items are generally new capex or opex work items that could not have been reasonably foreseen at the time the Price Control was set. Following review for efficiency, the CRU has decided to allow GNI an additional €20.0m for pass- through costs. This includes an additional allowance for a ‘typical’ pass-through cost item, in this case €3.31m for CO2, €110k for the CRU levy, €43k for safety initiatives, and -€760k for rates. In addition, the CRU has provided an allowance for an extra-over item, i.e. €17.3m for shrinkage7. As was the case for gas year 2020/21, the CRU decided to treat the expenditure associated with shrinkage as a pass-through cost so that any costs not spent can be recovered as part of the k- factor.8 For this reason, it is included in the €20.0m pass-through cost allowance. GNI did not seek any other transmission extra-over items for 2021/22. The substantial additional allowances for CO2 and shrinkage are a result of the increases in the cost of purchasing CO2 allowances and the commodity cost of natural gas, respectively. 3.3.2 Correction Factor (or k-factor) As transmission tariffs are calculated in advance, the CRU must use forecast data i.e. forecast inflation, revenues and pass-through costs. However, once actuals are available, we carry out an adjustment to take those into account. This is called a Correction Factor or k-factor adjustment. The k-factor is for 2 years previous as that is when the actual data is available i.e. when setting the tariffs for 2021/22 the CRU closes out the year 2019/20. Having reviewed the actual data for 2019/20, it has been determined that GNI has over recovered for that gas year. The over recovery is €1.95 million. This money will be returned to the customer, with interest, through the k-factor mechanism previously mentioned. The formula for the k-factor is set out in CER/03/170. There are two key rules to the k-factor. These rules are in place to ensure that tariffs are stable and to ensure that volatility is avoided. The rules are as follows: 7 Shrinkage gas includes own use gas (OUG), which is gas used to operate the network and unaccounted for gas (UAG) (e.g. gas losses). Previously, the transmission business’ shrinkage costs were not included in the allowed revenue and were therefore not recovered through tariffs. Instead GNI billed these costs to gas shippers directly on a monthly basis, based on their throughput. However, as part of the CRU’s tariff network code decision (CRU/19/060), it was decided that from 2020/21 onwards, shrinkage should be included in the allowed revenue. As this is not a new cost, it does not increase overall the costs faced by shippers or end customers. 8 The CRU will review whether shrinkage should continue to be treated as a pass-through cost as part of its Price Control 5 decision. 14
An Coimisiún um Rialáil Fóntas Commission for Regulation of Utilities

     Rule 1. Any over-recovery up to 105% of allowed revenues is returned in the following gas
     year (e.g. any 2019/20 k-factor >105% is returned in gas year 2022/23 not gas year 2021/22).
     This is to ensure that the tariffs are stable and that volatility is avoided.

     Rule 2. Any over- or under-recovery of revenue attracts an interest rate of Euribor (interbank
     lending rate) +2% and any over-recovery in excess of 103% of revenue attracts an interest rate
     of Euribor +4% (e.g. any 2019/20 k-factor >100% & 103% & 105% is credited the following year, with Euribor +4% applied for
both years.
10 This was noted in Section 3.3.2 of CRU/20/097.
11 €11.45m - €6.8m

15
An Coimisiún um Rialáil Fóntas Commission for Regulation of Utilities
annual tariff setting process GNI submits updated demand figures which take into consideration
the latest forecasts. These are reviewed and are used in setting the transmission tariffs.
In order to establish demand forecasts for 2021/22, GNI has analysed recent trends and then
applied these learnings to the elements it typically draws from to forecast gas demand for the
coming gas year. When Covid-19 restrictions were put in place, there was a significant fall in gas
demand in certain customer categories, particularly in the non-daily metered (NDM) industrial &
commercial sector. However, since then, demand has begun to recover and is broadly in line
with expectations with seasonal demand.
3.3.3.1 Assumptions
The forecast demands for 2021/22 are based on the assumptions outlined in Table 3.1. These
assumptions influence the demands forecasted at the Entry Points to the transmission system
and at the Exit from the transmission system.
Table 3.1: Demand assumptions
Assumption Description
Weighted Annualised It is anticipated that shippers will continue to optimise their capacity
Capacity Bookings bookings via a mixture of annual and short-term capacity products.
This applies to the Large Daily Metered (LDM) and Daily Metered (DM)
sectors12. Short-term capacity forecasts are weighted depending on
the month when the booking is expected to arise. For example, if you
buy a short-term capacity product in August it is cheaper than buying a
short-term capacity product in February. This is due to a lower
multiplier being applied. These multipliers are set out in Section 5.3.
The value of these capacity products is converted into an annual
value. In this way the forecast bookings are “annualised”.13
Power generation GNI’s demand assumptions are based on Eirgrid’s 2020-2029
Generation Capacity Statement (GCS) published in August 2020.
Power demand is based on Eirgrid’s Median Electricity Demand
scenario. Adjustment applied to 2021/22 electricity forecast based on
differences between forecast and actual electricity demand to date.
The Power sector is expected to increase demand relative to the
12 The customer category classifications for LDM, DM and NDM are set out in the GNI Code of
Operations under Part F, Section 2 Classification.
13 An example of how capacity forecasts were annualised is shown in the 2014/15 Transmission Tariffs
decision paper (CER/14/140).
16An Coimisiún um Rialáil Fóntas Commission for Regulation of Utilities
Assumption Description
2020/21 demands due to overall growth in the electricity sector.
However, due to decreased booking of daily capacity, the overall
annualised capacity bookings are lower.
Daily Metered (DM) The LDM & DM sector is expected to increase its level of capacity
Industrial & bookings relative to the 2020/21 tariff demands. This reflects recent
Commercial (I/C) increased demand in the sector and strong GDP growth forecasts
(4.67% for gas year 2021/22).
Non-Daily Metered The NDM sector capacity booking is derived by the Annual Quantity
(NDM) (AQ) and Supply Point Capacity (SPC) setting process in GNI, and
there is a requirement on this sector to book a peak day (1 in 50)
requirement at the Exit.
The 1 in 50 has increased in 2021/22 relative to the 2020/21 tariff
demands.
Entry Points Updated production profiles provided by the producers at Corrib have
been utilised. Corrib Production has now come off peak and as a result
capacity booking have decreased at Bellanaboy, resulting in increased
capacity bookings at Moffat, which provides the marginal source of
gas.
3.3.3.2 Demand forecasts
Table 3.2 and Table 3.3 below present GNI’s transmission network demand forecasts for gas
year 2021/22. For context, these forecasts are presented alongside GNI’s actual demands for
2019/20, the 2020/21 forecast for tariff setting and GNI’s most up to date forecast for 2020/21.
Highlighting the forecast demands for the upcoming gas year, against the demands forecast
when setting the tariffs last year is particularly useful, as higher/lower demand relative to last
year will lead to upward/downward pressure for the upcoming gas year.
Table 3.2: Transmission commodity demand forecast summary - MWh
Demand 19/20 20/21 20/21 21/22 Variation Variation Variation
actual tariff updated demand vs 19/20 vs 20/21 vs 20/21
demand forecast forecast forecast tariff update
Entry
Commodity
59,927 57,202 58,410 61,335 2% 7% 5%
Exit
Commodity
58,467 55,869 56,346 59,904 2% 7% 6%
Note: The Exit Commodity total is lower than the Entry Commodity total primarily due to the Isle of Man
offtake, which is not included in the Exit total.
17An Coimisiún um Rialáil Fóntas Commission for Regulation of Utilities
Table 3.3: Transmission capacity demand forecast summary - MWh
19/20 20/21 20/21 21/22 Variation Variation Variation
actual tariff updated demand vs 19/20 vs 20/21 vs 20/21
demand forecast forecast forecast tariff update
Bellanaboy
65,114 58,646 55,902 44,705 -31% -24% -20%
Entry
Moffat
145,137 161,390 167,123 183,316 26% 14% 10%
Entry
14
WA Total
Entry 216,786 220,061 223,025 228,059 5% 4% 2%
Capacity
WA Total
Exit 281,752 291,425 281,717 282,171 0% -3% 0%
Capacity
Note: The Entry Capacity is lower than the Exit Commodity as NDM customers are required to book for
1 in 50 at Exit.
For the forthcoming year, transmission commodity forecasts are 2% higher (entry and exit) than
the actual (outturn) commodity demand for 2019/20 and 7% (entry) and 7% (exit) higher than the
2020/21 commodity forecast for tariff setting. The increase in commodity demand is mostly
driven by increases in gas demand in the power generation and daily metered (DM)
industrial/commercial (I/C) sector. The increase in power generation demand reflects the
increase in electricity demand, while the increase in DM I&C demand reflects strong performance
in the technology and pharmaceutical sectors and strong GDP growth forecasts.
In terms of capacity, GNI’s forecasted weighted annualised (WA) Exit capacity demand for
2021/22 is similar to the outturn for 2019/20 and 3% lower than the 2020/21 capacity forecast for
tariff setting. Although there is increased commodity demand in the power generation sector, this
is not reflected in WA capacity bookings relative to 2020/21 tariff setting, due to decreased
booking of daily capacity by this sector, which has been observed in gas year 2020/21. The
decrease in WA capacity demand at Exit puts some upward pressure on Exit tariffs.
GNI’s forecasted weighted annualised Entry capacity is 5% higher than the outturn for 2019/20
and 2% higher than the 2020/21 capacity forecast for tariff setting. The increase in capacity
forecasts at Entry reflects the overall trend of increasing gas commodity demand. However,
unlike the Exit capacity forecast, this trend is not offset by a decrease in daily capacity bookings.
This may be reasonably associated with the availability of secondary capacity trading at Entry,
which provides more options to adjust capacity bookings than for Exit. In terms of the source of
supply, Entry supply continues to move to the more expensive Moffat Entry point as Corrib
production declines, resulting in greater revenue recovery by GNI. GNI’s forecasted weighted
14WA stands for weighted annualised. Shorter-term bookings, which can occur at different times of year
(different costs) are adjusted for representation as an equivalent annual amount so that the overall
demand can be compared more easily across years.
18An Coimisiún um Rialáil Fóntas Commission for Regulation of Utilities annualised Entry capacity at Moffat is 26% higher than the outturn for 2019/20 and 14% higher than the 2020/21 capacity forecast for tariff setting. The increase in WA capacity demand at Entry puts some downward pressure on Entry tariffs. 19
An Coimisiún um Rialáil Fóntas Commission for Regulation of Utilities

4 TAR NC Article 30 information
Article 30 of the TAR NC requires certain tariff information to be published ahead of the
upcoming tariff period (i.e. gas year 01 October 2021 – 30 September 2022). This includes detail
on elements of the CRU’s allowed revenue methodology, GNI’s Matrix Model, and other
additional information all of which is used either directly or indirectly to calculate GNI’s allowed
revenue and the transmission tariffs for the 2021/22 gas year. Table 4.1 sets out this information.
For further details, please refer to Article 30 of the TAR NC.

20
An Coimisiún um Rialáil Fóntas Commission for Regulation of Utilities

Table 4.1: Information on TSO Revenue - Revenue level

 TAR NC Article              Description                                Period        Detail
 Art. 30 (1)(a)              Information on parameters used in          2021/22       See Section 2.4.
                             the reference price methodology
                             that are related to the technical                        A simplified version of the transmission tariff model is available on GNI’s
                             characteristics of the transmission                      website at the following link. A full version of the tariff model is available
                             systems                                                  from GNI at the following link.
 Art. 30 (1)(b)(i)           Allowed revenue                            2021/22       €212.77m in transmission services revenue and €97k in non-
                                                                                      transmission services revenue (21/22 monies).15
 Art. 30 (1)(b)(ii)          Changes in allowed revenue                 2020/21 –     Increase in allowed revenue by 8%, nominal, (6.7%, real) from gas year
                                                                        2021/22       2020/21 to 2021/22. This increase is partly a result of the additional
                                                                                      shrinkage allowance provided for in section 3.3.1. In addition, when
                                                                                      setting the PC4 allowed revenue the CRU intentionally profiled the
                                                                                      revenue to increase over the PC4 period in line with forecasted supply
                                                                                      increasing at the more expensive Moffat entry point, resulting in greater
                                                                                      levels of revenue recovery by GNI. This was done to enhance tariff
                                                                                      stability.
 Art. 30 (1)(b)(iii)(1)      Asset types and their aggregated           At start of   Asset type                                Net book value (15/16 monies)
                             value                                      current       Pipelines/AGIs (incl. GTTW)               €1246.4
                                                                        regulatory    Land                                      €1.9m
                                                                        period –      Equipment                                 €19.2m

15   See section 3.3 of CRU/19/060 for further information on transmission and non-transmission revenue.

21
An Coimisiún um Rialáil Fóntas Commission for Regulation of Utilities
TAR NC Article Description Period Detail
01.10.2017 Compressors €62.9m
Buildings €17.6m
Total €1348
Art. 30 (1)(b)(iii)(2) Cost of capital and calculation 2017/18- 4.63% WACC – cost of debt is calculated using the estimated yield on
methodology 2021/22 government bonds plus a debt premium, while the cost of equity is
calculated using the CAPM model.
Art. 30 Initial asset valuation methodology n/a Acquisition cost (historic cost).
(1)(b)(iii)(3)(a)
Art. 30 Asset revaluation methodology n/a Acquisition cost, indexed with inflation (HICP), as a proxy for current
(1)(b)(iii)(3)(b) replacement cost.
Art. 30 Evolution of the value of the assets n/a Assets are added to the Regulated Asset Base (RAB) at their acquisition
(1)(b)(iii)(3)(c) cost (historic cost). The assets are indexed with inflation (HICP) in order
to calculate the value of an asset at the required point in time. The
assets are then depreciated, using straight line depreciation, the rate of
depreciation is set by the asset life. Assets are removed from the RAB
when they are fully depreciated or disposed of.
Art. 30 Depreciation periods and amount At start of Asset Type Depreciation Annual Depreciation
(1)(b)(iii)(3)(d) per asset type current Period (Asset life) Amount (15/16
regulatory monies)
period – Pipelines/AGIs/GTTW 50 years €40.6m
01.10.2017 Land 40 years €0.1m
Equipment 5 years €5.7m
Compressors 25 years €5.1m
22An Coimisiún um Rialáil Fóntas Commission for Regulation of Utilities
TAR NC Article Description Period Detail
Buildings 40 years €0.8m
Art. 30 (1)(b)(iii)(4) Operational expenditures 2021/22 €77.61m + €20.00m additional costs set out in section 3.3.1 (21/22
monies)
Art. 30 (1)(b)(iii)(5) Incentive mechanisms and 2017/18- Capex and opex incentives16, with an ongoing controllable opex
efficiency targets 2021/22 efficiency challenge of 1%.
Art. 30 (1)(b)(iii)(6) Inflation indices 2017/18- Harmonised Index of Consumer Prices17
2021/22
Art. 30 (1)(b)(iv) Transmission services revenue 2021/22 €212.77m (21/22 monies)
Art. 30 (1)(b)(v)(1) Capacity-commodity split 2019/20 90:10
Art. 30 (1)(b)(v)(2) Entry-exit split 2019/20 33:67
Art. 30 (1)(b)(v)(3) Intra-system/cross-system split 2020/21 100% intra-system as there are currently no cross-system flows.
Art. 30 (1)(b)(vi)(1) Actual revenue recovered in kt-2 2019/20 Actual revenue recovered was €177.31m in nominal monies.
(i.e. 19/20)
Art. 30 (1)(b)(vi)(2) (i) Correction factor for the year Kt- 2019/20 See section 3.3.2 for explanation. (i) €1.95m for 19/20, total is €8.77m,
2, (ii) its effect on revenues in year (ii) Reduced allowed revenue by €9.7m, (iii) Refer to Section 3.3.2.
Kt (21/22) and (iii) incentives.
Art. 30 (1)(b)(vii) Intended use of auction premium 2020/21 N/A - no auction premium applied
Art. 30 (1)(c)(i) Commodity-based tariffs 2021/22 See Table 5.1
Art. 30 (1)(c)(ii) Non-transmission tariffs 2021/22 The Corrib Linkline Element of the Bellanaboy tariff is considered a non-
16 See Section 7 of CER/17/260 for further detail regarding the incentives applied to the TSO.
17 See ‘Inflation’ and ‘Indexation’ tab of CRU/21/058a Transmission revenue model 2021/22 for further detail.
23An Coimisiún um Rialáil Fóntas Commission for Regulation of Utilities
TAR NC Article Description Period Detail
transmission tariff18 under TAR NC. See Table 5.1
Art. 30 (1)(c)(iii) Reference prices for other points 2021/22 See Table 5.1
than interconnection points
Art. 30 (2)(a)(i) Information about tariff changes 2020/21 - See Appendix A for the difference in tariffs and Section 3 for an
and trends 2021/22 explanation of this difference.
Art. 30 (2)(a)(ii) Information about tariff changes 2017/18 - A simplified model is available on GNI’s website at the following link.
and trends 2021/22 This allows the calculation of the possible evolution of tariffs.
Art. 30 (2)(b) A simplified tariff model 2021/22 A simplified model is available on GNI’s website link.
Art. 30 (3) Information on the amount of 2021/22 Market Unit Forecasted Unit Forecasted
forecasted contracted capacity and Segment Contracted Gas Flow
the forecasted quantity of the gas Capacity19
flow on non-relevant points Power gen MWh/d 140,161 GWh/y 34,390
DM MWh/d 45,193 GWh/y 12,934
NDM MWh/d 96,606 GWh/y 12,524
CNG MWh/d 211 GWh/y 57
18 Non-transmission services are “the regulated services other than transmission services and other than services regulated by Regulation (EU) No 312/2014
that are provided by transmission system operator”.
19 Weighted Annualised Capacity Bookings, see Table 3.1.
24An Coimisiún um Rialáil Fóntas Commission for Regulation of Utilities
5 CRU Decision on Transmission Tariffs
for 2021/22
5.1 Transmission tariffs for 2021/22
The previous sections outline the elements affecting the transmission tariffs such as the
adjustments which occur to the allowed revenues. These adjustments are then taken together
with the allowed revenue from the Price Control to calculate the allowed revenue for the
forthcoming tariff year. This allowed revenue is then inputted into GNI’s Transmission Matrix
Model along with the updated demand forecasts and correction factor to calculate the tariffs for
the upcoming gas year. The transmission tariffs which will apply from 01 October 2021 to 30
September 2022 based on a revenue of €212.77m (2021/22 monies) are set out below.
Table 5.1: Transmission tariffs for 2021/22
Bellanaboy RNG Moffat (IP) Domestic Gormanston (IP)
entry entry20 entry exit exit
Firm21 capacity - 633.7622 104.32 312.89 454.70 432.40
€/peak day MWh
Commodity - 0.114 0.238
€/MWh
With these updated tariffs, the transportation cost of GB gas23 to Ireland will increase by c.5% (in
real terms (i.e. adjusted for inflation)). This increase in tariffs is mainly due to increases in
shrinkage costs and changes in how capacity is booked. The higher shrinkage costs are
associated with rises in CO2 and gas commodity costs. As regards to changes in booking
behaviours, there has been a reduction in the bookings of more expensive daily capacity
products at Exit. This has the effect of reducing revenue recovery and therefore places upward
pressure on Exit tariffs.
20 As part of the CRU’s decision on the Harmonised Tariff Methodology for Gas (CRU/19/060), a single
transmission entry tariff has been set for RNG, based on one ‘notional entry point’ that is derived from
the average of three geographically dispersed locations in counties Cork, Galway and Meath. There
are currently no RNG entry points operational on the transmission network.
21“Firm” means gas transmission capacity contractually guaranteed as uninterruptible by the
transmission system operator.
22 This is composed of two elements; one to remunerate the transmission services revenue of GNI
(€130.44) plus a Corrib Linkline Element (€503.32), which will remunerate the revenues relating to the
Corrib Linkline (Corrib Partners).
23 The transportation cost of GB gas (Moffat entry capacity tariff + domestic exit capacity tariff) is
important because, generally, Irish wholesale gas prices are generally set by the GB price of gas plus
the cost of transporting gas from GB to Ireland via the interconnectors, as GB gas is the marginal source
of gas supply to Ireland.
25An Coimisiún um Rialáil Fóntas Commission for Regulation of Utilities
For comparison, Table 5.2 below provides the 2021/22 transportation cost of GB gas relative to
those in recent years (in nominal terms (i.e. without adjusting for inflation)). Tariff costs have
increased in the last two years, mainly due to the cost of shrinkage24 moving into the allowed
revenue. Despite these increases, due to reductions in the previous three years, the cost of
transportation of GB gas is similar to 2016/17 and 2017/18 levels.
Table 5.2: Recent cost of transportation for GB gas (nominal)
2016/17 2017/18 2018/19 2019/20 2020/21 2021/22
Capacity –
788.605 761.263 715.864 669.00 722.44 767.59
€/peak MWh
5.2 Impact on a residential customer’s bill
Network tariffs are charged to gas shippers/suppliers. It is up to suppliers whether to pass on
these costs to their customers. Currently, the CRU estimates that network tariffs charges
(transmission and distribution collectively) make up approximately 31% of a residential
customer’s bill. The transmission network tariff charge, if fully passed onto gas customers, would
equate to a c. 0.5% (or €4) increase (nominal) on an average residential gas customer’s annual
bill. However, the CRU would note that the pricing decisions of suppliers do not just reflect
network charges but also the other charges they are faced with.
As in previous years, the CRU is also publishing, today, the distribution network tariffs. The
distribution tariffs are set to decrease (by c. 3.1%). It is estimated that the combined change in
transmission and distribution tariffs equates to aAn Coimisiún um Rialáil Fóntas Commission for Regulation of Utilities
seasonal factor profile for gas year 2021/22. The CRU decided to not to change the profile for gas
year 2021/22 as set out in its annual tariff network code Article 28 paper (CRU/21/049).
Table 5.3: Multiplier and seasonal factor profiles25
Month Quarterly % Monthly % Daily %
October 12.81% 0.64%
38.43%
November 12.81% 0.64%
December 17.08% 1.14%
January 29.89% 1.99%
80.69%
February 34.16% 2.28%
March 25.62% 1.71%
April 12.81% 0.64%
13.27%
May 0.97% 0.05%
June 0.97% 0.05%
July 0.97% 0.05%
August 2.61% 0.97% 0.05%
September 0.97% 0.05%
Total 135.0% 150.0% 279.44%
5.4 Virtual Reverse Tariff 2021/22
Virtual Reverse Flow (VRF) is a ‘reverse flow’ service offered on a virtual interruptible basis, at
the Interconnection Points, to enable Shippers to virtually flow gas from Ireland via Moffat and
into Ireland via Gormanston.26 In accordance with the CRU’s TAR NC decision paper, for gas
year 2019/20 a new tariff was introduced for VRF, which replaced the previous registration fee
approach. The calculation of the VRF tariffs at Moffat and Gormanston are now based on the
TAR NC principles and requirements for standard interruptible capacity products. Art. 16 of TAR
NC specifies the calculation of reserve prices for standard interruptible capacity products by
applying an adjustment to the reserve prices for the corresponding standard firm capacity
products.
25 To understand how this works, consider the following example: The reference price for Moffat entry
is €301/MWh. If you wanted to book monthly capacity for December, you could calculate the cost by
referring to the table and applying the relevant combined multiplier & seasonal factor; in this case
17.08%. That would result in the following – €301/MWh * 17.08% = €51.4/MWh.
26 For example, if there is a total nomination of 100 units of gas for delivery from GB to ROI and a gas
shipper in Ireland wishes to virtually transport 10 units of gas from ROI to GB, these 10 units are netted
off the 100 units, resulting in the delivery of 90 units into the ROI gas network.
27An Coimisiún um Rialáil Fóntas Commission for Regulation of Utilities
Full details on how the CRU sets the VRF tariffs for Moffat and Gormanston and the reasoning
for its approach, can be found in section 3.11 of the CRU’s TAR NC decision paper
(CRU/19/060), in summary:
• The VRF tariffs are based on the Moffat exit point and Gormanston entry point reference
prices, as calculated by the Matrix RPM.
• A Pro Factor of 8% is applied to the Moffat and Gormanston VRF products, reflecting the
probability of interruption.
• A risk premium of 10% is applied to both the Moffat and Gormanston VRF products.
• A market interaction factor of 30% applies to the Moffat VRF product only to bring the
price below that of the equivalent forward flow tariff for reasons of cross-border trade.
These inputs result in an A-factor (i.e. overall adjustment) of 6 for Moffat VRF and an A-factor of
2.25 for the Gormanston VRF. The CRU decided to not to change the adjustment for gas year
2021/22 as set out in its annual tariff network code Article 28 paper (CRU/21/049).
Table 5.4: Virtual reverse flow (VRF) tariffs for 2021/22
Gormanston (IP) VRF entry Moffat (IP) VRF exit
Capacity – 74.58 295.31
€/peak day MWh
Commodity - 0.114 0.238
€/MWh
28An Coimisiún um Rialáil Fóntas Commission for Regulation of Utilities 6 Conclusion This information paper aims to provides a single resource for all tariff related information, ranging from; how it sets tariffs on an annual basis, the variables that cause changes in the tariffs from one year to the next, and the 2021/22 transmission tariffs. These tariffs will take effect from 01 October 2021. By making all tariff related information available to customers, in a single location, the CRU aims to make it easier for customers to understand how tariffs are set and what causes them to change from one year to the next. An important tool, also available to the public, is the simplified tariff model available on Gas Networks Ireland’s website at the following link. This simplified model enables customers to further identify how transmission network tariffs are affected by demand and revenue variations, and to estimate possible evolution of tariffs. 29
An Coimisiún um Rialáil Fóntas Commission for Regulation of Utilities

Appendix A Transmission Tariffs 2021/22

30
You can also read