Maximizing revenue in airline industry through air cargo operations
←
→
Page content transcription
If your browser does not render page correctly, please read the page content below
E3S Web of Conferences 244, 08019 (2021)                                 https://doi.org/10.1051/e3sconf/202124408019
EMMFT-2020

      Maximizing revenue in airline industry through
      air cargo operations
      Nisara Paethrangsi1,*
      1College   of Hospitality Industry Management, Suan Sunandha Rajabhat University, Thailand

                     Abstract. This research aims 1) to identify the impact of pricing strategies
                     on airlines’ revenues, 2) to identify the impact of non-pricing strategies on
                     airlines’ revenues, 3) to explore the significance of revenue management to
                     airlines competitive advantage. The behavioural-demand based pricing,
                     psychological pricing, capacity management and over contract booking
                     strategies are determined as independent variables. A dependent variable is
                     the competitive advantage, and a mediator is revenue management.
                     Primary data was collected from an online survey of 500 airline industry
                     and revenue management strategies personnel; there were only 424
                     completed questionnaires in return. Results show that larger competitive
                     advantage is associated with non- pricing strategy which is the over
                     contract booking and there is a positive relationship between the
                     psychological pricing and competitive advantage, as compared to the
                     behavioural-demand based pricing and capacity management based
                     strategic approaches.

      1 Introduction
           Air cargo revenues are currently dramatically increased, the business is providing
      support to airlines at a time when passenger revenues collapsed. Revenue increase for air
      cargo has gained an important strategy of most cargo airlines and passenger airlines [1].
      The need for speed in delivering of goods is essential in today new normal life after the
      Covid -19 pandemic. The main export markets for Southeast Asia nations (ASEAN) are the
      USA and Europe, with commodities like garments, shoes, electronics and hard-disk drives.
      Cargo movements from Thailand and CLMV countries (Cambodia, Laos, Myanmar and
      Vietnam) are on the rise. In the past, revenue from cargo of the passenger airlines business
      was poor, cargo income was only a small proportion of airline revenues, and the
      management have not allocated both manpower and capital resources on it. Profit from air
      cargo did not gain attention and it was often seen as no more than by-product operations to
      fill belly hold space in the aircraft [2].
           Airline industry both passenger airlines and cargo airlines are facing challenges due to
      many factors that range from economic, social and politics. All Airlines are operating with
      a small margin about five to seven present only and are forced to seek for extra revenue to
      survive the business [3]. Therefore, revenue maximizing of air cargo will be a prime

      *   Corresponding author: nisara.pa@ssru.ac.th

© The Authors, published by EDP Sciences. This is an open access article distributed under the terms of the Creative Commons
Attribution License 4.0 (http://creativecommons.org/licenses/by/4.0/).
E3S Web of Conferences 244, 08019 (2021) https://doi.org/10.1051/e3sconf/202124408019
EMMFT-2020
requirement and this is increasing necessity, that airline should give proper attention to the
operations of air cargo. Population of all ASEAN (Association of Southeast Asian Nations)
are estimated 655.51 million inhabitants and generates GDP of approximately 3.11 trillion
U.S. dollars, a significant increase from the previous year’s [4]. Governments across the
region focus on develop the air transportation. The expanding labour force and a rapidly
increasing middle class imply the rapid economic growth in Asia.
The modernization of retailing and air transportation services within the Asian region
reflects these major shifts in consumer demographics. By year 2036, aviation in ASEAN
region is expected to create $1.7 trillion in economic activity [5]. However, the predicted
loss between Asia-Pacific airlines are expected to lose $ 29 billion in 2020 because the
airline industry has been affected from the COVID-19 pandemic [6]. Global air cargo
markets in 2020 showed a capacity remained unable to meet demand as a result of the loss
of belly cargo operations on passenger aircraft that have been parked. Cargo operations of
airlines in Asia-Pacific fall by 21.3 percent in the mid-year of 2020 compared to the year
earlier [7].
Both passenger airlines and cargo airlines in Thailand, are estimated to support US
$11.4 billion of GDP in the country [1]. Thailand’s air cargo performance, has owned the
large investment in transport infrastructure, and was ranked the second in ASEAN, and was
the seventh in ASIA, while Singapore is the first in ASEAN. Thai government has
extensively invested in transport infrastructure under the 12th National Economic and
Social Development Plan, which aims to cut the country's logistics costs to 12% of GDP by
2021 [8].
Airlines in Asia Pacific account for more than a third of global air freight transportation
with strong networks and air cargo operations expertise [6]. During the hard time of global
pandemic, airlines in this region have played a key role in carrying medical supplies
personal protective equipment (PPE) and other essential goods including vaccines, as
passenger aircrafts were grounded thus the capacity was limited. As soon as the economic
activity rebounds, demand of global export is increasing and speed of delivery is an
important driver, which air cargo can full the valuable goods delivery to satisfy customers.
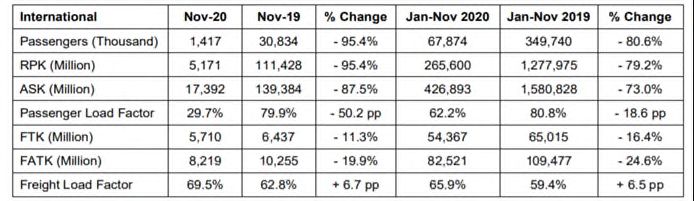
In 2020, number of freight tonne kilometres (FTK) in air cargo was declined of 6.4%. The
international air cargo demand fell by 15.5%, whilst offered freight capacity plunged by
24.4%.
Table 1. International Scheduled Service of Asia Pacific Airlines 2019-2020.
• RPK = revenue passenger kilometres/ • ASK = available seat kilometres
• FTK = freight tonne kilometres/ • FATK = available freight tonne kilometres
Time sensitivity and customer personal preferences made the air cargo be a key driver
in air transportation, and it also affects airlines’ operations strategies [9]. Moreover,
commercial passenger airlines continued to face a crisis, with operations remain terrible, so
the need for managing cargo operations to maximize revenue is necessary for airlines. The
aims of this research are; 1) to identify the impact of pricing strategies on airlines’
2
E3S Web of Conferences 244, 08019 (2021)                       https://doi.org/10.1051/e3sconf/202124408019
EMMFT-2020

     revenues, 2) to identify the impact of non-pricing strategies on airlines’ revenues, 3) to
     explore the significance of revenue management to airlines competitive advantage.

     2 Theoretical and Literature Review

     2.1 Characteristics of air cargo market and revenue management

     Customers choose various types of transportation mode depends on value of goods,
     urgency, cost of transport, vulnerability of goods, location of manufacture, weight and
     density, types of goods as hazardous or not, delivery point accessibility and existence local
     condition [10]. Although price mechanism plays a critical role in decision, the urgency and
     life threatening could be the deciding factors. For high value equipment such as musical
     instruments and aircraft engine parts, air cargo is the answer. In addition, the perishable
     goods like fresh flowers, fruit and vegetables need to be kept refrigerated in containers
     while shipping, these benefit to air cargo business.
         Price charge of cargo is based on shipment weight, volume and surface modes of
     transport. Volume or tonne-kms of commodities transport by air categorized into 27% is a
     high technology goods, 19% is capital equipment, 17% is apparel, textiles and footwear,
     16% is consumer products, 125 intermediate products and 5% is refrigerated foods [11]. Air
     cargo is the fastest transportation mode in the world, which is 20 to 30 times faster than
     going on sea. 5 to 10 times faster than using the train, 7 to 15 times faster than transport by
     car [12].
         As the new normal life of people, the value of time increases. Flying is not only
     providing a pleasure and a luxury, but also a necessity for work and life. Air transportation
     is the most safety, it is higher than that of railways, sea travel, and road transportation [13].

     2.2 Behavioural, demand-based pricing and competitive advantage
     Demand-based pricing or behavioural pricing concept is using consumers demand and
     value perception in setting a price of products or service as central elements [14]. Price
     fairness is significant matter while the consumers prefer cheaper price, and the companies
     want to get profits. Most of airlines fear of customers perceived the price is unfair, therefore
     they provides tools for the forwarders to offer customized price and service quotes.
         Nair [15] proposed the vital master plan of pricing and non- pricing revenue
     maximization and ruthless advantage in the hotel industry, results showed that hotels tend
     to check the demand based pricing, voluntary product pricing and promotion pricing. This
     price strategy associated critically with the figure of revenue performance. In this sense; the
     hypothesis has been proposed as; Hypothesis 1: There is a critical relationship between
     behavioural demand based pricing and competitive advantage.

     2.3 Psychological pricing and competitive advantage

     Psychological pricing is a price strategy based on the theory that certain prices have a
     bigger psychological impact on consumers than others. Industry may adopt this
     psychological price to products, e.g. charm pricing, prestige pricing, buy one get one free,
     comparative pricing and dynamic pricing [16]. Most of the rate charged for air cargo is
     done under contracts between freight forwarders and airlines and rate agreements are
     confidential [11].
        Yuen [17] discussed psychological price strategy plays a critical role in economics by
     guiding the efficient allocation of resources in market-based economies. Research split the

                                                     3
E3S Web of Conferences 244, 08019 (2021) https://doi.org/10.1051/e3sconf/202124408019
EMMFT-2020
prices scheme into two groups and the result showed that the quantities sold by stores with
high prices do not respond one-for-one to changes in the quantities sold by stores with low
prices. The study revealed that consumers generally pay attention to prices when shopping.
Many price-conscious consumers go shopping in many places in order to buy lower price
products. Airline customers tend to look for the best price from many airlines before buying
ticket. Factors concerned price are comparability of service, buyer-seller relation,
knowledge of market, transparency and justice and reliability of brands. Thus, the
hypothesis is suggested as; Hypothesis 2: There is a critical relationship between
psychological pricing and competitive advantage
2.4 Capacity management and competitive advantage
Capacity of cargo is an uncertain stowage due to the nature of shipment by air, there are
some no-shows, and the amount of passenger baggage is unpredicted. As passengers
request a specific flight to travel, cargo shipments customers demand only an origin and
destination. As long as the shipment has to deliver at the destination by the time passenger
requested, route assignment is flexible. Airline can manage capacity efficiently if the
estimation of the cargo show-up rate at departure calculates accurately [18].
Thus, this hypothesis is used to test links between capacity management and the
competitive advantage of an airline. Hypothesis 3: There is a critical relationship between
capacity management and competitive advantage.
2.5 Over contract booking and competitive advantage
Levin & Nadiek [19] proposed capacity utilizations, price structure and costs associated
with accepted bookings. The allotment contracts between airline and freight forwarder are
fixed the shipping rate and the amount of reserved capacity. The obligation is allotment will
be kept for at least a few months. Many transactions occur in the contract period and
airlines gain benefit from effective capacity management which have booked from freight
forwarders. Popescu [18] describes the ability to evaluate space utilization, and forecast
excess capacity for free sales are crucial impact on overbooking levels and revenue gain on
excess.
Wals & Schinkel [20] discussed relationship between over contract booking and
competitive advantage in hotel and airline business that they have positive relationship with
each other. Over contract booking is beneficial to both consumers and firms. Therefore; the
hypothesis has been suggested as; Hypothesis 4: There is a critical relationship between
over contract booking and competitive advantage.
2.6 Mediation of revenue management between behavioural, demand-based
pricing and competitive advantage
Revenue maximization concept of cargo operations is different from passenger operations
concept. Weight and volume generate revenue for cargo management while cabin and
passenger management uses dynamic price strategy, that airline charges passengers on
same flight differently, depends on a specific prices class is open at a time buying.
Similarly to cargo operations, there are various types of goods such as mail, fresh food, live
animal, hi-tech devices and even empty space. Thus, the revenue generating of cargo
operations does not come from only price of shipment, the cost related to handling, special
packaging, capacity management and fuel burning are concerned. The weight, volume,
capacity control and profit per kg of are variable [21].
4E3S Web of Conferences 244, 08019 (2021) https://doi.org/10.1051/e3sconf/202124408019
EMMFT-2020
Zhou, Brown, & Dev [22] surveyed hotel and airline industry demands, their research
discovered that there are many price sensitive customers, if a business adapts a price
scheme it can get more customers. Research also found larger impacts of pricing to number
of customer. It is reasonable to expect that demand based pricing has impact on an airline
industry revenue. Hypothesis 5: Revenue management plays as a critical mediator between
demands based pricing and competitive advantage
2.7 Mediation of revenue management between psychological pricing and
competitive advantage
Kharitonova [23] discusses revenue management as a moderator from the research of
business intelligence role and analytics within hospitality revenue management, nearly all
of revenue tasks are supported by business intelligence and analytics functionalities,
Research provided evident that revenue management runs a business with the best
performance. Revenue has impact on firm’s performance improvement and correlation
between psychological pricing and competitive advantage is positive [24].
Therefore, the suggested hypothesis is; Hypothesis 6: Revenue management plays as a
critical mediator between psychological pricing and competitive advantage
2.8 Mediation of revenue management between capacity management and
competitive advantage
Cargo revenue management aims to maximize revenue by mean of managing tariff rates
and allotments. Cargo carried on passenger flights is highly uncertain. The volume of cargo
may be changed only thirty minutes before flight departs or even no show cargo [11] Not
only uncertain volume, air cargo still suffers from the dimension of volume, mass or weight
and container positions [25].
Although air cargo revenue management is similar in many ways with other business,
there are particular complexities. Capacity forecasting is the key role that carrier must
understand how much space they can sell for excess income.
The accuracy of forecasting and available actual cargo capacity for sale relate to
revenue and competitive advantage [11]. Hence; the suggested hypothesis is; Hypothesis 7:
Revenue management plays a critical mediator between capacity management and
competitive advantage.
2.9 Mediation of revenue management between over contract booking and
competitive advantage
Freight forwarder makes a contract with airline in advance that guarantee certain capacity
on many flights at a pre- agree rate. The forwarder can return unrequired capacity to airline
up to 72 hours before departure otherwise pay for penalties of 25-100% of the contract rate
[11]. When cargo capacity has been estimated the allotment allocation will be deducted to
see the actual remaining.
At this point, an over contract booking is applied; this depends on obligations between
freight forwarders and airlines. Same concept as hotel staff will calculate the optimal
number of bookings for hotel rooms and proposed of overbookings to the management.
Overbooking is a complex process, deeply connected with revenue and yield management.
Business must develop service recovery programs specifying the standard procedures that
employees have to follow when facing an overbooking [26].
However, there is the relationship of overbooking and competitive advantage with the
mediator of revenue management. Thus, suggested hypothesis is, Hypothesis 8: Revenue
5E3S Web of Conferences 244, 08019 (2021) https://doi.org/10.1051/e3sconf/202124408019
EMMFT-2020
management plays as a critical mediator between over contract booking and competitive
advantage.
3 Research Methodologies
Methodology in this study is based on a quantitative source of data collection by using
Structural Equation Modelling (SEM), where the pricing and non-pricing strategies for
revenue management are considered as independent variables and the related variables are
behavioural demand based pricing, psychological pricing, capacity management, and over
contract booking.
Variable of competitive advantage is studied as a dependent variable and the revenue
management is a mediator within the elaborate relations. Complete an online survey. The
population in this research is airline industry employee in Thailand, freight forwarder
enterprises and personnel of strategic firms.
Purposive sampling was selected, where the respondents are airline employees,
supervisors and manager in finance, strategic personnel, business owners who have
experience-based knowledge regarding the pricing and non-pricing strategies to gain
competitive advantage.
Respondent are 58% male and 44% are females. Based on the demographic data, it was
shown that 132 participants are less than 25 years, 180 are 25 to 35 years old, 96 are 35 to
45 years old, while 16 of them are more than 45 years old. For experience related field is
concerned, the outcomes are 16% of respondents have less than two years' experience,
42% with 2 to 5 years' experience, 32% have 5 to 8 years' experience, and 9.4% of them
have experience more than 8 years. However, these demographic statistics identified that
majority of respondents are highly experienced and understand the pros and cons of
revenue management strategies.
4 Results and Analysis
Table 2 shows, after getting the five-point Likert scale based valid research outcomes, the
structural equation modelling and its related tests is predicted average effect of each
variables in this statistical analysis (see table 2) [27, 28].
Table 2. Descriptive Statistics.
Mini-
N Maximum Mean Std. Deviation Skewness
mum
Statistic Statistic Statistic Statistic Statistic Statistic Std. Error
DemBasP 424 1.00 5.00 3.2134 1.05177 -.189 .119
PsychPric 424 1.00 5.00 3.2842 .98632 -.353 .119
CapMange 424 1.00 5.00 3.5333 1.15071 -.564 .119
OverConB 424 1.00 5.00 3.1989 1.20480 -.259 .119
RevnMang 424 1.00 5.00 3.5678 1.13637 -.524 .119
CompAdva 424 1.00 5.00 3.3601 1.14388 -.449 .119
Valid N
424
(listwise)
This indicates that the psychological pricing and demand based pricing are less deviated
from their means position, while the over contract booking and capacity management
highly deviate from their means. This shows that competitive advantage factor is mainly
affected by the strategies of pricing. Statistics of KMO and Bartlett's test are shown (see
table 3) [29].
6E3S Web of Conferences 244, 08019 (2021) https://doi.org/10.1051/e3sconf/202124408019
EMMFT-2020
Table 3. KMO and Bartlett's Test.
Kaiser-Meyer-Olkin Measure of Sampling
.897
Adequacy.
Approx. Chi-Square 6002.549
Bartlett's Test of
df 153
Sphericity
Sig. .000
The statistics show that all the Kaiser-Meyer-Olkin measures are within their threshold
range with an appropriate significance level, that represents this model is a good fit to test
the hypothesis of this research.
Table 4. Rotated Component Matrix.
Component
1 2 3 4 5 6
DB1 .829
DB2 .890
DB3 .846
PP1 .728
PP2 .792
PP3 .803
CM1 .816
CM2 .867
CM3 .809
OC1 .841
OC2 .869
OC3 .859
RM1 .844
RM2 .847
RM3 .859
CA1 .796
CA2 .797
CA3 .832
Table 5. Convergent and Discriminant Validity.
CR AVE MSV RM DB PP CM OC CA
RM 0.907 0.765 0.340 0.875
DB 0.905 0.760 0.388 0.487 0.872
PP 0.819 0.603 0.388 0.583 0.623 0.777
CM 0.901 0.752 0.289 0.524 0.471 0.530 0.867
OC 0.922 0.797 0.507 0.293 0.319 0.334 0.505 0.893
CA 0.934 0.825 0.507 0.454 0.401 0.508 0.538 0.712 0.908
Based on data, the rotated component matrix values of tested items are greater than 0.7
(standard value) and within the threshold range, it represents all the items are effectively
uploaded on the tested model and no more difficulty remains in the uploading process.
As the validity based descriptive outcomes, the average variance extracted values of
each tested item is greater than 0.5, and all the composite reliability values are also higher
than 0.7. No occurrence of any convergent validity issue within this mechanism. The bold
letters based outcomes show the non-occurrence of discriminant validity issues on the
tested variables, because each item has its own identity and different from the other ones.
The model fit indices based information is given as.
7E3S Web of Conferences 244, 08019 (2021) https://doi.org/10.1051/e3sconf/202124408019
EMMFT-2020
Table 6. Model Fit Indices.
CFA Indicators CMIN/DF GFI IFI CFI RMSEA
Threshold Value ≤3 ≥ 0.80 ≥ 0.90 ≥ 0.90 ≤ 0.08
Observed Value 2.330 0.932 0.973 0.973 0.056
Based on data, all the CFA indicators' values are within their threshold range. Like the
RMSEA observed value is 0.056 (lower than 0.08), both outcomes of IFI and CFI are 0.973
(greater than 0.90), the GFI value is 0.932 (greater than 0.80), and the CMIN/DF value is
2.33 (lower than 3). Its graphical representation is shown (see figure 2).
Fig. 2. CFA.
Table 7. Structural Equation Modeling.
Total Effect OverConB CapMange PsychPric DemBasP RevnMang
RevMangP .048 .256** .305** .124** .000
CompAdva .522** .146** .198** .052 .159**
Direct Effect OverConB CapMange PsychPric DemBasP RevMangP
RevMangP .048 .256** .305** .124** .000
CompAdva .514** .105** .150** .032 .159**
Indirect
OverConB CapMange PsychPric DemBasP RevMangP
Effect
RevMangP .000 .000 .000 .000 .000
CompAdva .008 .041** .048** .020** .000
The SEM indicates that there is a critical relationship between the tested variables, like
one percent change in the over contracting booking cause 4.8% deviation in the revenue
management and 52% deviation in the competitive advantage. While these factors are
affected by 26% and 15% through capacity management, 30% and 20% through
psychological pricing and 12.4% to 5.2% through behavioural, demand based pricing. So
the individual revenue management performance caused a 16% change in the outcomes of
competitive advantage (see figure 3).
8E3S Web of Conferences 244, 08019 (2021) https://doi.org/10.1051/e3sconf/202124408019
EMMFT-2020
Fig. 3. SEM.
5 Conclusions
Discussion, the SEM-based statistics have been analysed, and it showed that there is a
highly relation between the over contract booking and competitive advantage, and between
the physiological pricing and revenue management in airline industry in Thailand. Nair [15]
revealed the dimensions of pricing and non-pricing strategies adopted in business on the
approach and indicated that hotels should closely monitor demand based pricing, optional
product pricing, promotional pricing, and psychological pricing among pricing strategies.
In addition, many researches have been made by the scholars to evaluate the revenue
generated strategies on airlines. Research outcomes concluded that there are many variables
influence airline revenues increase strategies such as space control, dynamic pricing,
customer expectation meet, service quality and variety of service, which airlines need to
adopt those strategy to gain competitive advantage [30-36].
Conclusion, many studies have identified important drivers of pricing and non-pricing
strategies in cargo operations of air cargo airlines, but few have analysed the performance
in passenger airlines, in maximizing revenue through the cargo operations. This study
showed important relationship between the pricing, non-pricing strategy and the gaining of
competitive advantage. A significant test statistic in this research provides evident that, the
impact of pricing based strategy on airlines’ revenues is a psychological pricing strategy
and the impact of non-pricing based strategy is the over contracting booking strategy.
Certainly the SEM analysis concluded that other variables are insignificant effect on the
airline industry revenue and the competitive advantage of airlines industry.
6 Recommendations and Future Works
Revenue maximizing strategies can be drawn from this research to benefit the strategic
managers in enhancing company performance. The research proposal can be used to create
new direction of airlines’ revenue management. As any limitation in the research, this study
leaves gap for further study in logistics and all cargo airlines.
References
1. IATA, Cargo operations (2020)
2. S. Shaw, Airline Marketing and Management Ashate (2011)
3. S. Holloway, Straight and Level Practical Airline Economics (Ashgate, 2008)
4. Statista, Total Population of ASEAN Countries from 2010 to 2020 (2021)
5. ATAG, Air Transport Action Group (2020)
6. AAPA, https://www.aapairlines.org (2020)
9E3S Web of Conferences 244, 08019 (2021) https://doi.org/10.1051/e3sconf/202124408019
EMMFT-2020
7. ASEAN Aviation, IATA: May air cargo shows slight pickup (2020)
8. Mordor Intelligence, Freight and Logistics Market – Growth (2020)
9. J.H. Choi, Y.H. Park, Journal of Sustainability 12, 20 (2020)
10. Seymour et al., J. of Tourisme Futures 3, 1 (2017)
11. P.S. Morrell, T. Klein, Moving Boxes By Air (Routledge, 2018)
12. B. Registe, The Chicago School of Professional Psycho (ProQuest Dissertations, 2016)
13. CAAT, State of Thai Aviation Industry 2019 (2020)
14. P. Mill, ProQuest Dissertations and Thèses (2017)
15. G.K. Nair, Intl. J. of Hospitality Mgnt. 82, 287-297 (2019)
16. P. Boachie, Five Strategies of Psychological Pricing (2016)
17. J.J.H. Yuen, Vanderbilt University (ProQuest Dissertations, 2018)
18. A. Popescu, Georgia Institute of Technology (ProQues Dissertations, 2006)
19. Y. Levin, M. Nediak, Operations Research (Queen’s University, 2012)
20. F. Wals, M. Schinkel, Intl. J.of Industrial Orgz. 61, 572-589 (2018)
21. K. Pak, R. Dekker, J. of Econ Literature 13 (2004)
22. E.V. Andreeva et al., Actual Problems of Economics 183(9), 220-227 (2016)
23. A. Kharitonova, University of Nevada (ProQuest Dissertations, 2019)
24. R. Kamasak, C. Cansever, Intl. J. of Bs. Tour.& Appl. Sci. 7(1), 39-43 (2019)
25. R.G. Kasilingam, Européen J. of Opérationnel Resarci 96 (1996)
26. D.S. Ushakov et al., Geojournal of Tourism and Geosites 27(4), 1429-1438 (2019)
27. M. Civelek, Essentials of structural equation modeling (2018)
28. J. Wang, X. Wang, Structural equation modeling: Applications using Mplus (John
Wiley & Son, 2019)
29. D. Napitupulu et al., J. of Phys. Con.Series (2018)
30. S. Shihab, Iowa University (ProQuest Dissertations, 2020)
31. K. Charernnit, K. Kankaew, J.of Critical Reviews 7(13), 2039-2042 (2020)
32. Yu. Shunan et al., J. of Air Transp. Mgnt. 75, 9-15 (2019)
33. N. Paethrangsi, Intl. Acad. Multiplry. R. Conf. in Malta (2020)
34. Qin Han, National University of Singapore (ProQuest Dissertations and Theses, 2015)
35. K. Kankaew, E3S web of Conferences 175, 13033 (2020)
36. R. Waramontri, Actual Econ. local solutions for globl. Challges, 418-425 (2019)
10You can also read