Teleperformance Group Overview - Including Q1 2020 Quarterly Information May 2020 - Teleperformance Investor ...

Page created by Harry Warren
 
CONTINUE READING
Teleperformance Group Overview - Including Q1 2020 Quarterly Information May 2020 - Teleperformance Investor ...
Teleperformance
Group Overview
Including Q1 2020 Quarterly
Information

May 2020
Teleperformance Group Overview - Including Q1 2020 Quarterly Information May 2020 - Teleperformance Investor ...
Disclaimer

             All forward-looking statements reflect Teleperformance management’s present
             expectations of future events and are subject to a number of factors and uncertainties
             that could cause actual results to differ materially from those described in the
             forward-looking statements. For a detailed description of these factors and
             uncertainties, please refer to the “Risk Factors” section of our Registration Document,
             available at www.teleperformance.com. Teleperformance undertakes no obligation to
             publicly update or revise any of these forward-looking statements

                                                                                                       2
Teleperformance Group Overview - Including Q1 2020 Quarterly Information May 2020 - Teleperformance Investor ...
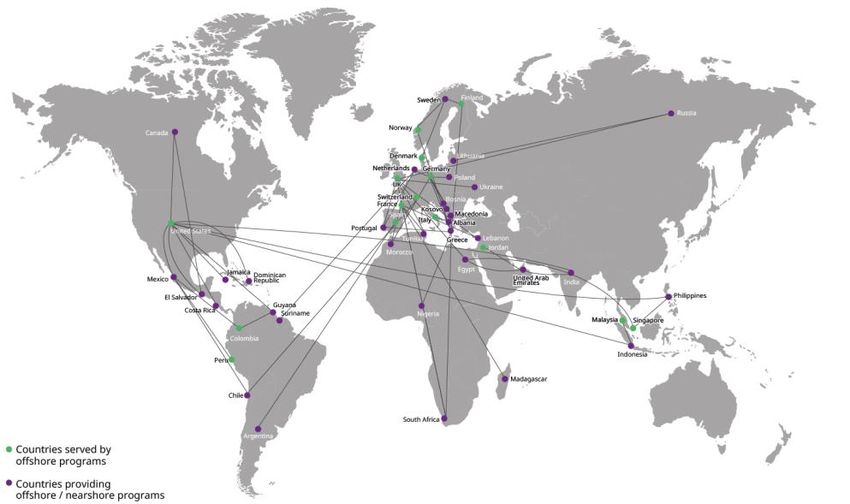
Alternative Performance Measures
Change in like-for-like revenue:
Change in revenue at constant exchange rates and scope of consolidation = (current-year revenue - last-year revenue at
current-year rates - revenue from acquisitions at current-year rates) / last-year revenue at current-year rates.
EBITDA before non-recurring items (Earnings before Interest, Taxes, Depreciation and Amortization):
Operating profit before depreciation and amortization, amortization of intangible assets acquired as part of a business
combination, goodwill impairment charges and non-recurring items.
EBITA before non-recurring items (Earnings before Interest, Taxes and Amortization):
Operating profit before amortization of intangible assets acquired as part of a business combination, goodwill impairment
charges and non-recurring items.
Non-recurring items:
Principally comprises restructuring costs, incentive share award plan expense, costs of closure of subsidiary companies,
transaction costs for the acquisition of companies, and all other expenses that are unusual by reason of their nature or
amount.
Net free cash flow:
Cash flow generated by the business - acquisitions of intangible assets and property, plant and equipment net of disposals -
financial income/expenses.
Net debt:
Current and non-current financial liabilities - cash and cash equivalents.
Diluted earnings per share (net profit attributable to shareholders divided by the number of diluted shares and adjusted):
Diluted earnings per share is determined by adjusting the net profit attributable to ordinary shareholders and the weighted
average number of ordinary shares outstanding by the effects of all potentially diluting ordinary shares. These include
convertible bonds, stock options and incentive share awards granted to employees when the required performance
conditions have been met at the end of the financial year.
                                                                                                                               3
Teleperformance Group Overview - Including Q1 2020 Quarterly Information May 2020 - Teleperformance Investor ...
Detailed contents

 Teleperformance at a glance                                                                                              p. 5-12
 Teleperformance at a glance                              p. 6-9      Strategy & high-tech, high-touch approach           p. 10-11

 Q1 2020 revenue and actions taken in response to Covid-19                                                                p. 13-22
 Revenue analysis                                          p. 14-16   Details by activity                                 p. 18-22

 FY 2020 outlook                                                                                                          p. 23-24
 FY 2020 outlook                                          p. 24

 Appendices                                                                                                               p. 25-48
                                                                      Digital Integrated Business Services (D.I.B.S.) –
 Group overview – Additional information                  p. 28-34                                                        p. 40-43
                                                                      Additional information
                                                                      Corporate social responsibility, governance &
 Market & competitive environment                         p. 35-39                                                        p. 44-48
                                                                      shareholding

                                                                                                                                     4
Teleperformance Group Overview - Including Q1 2020 Quarterly Information May 2020 - Teleperformance Investor ...
Contents

    1. Teleperformance at a glance

    2. Q1 2020 revenue and actions taken in response to Covid-19

    3. FY 2020 outlook

    4. Appendices

                                                                   5
Teleperformance Group Overview - Including Q1 2020 Quarterly Information May 2020 - Teleperformance Investor ...
Teleperformance at a glance
A leading global group in digitally integrated business services

    • #1 global leader in                                                     • 330k+ employees                           • 460 facilities
      outsourced CX*
      management

    • Present in 80 countries

    • Serving 1,000+** clients in
      170+ markets

    • Providing services in
      265+ languages and dialects                                                                    Countries where TP
                                                                                                     operates

 * Customer Experience ** 31,000 including LanguageLine Solutions (businesses, government agencies and individuals)                          6
Teleperformance at a glance
  Becoming a leading global group in the digitally integrated business services market

                                                                                           Customer experience
                                                                                           ▪ Customer care &

                                                            Three-dimensionnal expertise
                                                                                             technical support
CX business              Core Services & D.I.B.S                                           ▪ Sales
services to              ▪ Customer care &
                                                                                           ▪ Accounts receivable

                                                                One-Office solution
                           technical support
corporates and                                                                             ▪ Interpretation and Translation   High value-added
                         ▪ Sales
government               ▪ Back-office services                                                                               Digitally Integrated
agencies                                                                                   Middle/back-office
                                                                                           optimization services              Business Services
▪ Customer care &                                                                          ▪ Content moderation               to “the Disrupted
  technical support      Specialized Services                                              ▪ Industry specific business
▪ Sales                                                                                      process services
                                                                                                                              and the Disruptors”
                         ▪ Interpretation and translation
▪ Back-office services                                                                     ▪ Visa & consular services
                         ▪ Visa & consular services
▪ Accounts receivable
                         ▪ Accounts receivable                                             Knowledge services
                                                                                           ▪ Consulting services
                                                                                           ▪ Advanced analytics
                                                                                           ▪ Intelligent automation

                                                                                                                                                     7
Teleperformance at a glance
Geographic diversification
       Group revenue breakdown                                                                                                 Core Services & D.I.B.S.*
       (FY 2019)                                                                                                               revenue breakdown (FY 2019)
                                                                                                                                 India &
                                                                                                                                Middle East
        o.w D.I.B.S.
                                                                                                                                   11%
        19%

                                                       Core                                                                                                   EWAP
                                                    Services &                                                                                                 37%
                                                     D.I.B.S.*
                                                       87%
                                                                                                           CEMEA
                                                                                                            23%
     Specialized
      Services
        13%
                                                                                                                                                    Ibero-LATAM
                                                                                                                                                        29%
         * Core Services & D.I.B.S. split by linguistic region:
         - EWAP                                   English-speaking market and Asia-Pacific (the US, Canada, the UK, the Philippines, China, etc.)
         - Ibero-LATAM                            Latin American countries (Brazil, Mexico, Colombia, etc.), Portugal and Spain
         - CEMEA                                  Continental Europe, Middle East & Africa
         - India & Middle East                    India and ex-Intelenet activities in the Middle East
                                                                                                                                                                     8
Teleperformance at a glance
Ongoing diversification
Expertise in many industries
% Revenue by vertical – details 2019 vs. 2013
47%
                                                                                        • Increasingly diverse client base, now 1,000 clients+*
                                                           First entry in
                                                           the Top 9
                                                           sectors in 2019              • Average tenure of client relationship is 13 years
 17%       16%    14% 14%                                                        14%      (Top 50)
                 9%       11%        7%        6%     6%        5%             10%
          5%                                                              4%
                                4%        4%        3%     2%        2%                 • Increased contribution of business with e-player clients

                                                                                        • Global accounts** represent nearly 50% of total
                                                                                          Group revenue
                                                                                        • Lower concentration caused notably by diversification
                                2013                2019                                  in new verticals, with recent large accounts won,
                                                                                          particularly in the e-Economy
Multi-year trend of lower client concentration*
% Revenue – details 2019 vs. 2013
 Top 50                                                      56%
                                                                           68%

 Top 10                          26%
                                          34%

  Top 1          6%                                                                    * Excluding LanguageLine Solutions (30,000 clients including individuals); Top 100 in 2019: 68%
                  7%                                                                   ** Accounts served in more than 2 markets                                                       9
                                       2019                2013
Teleperformance at a glance
Strategy: succeeding in transformation

                  ▪ Becoming a leading global group in digitally integrated business services
                  ▪ A unique selling proposition to clients: Simpler, Faster, Safer, Better and More
     Vision         cost effective
                  ▪ High-tech, high-touch position and strategy
                  ▪ Sustainable business model creating value for all stakeholders

                  ▪ Ongoing booming digitized disruption: disruptors and disrupted companies
 Challenges and   ▪ End-to-end and more complex demand from global clients
  opportunities   ▪ Enlarged addressable market: the worldwide business process management
                    market

                  ▪ Strengthening the business model
     M&A          ▪ Specialized services
                  ▪ US markets

                                                                                                       10
Teleperformance at a glance
Succeeding in transformation: a unique high-tech, high-touch strategy

 •   Robust and                                                     •   Hire the right people:
     reliable IT                                                        psychographic assessments,
     architecture       HIGH-TECH                 HIGH-TOUCH            predictive recruitment
 •   Omnichannel                                                        models

 •   Automation                                                     •   Coaching lab
     and A.I                                                        •   Managing with a purpose
 •   Data security                                                  •   Global ecosystem:
                                                                        GPTW, multicultural,
 •   “Solution                                                          local
     Architects team”                  Lean Six
                                       Sigma
                                                       •   Excellence, discipline and
                                       Discipline          culture of continuous
                                                           improvement and innovation
                                                                                                  11
Teleperformance at a glance
Succeeding in transformation: an agile and international organization
                                                      Daniel Julien
                                                    Chairman and CEO
                      Olivier Rigaudy                                                                •   TAPs
                    Deputy CEO and CFO                                          Bhupender Singh      •   R&D
                                                                                                     •   Marketing
                        Leigh Ryan                                               President of        •   Lean Six Sigma
                     Global Chief Legal                                        Transformation        •   IT & CISO
                          Officer

                     Eric Dupuy                    Jeff Balagna                                      Scott Klein
                                                         Agustin Grisanti
                      President of
                                                                                                     President of
             Global Business Development       Global co-COO’s - Operations
                                                                                                  Specialized Services
         •    EWAP (EW/APAC)               Miranda Collard,
         •    CEMEA                                                                      •   LanguageLine Solutions
                                           Stéphanie Wilson,
         •    IBERO-LATAM                  Gustavo Mir González                          •   TLScontact
         •    D.I.B.S                      Chief Client Officers                         •   ARM

                                                    Chief Administration
                                              Officer/HR/Compliance/Training
                                                       Alan Winters
8 executive committee members
21 global management committee members
A Crisis Transformation Committee (CTC) bringing together the top 100 key Group managers < 45                             12
Contents

    1. Teleperformance at a glance

    2. Q1 2020 revenue and actions taken in response to Covid-19

    3. FY 2020 outlook

    4. Appendices

                                                                   13
Q1 2020 revenue
Key facts and figures
▪   Measures taken to overcome the global health crisis with three priorities
    • Protecting employees: 100% compliance with all hygiene standards in the
      Group‘s 80 countries and +155,000 employees working from home, i.e. 66% of
      the operational workforce, vs c.5,000 at end-2019
    • Protecting jobs by supporting brands and governments in ensuring business
      continuity: 90% of clients served by home-working employees
    • Protecting the Group and strengthening liquidity: launch of a cost reduction
      annual program of around €250 million, over €1.5 billion in liquidity, including
      additional lines of credit secured for €655 million, and BBB- rating with a stable
      outlook confirmed by S&P in April

▪   Sustained growth in Q1 2020: +6.2% LFL growth in revenue, despite the effect of
    Covid-19 on operations
    • Rapid growth in January and February
    • Flat performance in March due to first Covid-19 impact
                                                                                           14
Q1 2020 revenue
Sustained growth in revenue despite Covid-19
▪ Revenue growth in the first quarter remained strong: up +6.2% LFL
     • Sustained growth above +7% like-for-like in January & February
     • Stable performance in March due to the impact of the health crisis on the second half of the month

         € millions                                                                        Change
                                                 Q1 2020        Q1 2019
                                                                               Like-for-like     Reported
         €/$ exchange rate (12-months average)   €1 = US$1.10   €1 = US$1.14

         Revenue                                   1,352          1,271          +6.2%           +6.4%

                                                                                                            15
Q1 2020 revenue
Revenue growth analysis

                                     +6.2% lfl
                                                 +79          1,352
                                                                        • Revenue growth: +6.4% as reported
 1,271           +2             1,273                                     and +6.2% like-for-like

                                                                        • Slightly favorable currency effect:
                                                                          gains in the US dollar mainly offset by
                                                                          declines in the Brazilian real, the
                                                                          Colombian peso and the Argentine
                                                                          peso against the euro

 Q1 2019   Currency effect     Q1 2019 at     Like-for-like   Q1 2020
                                constant         growth
                             exchange rates

                                                                                                                    16
Q1 2020 revenue
Revenue by activity

Revenue (€ m)                        Q1 2020          Q1 2019
                                                                          Change (%)        Core Services & D.I.B.S. LFL growth: +6.8%:
                                                                  Like-for-like* Reported
                                                                                               • Sustained improvement in business in
Core Services & D.I.B.S.               1,179              1,105     +6.8%        +6.6%           January & February
 - EWAP                                 431               400       +4.8%        +7.8%         • Revenue growth remained positive in
 - Ibero-LATAM                          356               316       +18.1%       +12.5%          March, although limited and uneven across
                                                                                                 regions
 - CEMEA                                274               263       +3.9%        +4.2%
 - India & Middle East                  118               126        -7.0%        -6.6%     Specialized Services lfl growth: +2.2%:
Specialized Services                    173               166       +2.2%        +4.9%         • Significant decline in March due mainly to
                                                                                                 the impact on TLScontact of travel bans and
Total                                  1,352              1,271     +6.2%        +6.4%           border shutdowns

* At constant exchange rates and scope of consolidation

                                                                                                                                             17
Q1 2020 revenue
Core Services & D.I.B.S. – English-speaking market & Asia-Pacific (EWAP)

                                                  • Satisfactory revenue growth in the first two
         Q1 2020 vs. Q1 2019 (€m)                   months of the year

                                                  • Very slight growth in March, despite the initial
                               431                  impacts of Covid-19 in North America, where
                                                    most segments were impacted, except for
         400      +4.8% lfl
                                                    healthcare, the Internet services and automotive
                                                    industries. In the US, 90% of employees
                                                    currently work at home

                                                  • Operations in APAC progressed at a good pace:
                                                    very strong growth in Malaysia along Q1 and
                                                    return to solid revenue growth in March in China
        Q1 2019               Q1 2020
                                                  • Revenue still down in the UK, despite good
                                                    growth in March due to the implementation of
                                                    Covid-19 hotline services for the government

                                                                                                       18
Q1 2020 revenue
Core Services & D.I.B.S. – Ibero-LATAM

                                         • Double-digit lfl growth in March, despite a
                                           Covid-19 related slowdown compared with the
         Q1 2020 vs. Q1 2019 (€m)
                                           first two months
                                356      • Colombia, Brazil, and nearshore business in
         316
                                           Mexico and Spain were the main growth
                  +18.1% lfl               drivers

                                         • Financial services, e-tailing and the Internet
                                           services industry expanded at a good pace

                                         • Quick implementation of work-at-home
                                           solutions: the best penetration rate (nearly
                                           80%), compared with other Group regions and
        Q1 2019                Q1 2020
                                           close to 100% in Portugal

                                                                                            19
Q1 2020 revenue
Core Services & D.I.B.S. – Continental Europe & MEA (CEMEA)

                                                • Sluggish growth in March: less harsh impact of
        Q1 2020 vs. Q1 2019 (€m)                  Covid-19 than in other regions, though highly
                                                  contrasted situations from one country, or one
                                                  industry, to another
                              274
         263                                    • Business contracted sharply in March in the
                 +3.9% lfl                        countries with the strictest lockdown policies,
                                                  such as Italy and Tunisia

                                                • Steady increases in revenue in others
                                                  countries:    multilingual hubs in Greece,
                                                  Scandinavia as well as Turkey, Egypt and Russia,
                                                  where the Group recently opened new sites
       Q1 2019               Q1 2020

                                                                                                     20
Q1 2020 revenue
Core Services & D.I.B.S. – India & Middle East

                                                 • Activities in March contracted sharply, due
         Q1 2020 vs. Q1 2019 (€m)                  to the drastic lockdown measures in India,
                                                   with a number of site closures during the
                                                   month

                                                 • Rapid expansion of work-at-home solutions
         126
                                118                to meet client demand has helped minimize
                  -7.0% lfl
                                                   this impact. To date, nearly 60% of the agents
                                                   in India work at home.

                                                 • International offshore contracts have been
                                                   prioritized

        Q1 2019               Q1 2020            • Terminations of the less profitable domestic
                                                   contracts have accelerated in March

                                                                                                    21
Q1 2020 revenue
Specialized Services

                                        • LanguageLine Solutions business was the
         Q1 2020 vs. Q1 2019 (€m)         main growth driver: a double digit growth in
                                          Q1 supported by its solid interpreters
                                          working from home delivery model
                               173
                                        • Sharp decline in revenue of TLScontact,
         166
                  +2.2% lfl               notably in March, when operations were
                                          reduced by half

        Q1 2019               Q1 2020

                                                                                         22
Contents

    1. Teleperformance at a glance

    2. Q1 2020 revenue and actions taken in response to Covid-19

    3. FY 2020 outlook

    4. Appendices

                                                                   23
FY 2020 outlook

▪ Margin will be negatively impacted in H1, especially in Q2

▪ Ongoing positive commercial momentum

▪ No annual financial guidance provided at this stage

▪ Tackling H2 2020 with confidence based on:
    • measures taken to weather the storm and prepare the after crisis period
    • resumption of existing client and supporting new clients acquired during the crisis

                                                                                            24
Contents

    1. Teleperformance at a glance

    2. Q1 2020 revenue

    3. FY 2020 outlook

    4. Appendices

                                     25
Appendices
Agenda

     • Group overview – Additional information

     • Market and competitive environment

     • Digital Integrated Business Services (D.I.B.S.) – Additional information

     • Corporate social responsibility, governance & shareholding

                                                                                  26
APPENDICES

     Group overview –
     Additional information

                              27
Group overview – Additional information
A proven financial track record – 2012-2019
                                                                                                                                                                               14.3%
                                                                                                                   700
    8 000                     +9.9%                                 +10.6%
                                                                                                                   600                                         13.3% 13.6%             15%
                      +7.9%           +7.5%           +9.0% +9.0%             10%                                  500                                 11.2%
              +6.9%                           +7.4%                  5,355                                                                     10.3%
    6 000                                                                     8%                                   400    9.1% 9.3% 9.7%
                                                      4,180 4,441                                                  300                                                                 10%
    4 000                             3,398 3,649                             6%                                   200
                              2,758
               2,347 2,433                                                    4%                                   100
    2 000                                                                                                            0                                                                 5%
                                                                              2%                                          2012 2013 2014 2015 2016 2017 2018 2019
          0                                                                   0%
               2012 2013 2014 2015 2016 2017 2018 2019
                                                                                                                           Current EBITA                          Net profit – gr. share
                          Revenue               Group LfL growth                                                           Current EBITA margin

    400                                                                                                            3800                                2.6x             2.6x           3,0x
                                                                              9%                                                                                1.9x           2.1x
    300                                                                                                            2800                                                                2,0x
                        5.7% 5.0%                                  4.7%                                                                 1.1x
              4.6% 5.2%                       5.2%          4.4%              6%                                                               0.8x
    200                                              3.5%                                                          1800                                                                1,0x

    100                                                                       3%
                                                                                                                   800    -0.4x -0.3x                                                  0,0x

      0                                                                       0%                                   -200                                                                -1,0x
              2012 2013 2014 2015 2016 2017 2018 2019                                                                     2012 2013 2014 2015 2016 2017 2018 2019
                                                                                                                                               PF*         PF**
              Net capex         Net Free cash flow            Net capex/revenue                                                     Net debt     Net debt/EBITDA

 * LanguageLineSolutions consolidated on a 12-month basis          ** Intelenet consolidated on a 12-month basis                                                                               28
Group overview – Additional information
Over 40 years at the forefront of customer experience and business services outsourcing
                                                                                                                                 Digitally Integrated Business Services

                                                                                                              Digital Customer Experience
                   Customer Experience

                                                                                                                                                                     330k+
                                                                                                                                                                         employees
                                                                                                                         2012
                                                                                                                  Full control                               2018
                                                                                                                            of                               Acquisition of
                                                                                                          2008    TLSContact                                 Intelenet and launch
                                                                               1998-2002         Acquisition of           (UK)                               of Digital Integrated
                                                                      Started operations           The Answer
                                                                        in Latin America:                                                                    Business Services
                                                                                                    Group (US)                             2014
                                                                           acquisitions in                                                 Acquisition of
                                                                           Argentina and                                                   Aegis USA
                                                              1996                  Brazil
                                                            Started   (1998) and Mexico
                                               1993     operations,                (2002)
                                            Started   including the                                                           2010
                                  1986   operations     Philippines                                                           Acquisition of     2016
          1978         First listed on                                                                                        BeCogent (UK)
                                          in the US                                                                                              Acquisition of
    Founded in        the Paris stock                                                        2007                             and Teledatos
France, with 12                                                                                                                                  LanguageLine
                               market                                                        Acquisition of                   (Colombia)         Solutions
  employees in                                                                               Alliance One
 telemarketing

            1978                           1990                                 2000                                   2010                                       2020               29
Group overview – Additional information
   Go-to-Market strategy with three-dimensional expertise

                                                             Digital platforms
                                                               •       Omnichannel contact center
                                                               •       Automation
                                                               •       Analytics

             Lines of Business
             Subject matter experts                                Specific client activity
                                                                   •     Banking
             •     Customer Experience                             •     Travel Hospitality
             •     Back-office Services                            •     Retail
             •     Knowledge Services                              •     Healthcare
                                                                   •     Public sector
                                                                   •     E-services
Line of Business
     Based on Delivery Models: Omnichannel | Smart shoring | Work-at-home | Multilingual hubs

                                                                                                    30
Group overview – Additional information
Smart shoring: a unique offering of worldwide broad sourcing mix

• Network of 33 offshore/nearshore locations around the world      Increasing share of
• The only industry player able to offer worldwide integrated      nearshore & offshore*
  domestic, nearshore & offshore solutions

                                                                                                  54%
                                                                      65%

                                                                                 + 11 ppt
                                                                                                  46%
                                                                      35%

                                                                     2010                         2019
                                                                       % of nearshore & offshore revenue
                                                                       % of domestic revenue

                                                                   * in Core Services & D.I.B.S. activities   31
Group overview – Additional information
Smart shoring: rapid deployment of work-at-home agents in 6 weeks in response to Covid-19

  180000
                                                                                                                 155,000+
                                                                                                                 WAHA* on April 27th
  160000

  140000

  120000

  100000

   80000

   60000

   40000
                c.5,000
                WAHA* at YE19
   20000

       0
           31/12/2019     …     18/03/2020   22/03/2020   24/03/2020   01/04/2020   06/04/2020   12/04/2020   19/04/2020   27/04/2020
* Work-at-Home Agent                                                                                                                    32
Group overview – Additional information
Smart shoring: multilingual hubs in Europe and Asia

• Solutions adapted to each market’s needs
• Strong support to gain market share in
  CEMEA, with promising development in Asia
• Gathering native speakers from different
                                                                 Spain           Greece
  locations in one hub to deliver the best
  service for Pan-European and Asian mid-size
  programs                                            Portugal

• Serving 140 countries from main 5
  centralized locations in more than 40                                                   Malaysia
  languages
• Latest premium multilingual hub opened in
  Malaysia in May 2017, offering services in
  25 languages
                                                                         Egypt
                                                                                                     33
Group overview – Additional information
Security: a reference in the industry
                                                                           Examples of key certifications
  • The BCR (Binding Corporate Rules) is a legal
                                                                           received by Teleperformance
    document outlining the Group’s compliance,
    privacy and security program
  • Teleperformance received notification from the
    CNIL* that its BCRs were approved in February
    2018
  • Teleperformance is the only BPO** company
    that has gained approval for BCRs
  • The BCR approval was a factor in
    Teleperformance becoming GDPR (General Data
    Protection Regulation) compliant in May 2018
  • Launch of the Eagle Project in 2019, a new
    program of investments in cybersecurity

 * French data protection authority ** BPO: Business Process Outsourcing                                    34
APPENDICES

     Market and competitive environment

                                          35
Market and competitive environment
#1 WW in a changing CX core market still poorly outsourced but highly disrupted

     CX Outsourcing rate in 2018 (%)
                                                          VERTICAL              DISRUPTED              DISRUPTORS

                  25%                                       Retail             Bricks & Mortar           E-commerce

                                                    Entertainment & Pay TV    Cable & Satellite           Streaming
                            75%                 Banking, financial services
                                                      and insurance                Banks                  Fintechs

                                                        Transportation              Taxi          Sharing economy platforms
             In-house        Outsourced
      Source: Everest (2019)
                                                       Accommodation               Hotels         Sharing economy platforms
    Teleperformance revenue generation
    with e-clients (%)
            95%
                                          79%   •      Helping disrupted companies to navigate the digital
                                                       transformation
                                  21%           •      Being the natural partner of the disruptors to help them
       5%
                                                       deal with the “frictions” of the real world
        2013                         2019
                E-clients    Other                                                                                            36
Market and competitive environment
Teleperformance’s transformation is leading to a broader competitive environment (1/2)
• Worldwide leader in the outsourced CX market ($60-86B in 2018*) with a unique global diversified positioning
• Group’s transformation leads to:
     • Significant outperformance vs. CX peers
     • Enlarged addressable market: the worldwide business process management market

Main competitors in the customer                                         Average growth in revenue p.a.                                   EBIT margin evolution over
experience management market                                             over the 2011-2018 period***                                     the 2011-2018 period***
  (Revenue in US$m – FY 2018)
                                                                                                        +11%                                                        +510 bps
 6000
 5000
 4000
 3000
 2000                                                                              +2%
 1000
                                                                                                                                               -110 bps
    0
                   *                                                         Main 4 competitors     Teleperformance                        Main 4 competitors     Teleperformance
                                                                                  average                                                       average

 Source: HSF (2019)                                                Source: Companies annual reports                                Source: Companies annual reports
* Source: Everest, HFS (2019)   ** Merged with Convergys within the Synnex Group; 2018 revenue of          *** Sample includes: Atento, Convergys, Sykes and Teletech; data covers the 2011-2017
                                Concentrix includes the contribution from Convergys as of Q4 2018          period for Convergys, before it was merged with Concentrix into the Synnex Group        37
Market and competitive environment
Teleperformance’s transformation is leading to a broader competitive environment (2/2)
• Enlarged competitive environment reflects growing complexity and increasingly integrated demand from the
  clients

 Direct competitors (CCO)*                                                       ITO/BPO companies**                            Consulting Firms

Atento                                                                          Cognizant                               Accenture
Concentrix/Convergys**
                                                      Enlarged and growing      EXL                                     Cap Gemini
                                                      business process
Sykes                                                                           Genpact
                                                      management market: 4 to
Teletech                                              6 times larger than the   Infosys
Webhelp                                               customer experience       Tata Consulting Services
                                                      market                    Wipro
                                                                                WNS
* Contact Center Outsourcing                                                    * IT Outsourcing/Business Process Outsourcing

* *Merged with Convergys within the Synnex Group; 2018 revenue of
Concentrix includes the contribution from Convergys as of Q4 2018
                                                                                                                                                   38
Market and competitive environment
Leveraging an ecosystem of technology players and partners

Not exhaustive

                                                                        Automation

             Omnichannel
               Contact
               Center

                                                             Analytics and
                                                                  AI

                                                                                     39
APPENDICES

     Digital Integrated Business Services
     (D.I.B.S.) – Additional information

                                            40
Digital Integrated Business Services
Leveraging technical, process and industry know-how and expertise

                                       Technology, Analytics and Process (T.A.P.) – Knowledge Services team1
                     Knowledge         Consulting experience in digital transformation, analytics and automation engagements
                    Services Team      400+ digital transformation experts

                   Digital Center of
                      Excellence                                 Technology, Analytics and Process (T.A.P.)
                                            Digital
      Digital                                                    regional teams1
                                        Transformation
  Transformation
                                        Team (EW and             Regional teams with expertise in technology,
  Team (CEMEA)
                                            APAC)                automation, analytics and process optimization
                                                                 200+ digital transformation experts
                       Digital
                   Transformation
                   Team (ILATAM)         Continuous improvement: all at Teleperformance
                                         All operations and support functions are trained in the lean
                                         six sigma method, to continuously improve performance

                                                                    1 – Includes senior IT/RPA professionals, developers, data analysts,
                                                                    data scientists and process engineers                                  41
Digital Integrated Business Services
 Digital solutions available to clients

 Not exhaustive

        Omnichannel contact center tools                                                                   Analytics and AI tools                                    

                                                                                                                                                                                  Social Media
                                                                                                                                                                                   Solutions
                                                                                                      Analytics for        Interactive      Speech analytics    Recommends        Recommends
Omnichannel and     Real-time floor       Real-time         SW for quick,         Platform for
                                                                                                   unstructured data,    analytics with                           next best         next best
 workflow mgmt     management and      dashboard with     accurate, effective     reward and
                                                                                                   sentiment analysis       advanced                             alternative       alternative
      tool             security         key business         knowledge          gamification on
                                                                                                                          visualization                          products or       products or
                     monitoring            metrics             transfer         operations floor
                                                                                                                             options                               services          services
  All industries      All industries     All industries      All industries       All industries      All industries       All industries     All industries     All industries    All industries

        Automation tools                                                                                   Industry specific solutions                                

TP Automation        TP chat bot

  Optimization        Automated                                                                        Automates         Workflow for an    Automate manual     Unify several
RPA/RDA projects   conversational AI                                                                   calculating       F&A process end       process of      applications on
    with TP            projects                                                                       refunds and            to end          medical coding    one screen with
  methodology                                                                                       change charges        management            CPT/ICD              RPA

  All industries      All industries                                                                 Travel (airlines)       Financial         Healthcare          Banking

                                                                                                                                                                                                    42
Digital Integrated Business Services
Aggressively developing bots
     8 000
                                                                                                                          c. 7,000
     7 000
                                                                                                                          total bots deployed*

     6 000

     5 000

     4 000

     3 000

     2 000

     1 000
              1,450
        0
              Dec-18    Jan-19     Feb-19    Mar-19    Apr-19     May-19   Jun-19   Jul-19   Aug-19   Sep-19   Oct-19   Nov-19   Dec-19

       * Measured as 1 attended bot counts 1x; 1 unattended bot count 8x                                                                         43
APPENDICES

     Corporate Social Responsibility (CSR),
     governance & shareholding structure

                                              44
Corporate Social Responsability
  Three commitments for one objective

                                                   1

    2                                                                                                                                            Become the leading
                                                                                                                                                 global reference in the
                                                                                                                        3
                                      Preferred employer on the Group’s market                                                                   market for an effective
                                      • Employee engagement & well-being                                                                         and sustainable value
                                      • Health & Safety
                                      • Human Rights
                                                                                                                                                 creation model for all
                                                                                                                                                 stakeholders
Force of Good
• Impact on local employment
• COTW*: Sustain local communities
                                              TP DNA
• COTP**: Promote a sustainable use                                                         A trusted partner to all Group’s stakeholders
  of natural resources                       Each Interaction Matters
                                             Human Touch
                                             Diversity & Inclusion
                                                                                            Shareholders              Clients               Customers
                                                                                            • Long-term value         • Strategic partner   • Customer Experience
                                                                                            • Transparency            • Innovation          • Data security
* COTW: Citizen of the World                                                                                          • Business ethics
** COTP: Citizen of the Planet
(1) More details in the Teleperformance 2019 Integrated Report - https://www.teleperformanceinvestorrelations.com/media/5468921/teleperformance-2019-integrated-report.pdf   45
Corporate Social Responsibility
Key 2019 figures
Be a preferred employer
•   25,000 net jobs created in 2019
•   22 Best Employer certifications covering 70% of the workforce
•   99.3% of TP’s employees have a base salary higher than the living wage (excluding bonus)
•   69% of non-agent positions filled internally
Diversity & inclusion
•   50% women in the Group and 24% in the Group’s Management Committee
Be a Force of Good
•   €1.0 of direct added value generated by Teleperformance in a country => €2.4 of total added value
    for the country
•   €4.9m raised for charities and 82,000 volunteer hours
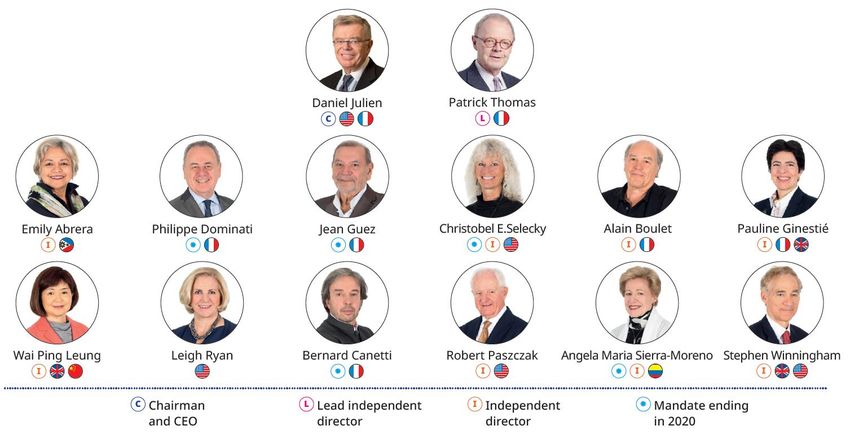
•   -4.2% decrease yoy carbon footprint per employee                                                46
Governance structure
An experienced and independent board of directors to set the strategic orientations

                                                                    •   64% independent directors
                                                                    •   43% woman
                                                                    •   6 nationalities
                                                                    • Average age of 67

                                                                                                    47
Shareholding structure
     International capital ownership*

     • Listed on the NYSE Euronext Paris market – free float ~100%
     • An international shareholding structure reflecting the Group’s global footprint

                                                               United Kingdom
                                                                          14%
                                                                                                   ** Other includes     % capital
                                                                                           North
                                                                                         America
                                                                                            34%    • Daniel Julien              2%
                                 Institutional             Continental
    Other**
       12%
                                 investors                      Europe                             • Retail investors,
                                 88%                     (excl. France)                              incl. TP’s                 8%
                                                                   23%                   Asia        employees
                                                                                          4%
                                                                                                   • Brokers                    2%
                                                                                France
                                                                                  25%

* As of March 2020                                                                                                                   48
Follow us

    /company/teleperformance

    /teleperformanceglobal

    @teleperformance

    @Teleperformance_group

    /teleperformance

    teleperformanceblog.com

teleperformance.com
You can also read