AusNet Services Half Year Results 2019 Release and Presentation
←
→
Page content transcription
If your browser does not render page correctly, please read the page content below
14 November 2018

               AusNet Services Half Year Results 2019
                     Release and Presentation
The following documents are attached:

1.   AusNet Services Half Year 2019 Results Release; and

2.   AusNet Services Half Year 2019 Investor Presentation.

Claire Hamilton
Company Secretary
14 November 2018
AusNet Services Half Year 2019 Results
AusNet Services reported its half year results for the period ending 30 September 2018. Key outcomes
include:
An interim dividend of 4.86 cps (40 per cent franked), up 5 per cent on prior corresponding period
and re-affirming dividend guidance for FY19 of 9.72 cents per share;
Lower regulated revenues (as flagged at the FY18 results release) partially offset by continued focus
on cost efficiency; and
Significant regulated and contracted asset base growth.
AusNet Services continues to generate significant operating cash flows from a growing asset base and ongoing
operating efficiencies. This, together with continued maintenance of prudent financial settings, supports capital
expenditure programs and dividends to shareholders in a sustainable manner.
Nino Ficca, Managing Director of AusNet Services said, “AusNet Services is focused on improving safety and
reliability and moving ahead with our cost efficiency program to deliver better customer outcomes. At the same
time, we are responding to demand for renewable generation connections by investing in our Electricity
Transmission and Commercial Energy Services assets”.
A$M HY 2019 HY 2018 Variance
Revenues 995.8 1,068.7 ↓6.8%
EBITDA 631.6 647.4 ↓2.4%
Earnings before interest and tax 409.0 427.1 ↓4.2%
Profit before income tax 259.6 291.5 ↓10.9%
Net profit after tax 181.5 203.7 ↓10.9%
Cash flow from operations 409.1 455.7 ↓10.2%
Dividend (cps) 4.86 4.63 ↑ 5.0%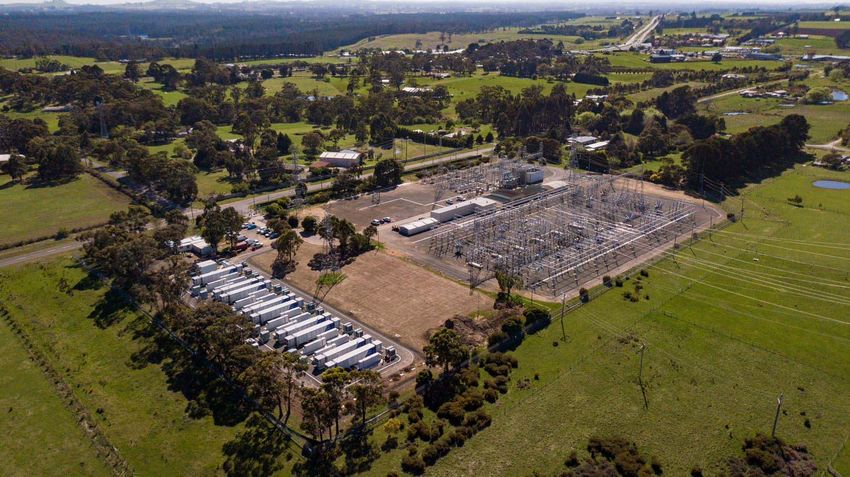
Operating and Financial Review

Electricity transmission

                                                   30 Sept 2018      30 Sept 2017     Movement                %

       Segment revenue ($M)                                 311.9            325.3          (13.4)         (4.1)
       Segment result - EBITDA ($M)                         201.5            186.4           15.1            8.1
       Capital expenditure ($M)                              98.1              69.0          29.1          42.2

Transmission revenues decreased primarily as a result of the $27.3 million reduction in easement tax (pass-
through revenue – no impact on EBITDA). While the quantum of easement tax for FY19 will be the same as
FY18, this half year impact is due to changes in revenue recognition accounting standards requiring easement
tax to have a linear profile for the financial year. Offsetting this revenue decrease are higher project revenues
associated with transmission tower relocations.

Expenses decreased $1.2 million (excluding the $27.3 million decrease in easement tax) as a result of the
continuing cost efficiency program.

Capital expenditure increased primarily as a result of $14.1 million of wind farm connection interface works (nil
in the prior comparative period) as well as an increase in excluded projects (primarily customer initiated
relocations). Major terminal station rebuilds at Richmond and West Melbourne make up $25 million of the
spend, consistent with the prior comparative period.

Electricity distribution

                                                    30 Sept 2018      30 Sept 2017     Movement                %

       Segment revenue ($M)                                 446.4             473.5          (27.1)         (5.7)
       Segment result - EBITDA ($M)                         277.2             292.4          (15.2)         (5.2)
       Volume (GWh)                                         3,937             4,021            (84)         (2.1)
       Connections                                        732,523           712,375         20,148            2.8
       Capital expenditure ($M)                             224.3             196.7            27.6         14.0

Revenues fell due to lower incentive revenues ($21.7 million in prior period, zero in the current period due to
lower reliability performance in CY2016) and a $19.5 million reduction in metering revenue, primarily due to
the hand back of previously received excess expenditures disallowed by the Australian Energy Regulator
(AER). Offsetting these is a $16.1 million increase in customer contributions, primarily new housing
developments.

Operating expenses decreased $11.9 million as a result of the cost efficiency program, with outsourcing
initiatives in vegetation management and corporate support functions, in particular, reducing costs.

                                                                                                               2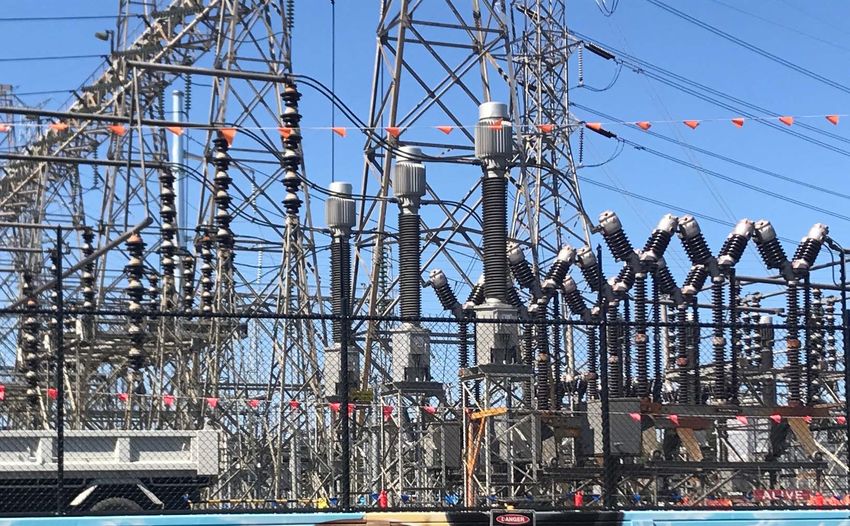
Capital expenditure increased due to the $15.2 million increase in REFCL expenditure as the program was
only in place for part of the prior comparative period as well as increases in customer connection works.

Gas distribution

                                                   30 Sept 2018     30 Sept 2017     Movement               %

       Segment revenue ($M)                                152.6            167.6         (15.0)         (8.9)
       Segment result - EBITDA ($M)                       122.1            137.6          (15.5)        (11.3)
       Volume (PJ)                                         42.8             44.2           (1.4)         (3.2)
       Connections                                      701,682          684,735         16,947            2.5
       Capital expenditure ($M)                            48.6             44.6             4.0           9.0

Regulated gas distribution revenues decreased due to the 9.4 per cent reduction in gas tariffs from 1 January
2018. Operating expenses were positively impacted by our cost efficiency program. The increase in capital
expenditure reflects higher levels of customer connections.

Commercial Energy Services

                                                30 Sept 2018       30 Sept 2017      Movement                %

       Segment revenue ($M)                               92.3             110.8          (18.5)         (16.7)
       Segment result - EBITDA ($M)                       30.8              31.0           (0.2)          (0.6)
       EBITDA Margin (%)                                  33.4              28.0             5.4          19.3
       Capital expenditure ($M)                           91.4              10.7            80.7         754.2

The Commercial Energy Services business consists of contracted infrastructure asset services and specialised
technology solutions to enable energy data and asset intelligence services. Contracted infrastructure asset
services own and operate a portfolio of assets that fall outside the regulated asset base (the largest of which
is the Wonthaggi Desalination Plant transmission connection). The investments are made through directly
negotiated agreements, pursuant to which AusNet Services typically receives revenue over the contract period
in exchange for the infrastructure and operational services provided. The customers of this business primarily
operate in the utility, renewables and essential infrastructure sectors of electricity, water, gas and rail.

Revenues decreased $18.5 million from the comparative period, which included several contracts that were
exited in the prior year as part of a strategic refocus away from providing certain maintenance services.
EBITDA margins have increased as a result of the refocus.

Capex in the current period primarily relates to four new wind farm connections that commenced construction
in the current period. The prior period included minimal capex in relation to wind farms ($3.0 million for Salt
Creek, which was energised in June 2018).

                                                                                                             3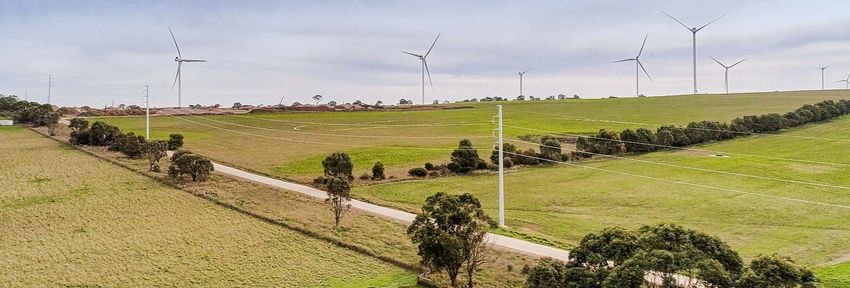
Outlook
For FY19, AusNet Services re-affirms dividend guidance and expects, subject to business conditions, to pay
a total dividend of 9.72 cps, up 5 per cent on FY18, franked around 40 to 50 per cent. AusNet Services will
continue to determine future dividends by reference to operating cash flows (using EBITDA as a proxy) after
servicing all of its maintenance capital expenditure and a portion of its growth capital expenditure.

AusNet Services expects continued growth in its regulated asset base of around 3.5 per cent per annum to
FY21. The business is also on track to achieve $1bn of contracted energy infrastructure assets by FY21.
Importantly, net debt to regulated and contracted asset base is expected to remain below 70 per cent
throughout this period.

As part of Focus 2021 strategy, AusNet Services will continue to relentlessly focus on productivity and
efficiency, targeting top quartile of efficiency benchmarks for all networks, and strengthening our culture and
capabilities required to deliver against our strategy. Our vision is to create ‘Energising Futures’ by delivering
value to our customers, communities and partners, leveraging our reputation as a trusted and respected
partner.

                                                                                                               4
Dividend key dates

The 2019 interim dividend of 4.86 Australian cps is 40 per cent franked.

The Dividend Reinvestment Plan (DRP) will be in operation for the 2019 interim dividend at a 2 per cent
discount to the average trading price. The average trading price will be the average of the volume weighted
average price of shares sold in ordinary market transactions on the ASX between 22 November 2018 and 5
December 2018 (inclusive).

For further information please refer to the DRP rules at www.ausnetservices.com.au.

Relevant dates:

19 November 2018                    Ex-date for interim dividend

20 November 2018                    Record date to identify shareholders entitled to the interim dividend

21 November 2018                    Last election date for participation in the DRP

20 December 2018                    Payment of interim dividend

About AusNet Services
AusNet Services is the largest diversified energy network business in Victoria, owning and operating $12.4
billion of assets. The company owns and operates three regulated networks - electricity distribution, gas
distribution and the state-wide electricity transmission network. The company also has a Commercial Energy
Services division, focusing on unregulated opportunities, including contracted infrastructure, asset intelligence
and energy services.

Headquartered in Melbourne, Australia, AusNet Services employs around 1,900 people to service over 1.4
million consumers. For more information visit AusNet Services’ website, www.ausnetservices.com.au.

                                                                                                               5
Supporting Australia's
   energy future

Half Year 2019 Results
For the period ended 30 September 2018
                                                                 1
                                         Brunswick Terminal Station
Disclaimer
The AusNet Services Group (AusNet Services) comprises AusNet Services Ltd and its subsidiaries.
The information in this presentation is not a prospectus, product disclosure statement or other offering document and does
not constitute an offer, invitation or recommendation to subscribe for, retain or purchase any securities in AusNet Services.
The information is an overview (in summary form) and does not purport to be complete or contain all the information
necessary to make an investment decision. This presentation is not financial product advice and does not take into
consideration the investment objectives, financial situation or particular needs of any particular person. You should consider
the appropriateness of the information having regard to your individual objectives, financial situation (including taxation
position) and needs, and seek independent professional advice. This presentation, and the information in this presentation,
will not form the basis of any contract or commitment.
This presentation has been prepared by AusNet Services on the information available. To the maximum extent permitted by
law, no representation or warranty, express or implied, is made as to the fairness, accuracy, completeness or correctness of
the information, opinions and conclusions in this presentation and AusNet Services, its directors, officers, employees, agents
and advisers disclaim all liability and responsibility (including for negligence) for any direct or indirect loss or damage which
may be suffered by any recipient through use or reliance on anything contained in or omitted from this presentation.
This presentation contains certain “forward-looking statements” and prospective financial information. These forward looking
statements and information are based on the reasonably held beliefs of AusNet Services management as well as reasonable
assumptions made by and information currently available to AusNet Services management, and are current only as of the
date of this presentation. All statements other than statements of historical facts included in this presentation, including
without limitation, statements regarding AusNet Services forecasts, business strategy, synergies, plans and objectives, are
forward-looking statements. In addition, when used in this presentation, the words “guidance”, “forecast”, “estimate”,
“expect”, “anticipated” and similar expressions are intended to identify forward looking statements. Such statements are
subject to significant assumptions, risks and uncertainties, many of which are outside the control of AusNet Services and are
not reliably predictable, which could cause actual results to differ materially, in terms of quantum and timing, from those
described in this presentation. In receiving this presentation, you agree to the above restrictions and limitations.
2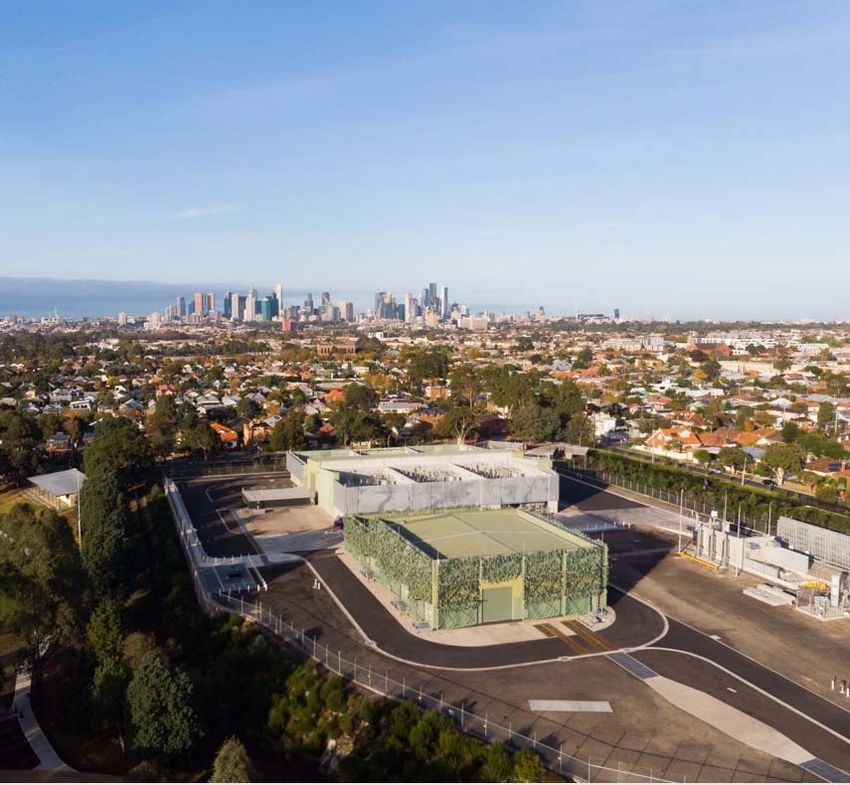
Introduction
Financial Performance
Regulated Energy Services
Commercial Energy Services
Outlook
Safety Mission & Performance

                               Embedding clear
                               leadership
                               accountabilities for all
          Reduction in
                               employees and
          Recordable Injury
  21%     Frequency Rate
                               promoting improved
                               communication and
          (HY19 RIFR 4.63)
                               recognition of safety
                               performance
                                                          4
Our vision is to create › Efficient network assets with high levels of utilisation
energising futures by › Strong track record of delivering value to customers
(45% improvement in reliability from 2007 to 2017)
delivering value to our › 14.3% reduction in electricity distribution component
of the average Victorian electricity bill (in real terms,
customers, communities ›
post 1995 privatisation to 2017)
Significant transmission growth opportunities
and partners facilitating the transition to renewables
West Melbourne Terminal Station
5Regulatory and Policy Environment
…but AST outperformance
Escalating interventions on under incentive based …with relentless focus on
price and performance…. regulation delivers value to productivity essential
customers
› Heightened uncertainty at › Privatised electricity businesses › Execute on efficiency, deliver
a time when significant deliver lower prices for for customers and facilitate
network investment is consumers, without growth in renewables
required compromising reliability or safety,
as confirmed by ACCC report
› Needs strong policymaker
focus on AEMO’s
Integrated System Plan
6Renewables connections require increased
network capacity in north west Victoria
› ~4,000MW enquiries and applications in north-west Victoria
› Growth driven by Victorian Government Renewable Energy Target (25% by 2020, 40% by 2025)
› Assisting AEMO with Regulatory Investment Tests to increase capacity
Red
Cliffs
Increase Buronga– Communications Loop Replacement,
Red Cliffs line rating Supporting generator connections,
by 190 MW by end completion by early 2020
2019
Modular Power Flow,
increase NSW import
Kerang
capacity by end 2019
Upgrade Ballarat to Horsham by
36 MW and Horsham to Red
Cliffs by 180 MW by 2019
Horsham
Ballarat 30MW battery
Ballarat
Latrobe Valley
7
Note: AusNet Services’ investment commences when contracted with counterparty or regulatory approvedInvestment Proposition and HY19
Highlights
Inflation protected revenues, next regulated revenue reset 1 Jan 2021
Stability Long-term maintenance of A-range credit rating, through prudent and
sustainable financial settings
HY19 dividend up 5% (franked 40%), in-line with FY19 guidance
Continued organisational transformation driving efficiencies and improved
Shareholder
returns
returns
Regulated and Contracted Asset base in excess of $10bn, comprising critical
energy infrastructure assets
Putting customers at the centre of what we do
Focus 2021
Over 50% increase in contracted transmission asset base*
strategy
Supporting transition to new energy future
Maintained top-quartile efficiency in Electricity Transmission and Gas
Operational Distribution
excellence Continued focus on improving Electricity Distribution benchmarking
performance
8
* Growth over last 12 months to 30 September 2018 and inclusive of contracted energy infrastructure assets under constructionFinancial Performance
Financial Performance
Lower reliability incentive scheme (↓$22m) and A$M HY 2019 HY 2018 Variance
metering revenues (↓$20m)
Statutory Result
Lower easement tax (↓$27m) revenues and costs
(pass-through, no EBITDA impact) Revenues 995.8 1,068.7 ↓6.8%
Decrease in regulated operating expenses (↓$12m), EBITDA 631.6 647.4 ↓2.4%
driven by efficiency program (net of wage and
contract price increases)
EBIT 409.0 427.1 ↓4.2%
Interim 2019 dividend up 5%, 40% franked (HY18
PBT 259.6 291.5 ↓10.9%
Franking 0%) NPAT 181.5 203.7 ↓10.9%
Cash flow from
operations
409.1 455.7 ↓10.2%
Dividend (cps) 4.86 4.63 ↑5.0%
10Cash Flow from Operations
Continued strong operating cash flows, despite lower revenues
25
21
1
409
$M
456
HY18 Cash flow EBITDA (excluding non- Income Tax Change in Working Capital HY19 Cash flow
cash items) paid
Note:
HY18 cash flow includes $10.5m net income tax received.
Immaterial movement in net finance costs paid. 11NPAT Performance
Decline in regulated revenues partially offset by efficiency program
2
46 14 10
30
$M
204
182
NPAT HY18 Operating Operating Costs Depreciation & Net Finance Income Tax NPAT HY19
Revenues Amortisation Charges Expense
Note:
Excludes impact of AASB 15 on easement tax pass-through ($27m). See slide 26 for further details. 12Capital Investment
Increase in CES growth capex due to construction Total capex $462m
of five wind farm connections and Ballarat battery
facility
49
Transmission customer connections $32m,
(HY18: $12m) mainly due to an increase in new 98
Total capex $321m
renewable projects
44
Growth / maintenance capex split approximately
65/35 $M 91
69
Continued significant investment in bushfire 11
mitigation $59m, (HY18:$46m) and other safety
measures
HY19 capital investment includes customer 197
224
contributions of $42m (HY18:$30m)
HY2018 HY2019
Electricity Distribution Commercial Energy Services
Electricity Transmission Gas Distribution
13Dividend and Capital Investment Funding
Dividends remain fully covered by strong operating cash flows (EBITDA is used as a proxy when considering
dividends)
141
11
148
$M Growth capex
$274m
623
167 Debt
118
Cash
156
EBITDA (excluding Net Finance Income Tax Maintenance Capex Gross Dividend Growth Capex
non-cash items) Costs Paid Paid Funding
Note:
Capital investment as per cash flow statement $422m.
Estimated net regulatory depreciation $171m (Indexation $68m). 14
Dividend Reinvestment Program was not in operation for the final FY18 dividend due to the SGX delisting.Diversified Debt Portfolio
$6,700m net debt hedged against movements in interest rates (99%)
Raised $900m in funding via $200m 25-year Australian Dollar bonds and $700m of 5, 6 and 7-year revolving bank debt
facilities
Undrawn committed bank facilities as at 30 September 2018 of $770m
1000
800 160
100
600
284
A$'M 283
506
400 825
710
160
51 543 550
200 400 207 425
335 63
250 252
30 200 200
125 107 99
0
EUR A$ MTNs US$ GBP CHF HKD JPY WCF/CP NOK $SGD Hybrid* USD Hybrid*
Note:
Net debt = Debt at face value ($6,863M) less cash of $163m. Offshore debt shown at hedged rates (face value).
First call date for SGD and USD hybrid securities is September 2021.
15Regulated Energy Services
Industry Developments

 Industry                       Regulatory                      Market
 Reviews                        Reforms                         Developments

   › ACCC report confirms         › AER rate of return review     › Launch of AEMO
     privatised electricity         Final Decision due in           Integrated System
     businesses deliver lower       December 2018                   Plan, provides a
     prices for consumers,                                          roadmap for future
     without compromising         › AER tax review due in           network investment
     reliability or safety          December 2018

                                                                                         17
Operational Highlights
Electricity
Electricity Distribution Gas Distribution
Transmission
› Richmond and West Melbourne › REFCL* Tranche one (allowance of › Bannockburn connected to natural
terminal station rebuilds 92% and $97m) in progress gas in July 2018, concluding
42% complete ‘Energy for the Regions’ program
› REFCL Tranche two (allowance of
› North West Communications Loop $140m), Final Decision approved in › Significant reduction in
project 27% complete August 2018 unaccounted for gas resulting in
over $1M p.a. in savings
› Critical Loy Yang upgrade › Working with high voltage customers
progressing well (23% complete) and modifying the network to mitigate › Hydrogen building momentum in
REFCL program delays Australia with key reports from Dr.
› Supported Western Vic RIT-T and
Alan Finkel, amongst others
second Bass Strait interconnector › EDPR Customer Forum established
feasibility and negotiations commenced › AusNet Services sponsoring
Future Fuels Co-operative
› Received 455MW of new
Research Centre
connection applications
Extensive network resilience program undertaken in
advance of peak summer period
18
* Rapid Earth Fault Current LimiterCommercial Energy Services Battery Storage System at Ballarat Terminal Station 19
Portfolio Update
 Deploying core skills to develop new infrastructure and technology

         Bulgana
                                                                                                             Future Focus
           WF

                                                                                              › Executing a disciplined national growth
                                                                                                strategy, with refocused service offerings
                                                                                                delivering margin improvements
                                                                 Yackandandah
                                                                                              › Supporting Australia’s transition to a new
                                                                 Mini Gridproject
                                                                                                efficient, secure, sustainable and integrated
       Murra Warra
           WF                                                                                   energy future

                                                                                              › New transmission investment and business
                         Ballarat                                                               /community mini-grid developments to unlock
                         Battery
                                                                Euroa Mini Grid                 new revenue streams
     Crowlands
        WF                                                          project
                                                                                              › Interstate pipeline building with a significant
          Salt Creek                    Stockyard Hill                                          number of opportunities being developed
             WF                              WF
                                                                                              › Over 50% increase in contracted energy
                                                                                                infrastructure assets*
                                     Dundonnell
                                        WF
                                                                                               Currently $937m of committed
                                                                                               infrastructure either complete or
AusNet Services Transmission Lines                                                             currently under construction
   Key Wind                 Key Solar
   Zone                     Zone                                                                                                            20
                                             * Growth over last 12 months to 30 September 2018 and inclusive of assets under construction
Renewable Opportunities
Current market conditions and renewable energy targets are
driving growth
Salt Creek Wind Farm
Projects Expected Completion New Project Win: Dundonnell Wind Farm
Crowlands Completed Tilt Renewables is building the 336MW Dundonnell wind farm, located
approximately 23km north-east of Mortlake
Salt Creek Completed
AusNet Services awarded contract to connect the project, providing a unique
Ballarat Battery Nov 2018 community energy solution:
› Expected completion mid CY 2020
Bulgana 1H CY 2019
› $80m investment
Murra Warra 1H CY 2019
Ballarat Battery – Victoria’s first utility scale battery
Stockyard Hill 2H CY 2019 energy storage system
21Outlook
Outlook
FY19 dividend guidance of 9.72cps, up 5%, expected to be franked
Dividends around 40%-50% (subject to business conditions)
Regulated Asset Base growth forecast at around 3.5% p.a. to FY21
Asset Base
On track to achieve $1bn of contracted energy infrastructure assets by
and
FY21
Capital
Forecast Net Debt to Regulated and Contracted Asset Base ofAppendices
Regulatory Reset Summary
From 1 January 2018, around 85% of total revenues locked-in until 1 Jan 2021
2018 2019 2020 2021 2022 2023
Electricity Transmission
Electricity Distribution
Gas Distribution
Current regulatory period Beginning of new reset period
25Electricity Transmission Network
HY 2019 HY 2018 Variance
FY19 revenue cap $541m
Revenue 311.9 325.3 ↓4.1%
Excluded revenues $39m (HY18:$26m), increase
due to Metro Tunnel Tower relocation EBITDA 201.5 186.4 ↑8.1%
AASB 15 and impact on easement tax:
EBITDA Margin 64.6% 57.3% ↑7.3%
› The payment profile of easement tax to the State
Revenue Office is not linear. In HY19, $95m of a total
annual assessment of $136m has been paid EBIT 154.7 133.4 ↑16.0%
› Due to AASB 15, easement tax expense (and pass-
through revenue) should represent 50% of the annual EBIT Margin 49.6% 41.0% ↑8.6%
charge
› This results in the deferral of $27m of revenue and the Regulated Asset
Base
3,519 3,452 1.9%
prepayment of $27m of easement tax expense
26Electricity Distribution Network
CY18 revenue cap $697m (no STPIS based on HY 2019 HY 2018 Variance
CY16 performance and includes TUOS pass through
of around $86m) Revenue 446.4 473.5 ↓5.7%
CY19 revenue cap $728m (includes TUOS pass
EBITDA 277.2 292.4 ↓5.2%
through of around $80m) and $10m STPIS revenue
(entitled to $19.4m in CY19, deferring remainder to
CY20) EBITDA Margin 62.1% 61.8% ↑0.3%
HY19 metering revenue $26m (HY18:$45m) EBIT 136.7 157.0 ↓12.9%
Expect CY18 metering revenue $51m (inclusive of EBIT Margin 30.6% 33.2% ↓2.6%
negative revenue adjustment. CY17 metering
revenues $90m)
Volumes (GWh) 3,937 4,021 ↓2.1%
CY18-CY20 metering revenues impacted by negative
revenue adjustment arising from cost recovery Connections 732,523 712,375 ↑2.8%
process. Profile of adjustment is; CY18:$27m,
CY19: $17m, and CY20:$11m Regulated Asset
Base
4,293 4,037 6.3%
Customer contributions $33m (HY18:$16m)
Excluded revenues $13m (HY18: $14m)
27Gas Distribution Network
New prices took effect on 1 Jan 2018, average tariffs HY 2019 HY 2018 Variance
declined by 9.4%
Revenue 152.6 167.6 ↓8.9%
HY19 customer contributions $5m (HY18:$9m)
EBITDA 122.1 137.6 ↓11.3%
EBITDA Margin 80.0% 82.1% ↓2.1%
EBIT 97.3 114.9 ↓15.3%
EBIT Margin 63.8% 68.6% ↓4.8%
Volume (PJ) 42.8 44.2 ↓3.2%
Connections 701,682 684,735 ↑2.5%
Regulated Asset
Base
1,587 1,515 4.8%
28Commercial Energy Services
Revenue decrease due to exit of some maintenance HY 2019 HY 2018 Variance
services contracts
Revenue 92.3 110.8 ↓16.7%
Invested $82m in wind farm connections and battery
storage project, including $34m for Stockyard Hill EBITDA 30.8 31.0 ↓0.6%
Second half capex expected to be around $120m,
subject to individual project timing EBITDA Margin 33.4% 28.0% ↑5.4%
EBIT 20.3 21.8 ↓6.9%
EBIT Margin 22.0% 19.7% ↑2.3%
Contracted
Infrastructure 637 538 18.4%
Asset Base
29Sound Fundamentals
Financial Metrics HY2019 HY2018
Market Capitalisation $5.9bn $6.1bn
Total Assets $12.4bn $11.7bn
Regulated / Contracted Asset Base $10.0bn $9.5bn
Total Borrowings (Face Value) $6.9bn $6.6bn
Net Debt 1 $7.3bn $6.6bn
Net Gearing (Carrying Value) 2 67% 64%
Net Debt (Face Value) to Regulated / Contracted Asset Base 3 67% 67%
Interest Cover 4 3.8x 4.3x
Credit Ratings (S&P / Moody’s) A- / A3 A- / A3
Note:
1. Net debt is debt at carrying value. Includes full amount of $A706m in Hybrids, despite receiving 50% equity credit.
2. Calculated as net debt at carrying value divided by net debt at carrying value plus equity.
3. Debt at face value less cash divided by Regulated / Contracted Asset Base. Demonstrates how AusNet Services funds its capex in terms of debt vs. income generating
assets. Includes full amount of $A706m in Hybrids, despite receiving 50% equity credit.
4. Calculated as EBITDA less customer contributions and tax paid, divided by net interest expense (including return on desalination licence receivable). This is how interest
cover is measured for internal management purposes, as it provides an accurate reflection of how after-tax operating cash flows are used to meet interest payments.
Includes full amount of $A706m in Hybrids, despite receiving 50% equity credit.
30Interest Rate Hedging Profile
As at 30 September 2018, the weighted average interest
rate of the total hedge portfolio was 2.63% vs 2.61% as at
30 September 2017
AER approach assumes that every year, one-tenth (10%) of
the debt portfolio is refinanced
2,927 2,721
2,555
2,473
2,114
1,905
1,020 1,020
918 1,697
816
714
1,343
612
510
408 1,040
2,750 2,835 2,675 2,435 2,195 1,955 832
1,715 306
1,350 204 623
700 460 102 619
240
Sep-18 Mar-19 Mar-20 Mar-21 Mar-22 Mar-23 Mar-24 Mar-25 Mar-26 Mar-27 Mar-28 Mar-29
Electricity Distribution Hedges Gas Distribution Hedges Electricity Transmission Hedges
Note:
Face value of hedges outstanding as at the end of the financial year.
Electricity transmission hedges include unregulated transmission connection hedges.
31Current Regulatory Determinations
Gas distribution Electricity distribution Electricity Transmission
Regulatory period
2018-22 2016-20 2017-22
Beta 0.70 0.70 0.70
Risk Free Rate 2.73% 2.93% 2.52%
Cost of Debt 5.04% 5.52% 4.94%
Gamma 0.40 0.40 0.40
Market Risk Premium 6.50% 6.50% 6.50%
Nominal Vanilla WACC 5.94% 6.31% 5.80%
Return on Equity 7.30% 7.50% 7.10%
Net Capex (Nominal) $522m $1,788m $780m
Opex (Nominal) $293m $1,355m $1,225m
Revenue (Nominal) $1,040m $3,524m $2,742m
Note:
All data in table is based on original regulatory determinations. 32Regulated Network Statistics
Around 85% of total revenues
Transmission
Electricity
› Over 6,600km of lines
› 53 terminal stations and switchyards
› Over 13,000 towers
Distribution
› 732,000 customers
Electricity
› 60 zone substations
› Over 7,000 Gwh of throughput p.a.
› Around 383,000 power poles
Distribution
› 701,000 customers
Gas
› 11,400km of gas mains
› 66 PJ of throughout p.a.
33Further information and contacts
AusNet Services is the largest diversified energy network business in Victoria, owning and operating $12.4 billion of assets.
The company owns and operates three regulated networks - electricity distribution, gas distribution and the state-wide electricity
transmission network. The company also has a Commercial Energy Services division, focusing on unregulated opportunities, including
contracted infrastructure, asset intelligence and energy services.
Headquartered in Melbourne, Australia, AusNet Services employs 1,900 people to service over 1.4 million customers and is listed on the
Australian Securities Exchange (ASX: AST).
For more information visit www.ausnetservices.com.au
For further information contact:
AusNet Services Ltd
Investor Relations
John Nicolopoulos Level 31
2 Southbank Boulevard Southbank
Head of Investor Relations
Victoria 3006 Australia
+61 3 9695 6301 or +61 409 672 912
Locked Bag 14051
Melbourne City Mail Centre
Media Relations
Victoria 8001 Australia
Sarah Ward
Corporate Affairs
Tel: +61 3 9695 6000
+61 3 9695 6521 or +61 447 289 452 Fax: +61 3 9695 6666
34You can also read