Observations/remarks/objections on the proposal for determination of tariff for FY-20 for submission during public hearing to - BPAC
←
→
Page content transcription
If your browser does not render page correctly, please read the page content below
Observations/remarks/objections on the proposal for
       determination of tariff for FY-20 for

         submission during public hearing
                        to

                  Monday, February 4 , 2019
                         Bengaluru
www.bpac.in

Introduction
The Karnataka Electricity Regulatory Commission which was set up in the year 1999 by
Government of Karnataka under the Karnataka Electricity Reform Act (1999) has been
entrusted the Regulatory responsibilities. B.PAC would like to highlight the objectives of the
Commission –
    •   To regulate all aspects of the electricity sector in an objective, professional and
        transparent manner.
    •   To safeguard consumers' interests.
    •   To ensure reliable, least-cost power supply as a basic input for the economic and social
        development of the state.

The State Commission is also required to advise the State Government on all or any of the
following matters, namely: -
   i. promotion of competition, efficiency and economy in activities of the electricity
       industry
  ii. promotion of investment in electricity industry;
 iii. reorganization and restructuring of electricity industry in the State
 iv.   matters concerning generation, transmission, distribution and trading of electricity or
       any other matter referred to the State Commission by the State Government.

Electrification in Karnataka: Status
The population of Karnataka has grown from 5.28 crores in 2001 to 6.84 crores in 2018
(Directorate of Economics and Statistics, Karnataka, 2013) showing a of 29.5%. The energy
requirement in Karnataka as on March 2018 was 67744 MU, whereas, the energy supplied was
67575 MU, having a deficit of 168 MU (0.2%) of power (CEA report, 2018).
The total installed capacity in Karnataka as on March 2018 in 26,697 MW, inclusive of
installed capacity in state, private and CGS. The transmission loss for the state is reported at
3.66 % in FY 2017. The state has five electricity distribution companies 1 which distribute
power in specific geographical locations. A few highlights of the DISCOMS are as follows:
    •   Out of the five DISCOMs in Karnataka, BESCOM has the highest number of
        consumers at 94 lakhs out of total 209 lakh consumers in the state.
    •   Consumption per consumer per day in BESCOM is the highest among DISCOMS at
        7.09 units compared to 6.43 units for the whole state (5.43 for MESCOM, 5.25 for
        CESC, 6.17 HESCOM and 6.48 for GESCOM).
    •   Amongst the five distribution utilities in the state, HESCOM has the largest area under
        its license.
    •   Average realization for BESCOM was the highest at 5.64 Rs/ kWh while CESC had
        the lowest at 4.72 Rs /kWh in the FY 2015
    •   The AT&C losses in the state is at 18% in the FY 2015

1
 1- Bengaluru Electricity Supply Company (BESCOM); 2- Mangalore Electricity Supply Company (MESCOM); 3-
Hubli Electricity Supply Company (HESCOM); 4- Gulbarga Electricity Supply Company (GESCOM); 5-
Chamundeshwari Electricity Supply Corporation Limited (CESC)

                                                   2
www.bpac.in

Karnataka state economic position – Agricultural power consumption
Electricity in Mu        1970-71     1980-81     1990-91    2000-01    2010-11    2015-16    2016-17
Total Generation               4833        6389       12431      21985      47112      64227      69657
Total Consumption              3187        5189       12182      17860      37202      61956      67370
Industrial Consumption         2488        3864        5429       4882       8425       9720       9507
Agricultural Consumption         179         384       4486       7350      12802      18962      20987
Domestic Consumption             217         696       1803       3909       7893      11243      11922

Agriculture              1970-71    1980-81     1990-91     2000-01     2010-11     2015-16     2016-17
Net Area Sown Ha.             10228      10248         9899      10381       10410       10044       10006
Gross Cropped Area Ha         10588      10887       10660       11759       12284       12247       12008
Gross Irrigated Area -Ha         NA        1355        1676        2598        3271        4186        3742
Gross Irrigated Area to
                                 NA       12.45       15.72       22.09       26.63       34.18       31.16
Gross Cropped Area %

Unit of power (in MU)          0.02        0.04        0.45        0.71        1.23        1.89        2.10
consumption per net
area sown in Ha.
                        Source: Economic Survey of Karnataka, 2017-18
From the above table we draw the attention of the Commission to the agricultural power
consumption. It can be observed that there is a disproportionate increase in the agricultural
power consumption as compared to the gross irrigated area in hectares over the last four
decades. This seems to indicate that the agricultural power is being diverted to other sources.
In the name of farmers, the power is being robbed and the loss is having to be borne by the ex-
chequer.
We bring it to Hon’ble Commission’s notice that the unit of power consumption (in MU)
per net area sown in hectare has increased from 0.71 MU in FY 2000-01 to 2.10 MU in
FY 2016-17. While the gross cropped area in hectare has marginally increased, whereas the
agricultural power consumption per hectare has doubled from FY 2000 – 01 to FY 2016 -17.
Analysis and Observations on power sector in Karnataka
We draw Hon’ble commission’s notice to report titled - Karnataka’s Power Sector Roadmap
for 2021-22 prepared by CSTEP on behalf of the Karnataka Electricity Regulatory Commission
(KERC) during 2013. This report evaluated Karnataka’s current and future power position till
the year 2021-22. The report analysed State’s power sector and discuss options to address them.
The report highlights the following:
   •   The State’s capacity addition plans seem inadequate to meet projected demand in the
       next 5 years. If the current situation continues, the State is likely to face about 21-26%
       annual energy shortfall (12,000 – 18,000 Million units) and 15-17% peak shortfall (~
       2000 MW) in the short term (2 years) and 13-8% (~10,000 Million Units) and 16%
       (~2500 MW) in the medium term (5 years).
   •   This is after accounting for all likely capacity addition. This implies that the State will
       have to rely on widespread load shedding or rely on short-term power purchases. The
       latter is an expensive option for the ESCOMs and likely to have an adverse impact on
       the electricity tariffs in the State. It is also uncertain because of transmission corridor
       capacity constraints.
                                                  3
www.bpac.in

The following key action items were identified to improve the power sector situation in
the State:
   ➢ Contract long-term capacity from IPP and captive plants: As a short-term option,
     the State can contract capacity through the Case-1 bidding route to utilize the
     underutilized capacity already installed within the State. This can provide secure power
     at competitive rates with a view to reduce reliance on short-term purchases
   ➢ Improve operational performance of State-owned thermal plants: The thermal
     plants in the State have exhibited poor operational performance at 60-64% plant load
     factors. Several factors like coal quality and frequent forced outages have been
     identified as possible causes. KPCL needs to explore remedial measures like
     assessment of coal-supply contracts, improvement of production from captive coal
     blocks of BTPS and also assess need for refurbishment and modernization in RTPS.
     Even a reasonable improvement of operational PLFs in State-owed coal plants to 80%
     can generate an additional 7,600 MU from existing capacity
   ➢ Set progressive targets for reduction in T&D losses in the State: Currently, about
     one-fifth of the power purchased is lost as losses. Better and complete energy auditing
     practices to identify the weaker areas of the network along with institutional reforms in
     ESCOMs (detailed in Section 6.3) offer significant potential to reduce losses
   ➢ Expedite renewable capacity addition: This involves both expediting commissioning
     of projects that an already allocated and also planning for new capacity to utilize the
     high wind, biomass and cogeneration and small hydro potential in the State • Monitor
     and ensure progress of plants under construction: Thermal capacity addition plans in
     the State sector have historically witnessed severe delays due to issues with provision
     of fuel supply linkages and construction delays. It is crucial that there is strict
     monitoring of progress in major plants in the pipeline: viz. Yermarus, Edlapur,
     Godhana, Gulbarga and Bidadi
   ➢ Plan for peaking capacity: More than 90% of the future firm capacity addition plans
     are coal based. The State may leverage the already available gas-pipeline to plan for
     more gas-based peaking capacity. Plans for pumped hydro as well increasing the peak-
     rating of existing hydro projects need to be explored to serve peak power requirements

Sir, we urge you to direct BESCOM, other ESCOMs and KPTCL to take note of the above
action items from the report and set a quarterly target with a reporting format.
With this context, we, Bangalore Political Action Committee (B.PAC) would like to submit
our observations/remarks/objections on the proposal for tariff determination of BESCOM
for FY 20 as submitted to KERC. Our submissions are detailed under the following headings:
   a)   Key highlights of FY 18 submission by BESCOM
   b)   BESCOM’s track record analysis (FY 14 – FY 18)
   c)   Truing up for FY 2017-18
   d)   New Proposals
   e)   Tariff revision for FY 2019-20
   f)   BESCOM Prayer for Leave of the Commission

                                              4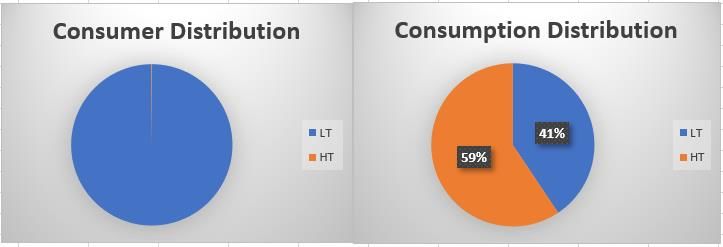
www.bpac.in

                           B.PAC’s observations/remarks/objections2
a) Key Highlights of FY 18 submission by BESCOM
        Table 1: FY 18 submissions by BESCOM versus approved rated by the Commission
                                                  Approved Actuals for
         Particulars                                                     Variation % variation
                                                   for FY 18    FY 18
         Sales in MU                                    26109      25967         -142    -0.5%
         Percentage distribution losses in %            12.5*      13.17         0.67     5.4%
         Distribution losses in MU                       3730       3940          210     5.6%
         Energy at interface point in MU                29839      29907           68     0.2%
         Percentage transmission losses in %             3.37       4.18         0.81   24.0%
         Total energy requirement in MU                 30880      31211          331     1.1%
         Revenue from Sale of Power (INR crs) 16914.19          18042.05    1127.86       6.7%
         Power Purchase Cost including cost of
         transmission (INR crs)                     13624.31    15123.21      1498.9     11.0%
         % PPC to Revenue                            80.55%      83.82%          0.03     4.1%
         Total O&M cost (INR crs)                      1486.6    1396.67      -89.93     -6.0%
         % of O & M (INR crs)                          8.79%      7.74%         -0.01  -11.9%
         Depreciation (INR crs)                        373.76     429.86         56.1    15.0%
         % Depreciation to Revenue                     2.21%      2.38%        0.002      7.8%
         * Distribution loss % considered at 12.50 % as approved by KERC
    •   Performance for the year FY 17 - 18
           o Revenue: The sales in MU is less by 0.5 % from the Commission approved
              sales of 26109 MU. However, revenue from the sale of power has increased by
              6.7 % to INR 18042.05 crs to the Commission approved revenue of INR
              16914.19 crs
           o Therefore, it is evident that to make up for the loss in sales (MU), BESCOM
              has been requesting for tariff increase YoY.
           o While revenue has increased by 6.7 %, the Power Purchase cost has increased
              by 11 % for FY 18 from the Commission approved tariff - disproportionate
              increase in PPC.
           o Power Purchase Cost: The approved percentage of PPC to revenue was 80.55
              %, while the actual percentage of PPC to revenue was 83.82 %, showing a
              variation of 4.1 %
           o T& D losses: The percentage of distribution and transmission losses have
              increased from the Commission’s approved rates by 5.4 % and 24 %
              respectively
           o The Operations and Maintenance cost has reduced by 6% from approved rates
              by the Commission
           o The depreciation cost, however, has increased by 15% from the approved rates
              of INR 373.76 crs to INR 429.86 crs

2
 All the tables, figures and charts have been created by B.PAC from the submissions made by BESCOM to KERC
for tariff determination of FY 20

                                                    5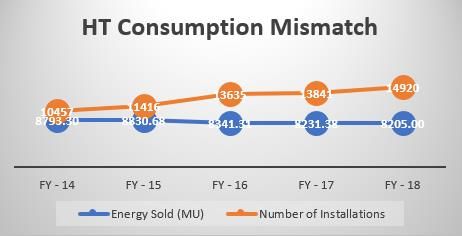
www.bpac.in
Our Prayer to the Commission
• We request the Commission to disallow the variation in distribution loss of 0.67%
(173.9 MU) amounting to an excess loss of INR 120.74 crs.
• When absolute sales for FY 18 has not increased, all aspects of cost have seen an
increase in FY 18. Therefore, we urge the Commission to request BESCOM to bring
in discipline in their power purchase arrangement at lower prices available in
open market through long term power purchase agreements (PPA).
• We request the Commission to direct BESCOM to call for open tenders while
purchasing power in order to reduce the overall cost of power purchase.
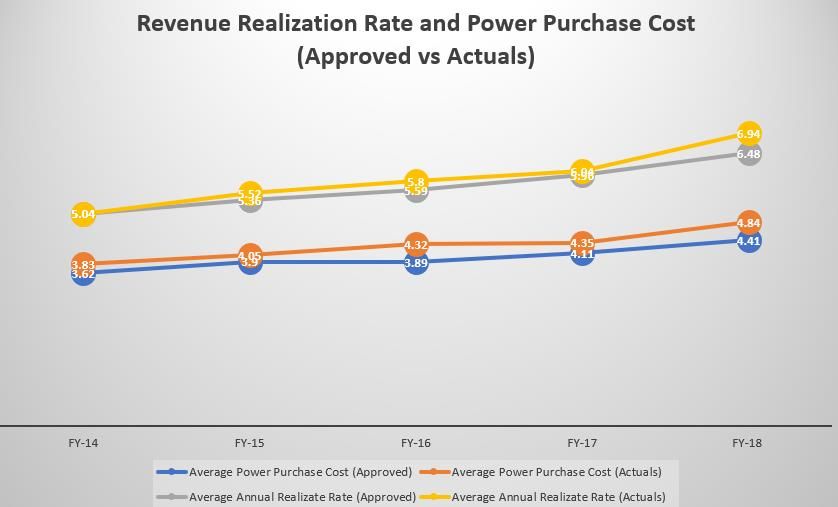
b) BESCOM’s track record analysis (FY 14 – FY 18)
The study of the past 5 years of data establishes that BESCOM has never remained within the
Commission’s approved rate with respect to Average Revenue Realization (ARR) and Average
Power Purchase Cost (APP). The chart below clearly demonstrates that BESCOM has realized
higher (INR 6.94 / unit) rates than what was approved (INR 6.48 / unit) because of change in
the mix, and, average power purchase cost has been higher (INR 4.84 / unit) than approved
rates (INR 4.41 / unit).
Table 2: ARR and APP (INR per unit)
• Following are our specific observations
o The Average Annual Realization Rate has gone up from INR 5.04 / unit (FY
2014) to INR 6.94 / unit (FY 2018), with an increase of 38%
o The Average Power Purchase Cost has gone up from INR 3.83 / unit to INR
4.84 / unit, with an increase of 26.3 %
o The Margin (difference between ARR and PPC) went up from INR 1.21 / unit
to INR 2.1 / unit, from 33 % to 43 % - a 10% significant increase in gross margin
from FY 14 – FY 18
o Despite this track record, BESCOM has once again proposed an increase in
tariff rate by INR 1.01 / unit
6
www.bpac.in

                 Figure 1: Revenue Realization Rate and Power Purchase Cost

The above chart clearly shows that both in the case of ARR and APP, the BESCOM has not
remained within the approved target This reflects insufficient efforts in bringing in discipline
in its operations.
   •   Following are our specific observations:
           o While the Commission had approved an ARR of INR 6.48 / unit for FY 18, the
              actual ARR for FY 18 is INR 6.94 / unit
           o The Commission approved Average PPC was INR 4.41 / unit for FY 18, the
              actual PPC for FY 18 is INR 4.84 / unit
                          Table 4: Revenue. PPC and Gross Margin
            Particulars               FY - 14    FY - 15   FY - 16  FY - 17           FY - 18
Revenue from Sale of Power (INR crs) 11617.35     13479.6 14226.85 15861.15           18042.05
PPC (INR crs)                         10702.76 11917.42 12600.53 13672.98             15123.21
Margin (INR crs)                         914.60   1562.18   1626.32 2188.17            2918.84
Gross Margin (%)                         7.87%    11.59%    11.43% 13.80%              16.18%
PPC to Revenue                          92.13%    88.41%    88.57% 86.20%              83.82%
O &M to Revenue                                              8.34%    7.27%             9.02%

           o The gross margin (difference between revenue from sale of power and PPC)
             has been continuously increasing from 7.87 % in FY 14 to 16.18 % in FY 18
             as highlighted in the above table.
           o As such there is no justification for considering any increase in ARR

                                               7
www.bpac.in
Table 5: Cost of power purchase for MU of power - 2018
Source: IEX, 2018
o The data collected from India Energy Exchange (IEX) shows that for FY 2018,
the power was available at an average price of INR 4.00 / unit and INR 3.63 /
unit during non-peak hours. With proper management and advanced
power purchase planning, BESCOM could have procured lower cost power
than the actual cost of INR 4.84 / unit for FY 2018.
Table 6: % PPC to Revenue
FY - 17 FY - 18 FY - 19 FY - 20 FY - 21 FY - 22
(Actuals) (Actuals) (Estimated (Projected) (Projected) (Projected)
Actuals)
Revenue 15861.15 18042.06 19802.11 20744.01 21547.92 22421.75
PPC 13672.98 15123.21 17337.93 20134.53 21859.97 23014.66
% PPC to revenue 86.20% 83.82% 87.56% 97.06% 101.45% 102.64%
o The percentage of PPC to revenue improved from 86.20 % in FY 17 to 83.82 %
in FY 18. However, the above table clearly shows that the percentage of PPC to
revenue has increased to 87. 5 % as per the estimated actuals of FY 19, and is
projected to increase to 97.06 % (FY 20) and continue to increase through the
fifth control period – 102. 64 % (FY 22)
o BESCOM has deliberately inflated the PPC for FY 18 to justify an increase in
the ARR
o Further, when the power cost has been going down in the country, the
percentage of PPC to revenue cannot increase by 10 % between FY 19 and FY
20.
Our Prayer to the Commission
• Consumer protection is one of the primary objectives of the KERC, we urge KERC to
take notice of the above data-based insights and not allow BESCOM to pass the
burden of its inefficiencies on citizens through its FY-20 tariff increase proposal.
BESOCM already has been realizing higher margins over and above the approved
limits set by the KERC.
8www.bpac.in
• We request the Commission to direct BESCOM to bring down the percentage of
PPC to revenue to 80 % or below and not allow any further increase in the ARR
for FY 19-20.
• It is observed that BESCOM is buying power at higher rates (INR 4.84/unit) than the
average market rate as per IEX (INR 4.00/ unit). The percentage of PPC to revenue has
been increasing disproportionately (from 86.20 % in FY 2017 to 97.06 % in FY 20) and
is projected at 102.64 % for FY 22. The power purchase cost higher than the revenue
shows poor planning and incapability of BESCOM to buy power at lower available
market rates. No business can be sustainable where the costs are higher than the
revenue. We request the KERC to direct BESCOM to provide revised submission on
realistic projections of power purchase cost to revenue for the current control period.
• We note that, improving the operations within the targets set by KERC, BESCOM
would be able to meet the consumers’ requirement and also set a benchmark to the
other ESCOMS’s to emulate.
c) Truing up FY 17-18
The truing up for FY 17-18 is discussed under the following headings:
I. Distribution Loss
II. Power Purchase Cost
III. Sales
IV. Collection Efficiency
I. Distribution Loss:
a. BESCOM has indicated that the actual distribution losses for FY 18 is 13.17%
as against 12.50 % approved by the Commission. However, in the submission
made, BESCOM has wrongly reckoned the Commission approved distribution
loss as 13 % (upper limit), instead of 12.50 % (average limit) thereby
understating the deviation by 0.5 %
b. T&D losses for FY 18 - A comparison with the previous financial year shows
that, out of the 25 towns to which BESCOM distributes power, 18 towns have
been able to reduce their T&D losses in FY 18, showing an average reduction
in T&D losses by 6 %.
c. For FY 18, the lowest T&D loss was noted in Davanagere CSD town, which
has seen a reduction in T&D losses by 8 percentage points from the previous
financial year (from 10. 65 % in FY 17 to 2.64 % in FY 18)
Below, a sample of five towns have been represented graphically which have been able to
reduce their T&D losses by a huge margin in FY 18
9www.bpac.in
Figure 2: T&D losses for FY 17 and FY 18
.
T&D losses for FY 17 and FY 18
34.4 35.74
26.73
23.08
18.02
11.63 13.69
8.69 10.65
2.64
MULABAGILU GOWRIBIDANUR TUMKUR CSD DODDABALLAPURA DAVANAGERE CSD
% T&D loss Mar-17 % T&D loss Mar-18
While we welcome the efforts by BESCOM to reduce the T&D losses, it is disheartening to
see the continued T&D losses in Ramanagara, Tiptur, Harappanahalli, Chitradurga and
Shidlagatta towns and sub divisions.
Table 7: % of T&D loss
Our Prayer to the Commission
• We request the Commission to not to allow the distribution losses calculated by
BESCOM considering the approved loss at 13 % instead of 12.50%. We request
the KERC to direct BESCOM to recalculate the distribution losses with the
Commission approved rate of 12.50%
• We welcome the initiatives taken by BESCOM to reduce the T&D losses in 21 towns
and sub-divisions in FY 18 within the Commission approved rates of 15.87%. KERC
should direct BESCOM to provide incentives for such towns and sub-divisions and
recognize them. We also notice that the 4 remaining towns and sub divisions have T&D
losses above 15.87%; the Hon’ble Commission should direct BESCOM to draw a plan
of action to identify the leakages and reduce the T&D losses.
10www.bpac.in
• The Commission should note that the division which have higher T&D losses than the
approved rates by KERC should not average their losses at BESCOM level. These
losses should not be passed on to consumers and rather, should be absorbed by
BESCOM in its truing up.
• We request the commission to ensure all towns which have distribution loss above
12.50% should be monitored closely and brought below 12.50%.
• Further, we urge the Commission to set targets for T&D losses at each zonal level
for BESCOM and then narrow down to division and sub-division level instead of
aggregating it at BESCOM level.
• The disaggregated data for the division wise Distribution losses have not been made
available by BESCOM in their submission this year. We request KERC to direct
BESCOM to provide the data for the division wise distribution loss.
II. Power Purchase Cost:
Table 8: Approved and Actual Power Purchase Cost
• BESCOM in its submission has stated that the increase in power purchase cost is due to
the increase in energy purchase from CGS energy, Renewable energy and short- and
medium-term power purchase.
• From the above table it can be established that BESCOM could have diligently made use
of the available source of power, within the Commission approved rates and reduced the
final power purchase cost for FY 18 by INR 1498.9 crs.
• For FY 18, there is a huge variation observed in power purchase cost for CGS Energy
(INR 796.22 crs), Renewable Energy (INR 448.77 crs) and Short term and Medium term
(INR 305.83 crs)
• Between FY 13 and FY 15, BESCOM’s power purchase cost was lower than the
Commission approved rates. However, in the past three years (FY 16 – FY 18), BESCOM
has been overshooting the approved limits of the total power purchase cost as shown in
the table below. This indicates poor planning on BESCOM’s side to procure power and
rely highly on the short- and medium-term power procurement at higher prices.
11www.bpac.in
• It is also observed from the table below that the gap between the actual and approved
power purchase cost for FY 18 has increased two-fold from the previous financial year
Table 9: Approved and Actual Power Purchase Cost
Power Purchase Cost FY-13 FY-14 FY-15 FY-16 FY-17 FY-18 Trend
Approved (INR crs) 11292.61 10914.8 11922.09 11840.15 12954.19 13624.31
Actuals (INR crs) 10780.55 10702.76 11917.42 12600.53 13700.83 15123.21
Gap -512.06 -212.045 -4.67 760.38 746.64 1498.9
Our Prayer to the Commission
• We request the Commission to not to allow the increase in power purchase cost which
has been brought about by increase in the cost of power procurement mainly from CGS
Energy and Short- and medium-term purchase. We request the Commission to
disallow the increase in power purchase cost of INR 1102.05 for truing up for FY
18.
III. Sales
Table 10: No of Units Sold (MU) category wise
No of Units Sold (MU) FY -14 FY - 15 FY - 16 FY - 17 FY - 18
LT
Domestic 5369.87 5854.57 6156.1 6156.09 6616.53
Commercial 1536.91 1663.33 1754.07 1879.3 2005.97
Industrial 1109.44 1134.22 1150.4 1163.22 1185.41
Others 1009.28 1014.45 938.46 1127.99 1476.24
Total LT excluding Agricultural 9025.5 9666.57 9999.03 10326.6 11284.15
Agricultural 5246.57 5938.79 6197.85 7292.56 6478.16
Total LT including Agricultural 14272.07 15605.4 16196.88 17619.16 17762.31
HT
Industrial 5069.16 4750.15 4593.21 4456.17 4470.59
Commercial 2855.68 2795.89 2614.9 2889.68 2562.32
Others 859.24 1266.39 1076.09 1155.58 1145.29
Total HT excluding Agricultural 8784.08 8812.44 8284.2 8501.43 8178.2
Agricultural 9.22 18.29 57.11 15.07 26.76
Total HT including Agricultural 8793.3 8830.72 8341.31 8516.5 8204.96
Total LT+HT 23065.37 24436.08 24538.19 26135.66 25967.27
• From the above table it is observed that there is a dip in the number of units sold (MU)
from FY 17 to FY 18 HT category by 4 %.
12www.bpac.in
Table 11: FY 18 Sales – Units sold in MU
• In FY 18, 68 % of the sales were catered to the LT category, contributing 56.58 % of
the revenue to BESCOM and 31 % sales to the HT category contribute 43.42 %
revenue to BESCOM
• Of the 68 % in the LT category, 73 % of the sales were in the domestic and the agricultural
sectors
• In the HT category, industry consumed the highest MU – 4470.59 (54.5%)
• HT and LT combined, domestic followed by agriculture sector had the highest sale of
25.48 % and 25.05 % respectively.
Table 12: FY 18 (Sales – Units sold in MU – Approved versus Actual
• In the FY 18, there is a dip in the sale of power under the domestic and Industrial sectors
for both LT and HT categories.
• The sale in the domestic sector dipped by 5 % than the approved sales by the Commission.
Similarly, the sale in the industry sector for both LT and HT category were less than the
Commission approved sales by 0.2 % and 4.1 %
• Further, the sales in the Others category (including water supply, street lights) were higher
in the LT catergory (40.2%) compared to the Commission approved sales.
HT Sales
HT Sales is an integral part of BESCOM’s revenue. At a time where Bangalore Metropolitan
Region and its adjoining districts are prospering, and Karnataka is growing at 8.5%
CAGR (Economic Survey of Karnataka 2017-18), many businesses are being set up (as can
be seen from the increase in the number of installations). It is disheartening to see that these
13www.bpac.in
businesses are choosing not to procure power from the BESCOM (energy sold units are
falling).
Table 13: HT sales
HT FY - 14 FY - 15 FY - 16 FY - 17 FY - 18 Trend
Energy Sold (MU) 8793.30 8830.68 8341.31 8231.38 8205.00
Number of Installations 10457 11416 13635 13841 14920
Revenue (rs in crs) 5701.77 5994.12 6414.77 6613.53 7508.09
Average realization rate (INR/unit) 6.48 6.79 7.69 8.03 9.15
• From our analysis, it is observed that ARR for HT category is higher than the LT category
by 66%. (ARR for LT – 5.51 (FY 18), HT – 9.51 (FY 18) )
Figure 3: HT and LT Consumer vs Consumption Distribution FY 18
• From the above image it is observed that consumer distribution for FY 18 shows that 99.87
% are under the LT tariff category and 0.13 % of the consumers are under the HT category.
• 0.13 % of the HT consumers consume 59 % of the total energy in MU, which is higher
than energy consumed in the LT category by 18%.
• The HT Consumption and Consumer Mismatch is highlighted in the chart below. The
number of installations in the HT category, although has been increasing YoY, the number
of units sold has been decreasing.
Figure 4: HT Consumption Mismatch
14www.bpac.in
Our Prayer to the Commission
• The Commission should direct BESCOM to take note of declining HT consumption
and probe into the matter to suitably cater to this segment.
• The Commission should acknowledge its responsibility in safeguarding the industrial
sector which fuels the growth and job creation in any geography, especially given the fact
that Bengaluru alone contributes almost 60% of Karnataka’s GDP and has to compete with
increasingly well-governed and business-friendly cities like Hyderabad and Chennai and
not increase rates on HT
Specific Consumption of IP sets
• In FY 2018, the actual sales of BESCOM is higher by 131.09 MU (2.12%) in
comparison with the approved sales of 6157.95 MU
Table 14: IP Sets Sales in MU – Approved versus Actual FY 18
• BESCOM has estimated an addition of 25000 IP sets for each year during the control
period (FY 20 – FY 22). Further, BESCOM has stated in its submission that as per
GOK’s estimations, the total number of IP sets in the state is projected to increase by
50,000 per annum.
• The number of IP sets projected by BESCOM is a serious concern since as highlighted
in the above tables, BESCOM caters largely to urban requirements. Therefore,
BESCOM should provide a realistic projections of IP sets per annum for the 5th control
period.
• The specific consumption per IP set for FY 18 is 7210.31 units/installations/annum,
which is lower than the consumption for FY 17 (8860.52 units/installations/annum)
• From the below table it could be observed that between FY 17 and FY 18, there is a
3.7% increase in the number of IP sets installations, but there a is decline of 13.7% in
the total energy consumed.
Table 15: IP Sets Specific Consumption FY 18
Year FY 16 FY 17 FY 18 FY 19 (P) FY 20 (P)
No of Consumers 809170 841228 872229 900047 925047
Total MU consumed 6189.9 7285.47 6289.04 5940.1 6660.34
Specific Consumption 7649.69 8660.52 7210.31 6599.77 7200.00
% change in no of consumers 4.0% 3.7% 3.2% 2.8%
% change in total MU consumed 17.7% -13.7% -5.5% 12.1%
% change in specific consumption 13.21% -16.75% -8.47% 9.09%
Table 16: Progress of Metering in BESCOM
15www.bpac.in
From the above table it could be observed that as of September 2018, BESCOM has achieved
only 0.24 % of the metering for the existing IP sets. In the interest of controlling the leakages
in the distribution channel, we request the Commission to pass an order directing BESCOM to
expedite the process of metering all the functioning IP sets for the current control period and
submit the annual progress to KERC.
Table 17: Projected subsidy for IP sets – FY 20
Projected subsidy for IP sets - FY 20
(all numbers are projections based on BESCOM's submission)
Number of installations 925047
Number of units consumed by IP sets 6660.34
Average Power Purcahse Cost fo FY 20 (INR / unit) 5.9
Total Power Purcahse Cost for IP set
consumption (INR crs) 3929.60
Specific Consumptionn (IP set/ annum) 7200.00
Commission Determined Tariff (CDT) for FY 20
(INR/ unit) 5.45
Subsidy to be received by BESCOM from GoK (per
IP set/annum) (INR) 39240
Total Subsidy for FY 20 (INR crs) 3629.88
The table above depicts the total power cost for IP sets projected for FY 20 at INR 3929.60 crs.
Looking at the projected number of installations (925047), specific consumption of IP
set/annum is estimated at 7200 units / annum. The total subsidy amount for FY 20 is estimated
at INR 3629.88 crs. We urge the Commission to take note of the above calculation and
collect the total power purchase cost from Government of Karnataka and not cross
subsidize consumers from other tariff categories (cross subsidy amounts to INR 299.72
crs)
Our Prayer to the Commission
• In our FY 16-17 submission to the KERC, B.PAC had requested the Commission to
not to consider regularization of illegal IP sets for any cross subsidy or tariff hike to be
paid by other customers. Through the Commission we request BESCOM to furnish
number of identified illegal IP sets in FY 18 and actions initiated against such
consumers.
• As the Hon’ble Commission may be aware that, there exists duplicate and multiple IP
set per farmer. B.PAC had requested the Commission to identify and remove such IP
sets to avoid subsidy to the rich. In our present submission to the Commission, we
would like to reiterate the same request in the interest of other consumers who are
diligently paying for their single uses.
• The Hon’ble Commission had directed the Government of Karnataka to formulate a
suitable policy to implement the suggestion of direct remittance of subsidy to farmers
it it’s FY 17 order. However, to the best of our knowledge, GoK has not yet formulated
16www.bpac.in
a policy. We request KERC to advice Government on this matter so as to enable
proper accounting of energy and also facilitate accurate computation of losses in
the distribution system.
IV. BESCOM’s collection efficiency:
Table 18: Trade Receivables
FY 19 (Until
Particulars FY 15 FY 16 FY 17 FY 18 FY 20 (P)
Sept 2018)
Revenue from Operations 13479.6 14226.85 15861.15 18042.06 19802.11 20744.01
Trade Receivables
FY 19 (Until
Particulars FY 15 FY 16 FY 17 FY 18 FY 20 (P)
Sept 2018)
Receivables against Sale of Power 4371.30 5659.86 7178.60 6090.65 6363.87 6650.35
Loans and Advances 664.10 811.99 1216.94 1435.92 1494.63 1466.08
Sundry Receivables 2742.28 2170.07 1817.36 2264.88 2144.13 2194.13
Total Receivables 7777.68 8641.92 10212.90 9791.45 10002.63 10310.56
Monthly Revenue 1123.30 1185.57 1321.76 1503.50 1650.18 1728.67
No of Sales months Outstanding 6.92 7.29 7.73 6.51 6.06 5.96
• From the table, it can be observed that BESCOM’s collection efficiency has
improved for FY 18, from 7.73 sales month outstanding to 6.51 sales month
outstanding.
• The Commission has approved three months sales outstanding for BESCOM to
complete the reconciliation of collections. However, for FY 18, the BESCOM is
lagging by 3.51 sales month. If one considers 10 % interest rate on this
outstanding amount, it works out as INR 527.73 crs. We request the
Commission to not consider this amount for truing up exercise
• BESCOM has earmarked 1135.76 crores as doubtful receivables for FY 19 (as per
the half yearly statement for the period ended 30th September 2018), which is 8%
of the total revenue for FY – 19
Table 19: Trade Receivables and Revenue FY 18
• As on half year ended September 18, receivables make up 94 % of the sales. If one
assumes 16.6 % i.e. 2 months sales, it amounts to approximately INR 1600 cr.
17www.bpac.in
Adding another 20 % of total sales as other receivables (INR 1925 cr) makes it INR
3523 cr. An excess of INR 5525.48 crs is shown as receivables for FY 18.
Table 20: Trade Receivables and Revenue FY 20
• From the above table, as projected by BESCOM for FY 20, the above line items
make 50 % of the sales. However, if one assumes, 16.6% i.e. 2 months sales, it
amounts to approximately INR 3443 crs and adding another 20 % of this for other
receivables of INR 688 crs makes it INR 4132.20 cr.
• An excess of INR 16611 crs is shown as receivables, loans and advances and sundry
receivables showing total lack of financial discipline and lack of collection
efficiency.
Our Prayer to the Commission
• We urge the Commission to take note of the above-mentioned points and direct
BESCOM to bring down the receivables in a structured manner and reduce
the finance cost. Consumers should not be made to pay for BESCOM’s
deployment of excess capital.
• Further, the BESCOM has made accumulation of INR 1135.76 crs towards doubtful
debts for FY 19. The Commission should direct the BESCOM to identify the names
of the doubtful receivables and furnish the same to Commission and make it public
and disallow INR 1135.76 crs from truing up exercise. We request the
Commission direct all ESCOM’s to give clarity on the doubtful debts written
off in every financial year. The same should be submitted to Commission and
made available to public on BESCOM’s website.
• In the FY 17, the BESCOM had made provision of INR 1173.51 crs toward
doubtful debt. We request the Commission to direct BESCOM to provide
clarification on amounts recovered for FY 17
• It is observed the Regulator in Gujarat while passing the tariff order, has indicated
the figures for bad debt written off for the ESCOMS in the state. We urge the KERC
to set similar precedence in the state of Karnataka.
• We request the Commission to set targets for each financial year for all ESCOM’s
to bring down the doubtful debts/ receivables.
18www.bpac.in
d) New Proposals
• Tariff Categorization of club houses located within the residential apartment
complexes
o The services catered within the apartment complexes are for the people residing
in such communities and are not commercial in nature.
o B.PAC is of the opinion that this step is regressive, hence does not support
the proposal by BESCOM to consider club houses, gyms, sport facilities of
the apartment complexes under the commercial tariff category.
• Special Incentive Scheme:
o B.PAC supports this proposal by BESCOM in the interest of attracting
more HT consumers and servicing them. However, we request the
Commission to convene a meeting with the industry body along with
BESCOM to work out a suitable mechanism to roll out the Special Incentive
Scheme.
• Increase fixed charge on HT
o BESCOM has requested KERC to charge higher fixed charge on the HT
consumers stating that a few of the states (Madhya Pradesh, Tamil Nadu,
Andhra Pradesh and Maharashtra) charge higher demand/fixed charges from
the HT consumers.
o B.PAC would like to reiterate that KERC is formed to protect the interest of all
the consumers and KERC should bring in a mechanism to calculate the fixed
charge and recover the same from the HT consumers.
o The rationale of comparing the fixed cost with other states is not logical,
since it is only a short-term plan to make up for the loss of revenue from
HT consumers who have opted for open access. Therefore, B.PAC does not
support this proposal by BESCOM.
• Domestic Tariff – difference in slabs
o B.PAC supports the tariff design proposed by BESCOM as per the
National Electricity Policy.
Table 20: Tariff proposal for LT 2a (i) category
Existing Tariff for LT2a(i) category Proposed tariff for LT2 a(i) category
Energy charges (Rs/units) for units Energy charges (Rs/units) for units
consumed in a month consumed in a month
0-30 units (Lifeline consumption) 3.5 1-50 (all units) 3.9
31 to 100 units 4.95 1-100 all units (>51 100 200 (all units) 7
301 to 400 units 7.6
Above 400 units 7.65
o While we welcome the reduction in the slabs for LT 2 a(i) category, we urge the
Commission to bring it to the notice of BESCOM that this change in the slabs
should not affect the consumption patterns due to lower prices (INR 7 / unit) on
higher consumption units (> 200 (all units)).
19www.bpac.in
• Consider Private unaided institutions under LT 3 / HT 2 b category to pay cross
subsidy
o At present, the private unaided institutions are considered under the LT 2(b)
category, where the rates approved by the Commission are at 6.8 INR/ unit for
energy consumption between 0-200 units and 8.0 INR/ unit for energy
consumption beyond 200 units.
o The new proposal put forth by BESCOM to consider the private unaided
educational institutions under the LT 3 / HT 2 b category will increase the per
unit cost by an average of 1.1 INR / unit or 1.4 INR / unit.
o Further, the fixed charged will increase from the existing INR 65 per kW to
INR 90 per kW under the LT 3 tariff category and to INR 300/kVA under the
HT 2 b tariff category
o We request the Commission to disallow the proposal by BESCOM to
consider the educational institutions under the commercial tariff category.
Since education is a social sector, it should be considered under the specific
tariff category and not be charged a higher tariff of Commercial category
• Consider private hospital under commercial category
o Healthcare is categorized under the service sector. Therefore, the tariff should
not be considered on par with the commercial category.
o B.PAC feels this is a regressive step and would be looked at as anti-
consumer; hence, we do not support this proposal by BESCOM.
• Proposal to shift IT companies to a different slab – between HT2a/LT5 and
HT2b/LT:
o Bengaluru has emerged as IT Start-up Capital of India with more than 30% of
national share contributing 60 % to the state GDP.
o Hence B..PAC rejects this proposal by BESCOM to consider IT and
software companies under a higher tariff category as it would be seen as a
regressive step in attracting investment.
e) Determination of Tariff for FY 20
• B.PAC requests the Commission to disallow the proposed tariff by BESCOM under the
Lt – 6 (c) category for electric vehicle charging stations. Electric vehicles help to
achieve sustainable and green mobility in Bengaluru city. Therefore, the Government
should create a conducive environment by providing charging infrastructure at an
affordable rate.
• B.PAC welcomes BESCOM’s BMRCL tariff proposal under the HT 2 (a) (ii) category
which has been maintained at the same rate from the previous tariff order at INR 5/
unit.
20www.bpac.in
f) BESCOM prayer for Leave of the Commission
• Further, the comparison between the actual (FY 18) power purchase cost to the
projected power purchase cost (FY 20) is shown in the below table.
Table 21: Source of Power – Projections for FY 20
Actuals FY 17-18 Projections for FY 19 - 20 Variation
Source of Power Energy in Cost in Rs Per unit Energy in Cost in Rs Per unit cost Energy in Cost in Rs Per unit
MU crs cost in Rs MU crs in Rs MU crs cost in Rs
KPCL Hydel 1752.90 190.44 1.09 744.50 99.25 1.33 -57.53% -47.88% 22.71%
KPCL Thermal 8452.65 3648.47 4.32 9959.16 6330.64 6.36 17.82% 73.51% 47.27%
CGS Energy 11016.52 4234.85 3.84 13403.72 6027.89 4.50 21.67% 42.34% 16.99%
UPCL 3336.79 1676.65 5.02 3214.60 1867.11 3.50 -3.66% 11.36% -30.34%
Renewable Energy 4698.00 2043.64 4.35 6550.32 2858.29 4.36 39.43% 39.86% 0.31%
Other State Hydel 42.84 30.54 7.13 19.46 8.96 4.60 -54.58% -70.66% -35.41%
Short Term /Medium term 1975.69 805.78 4.08 -100.00% -100.00% -100.00%
Solar Park at Pavgada 57.00
PGCIL Charges 1016.23 1125.70 10.77%
KPTCL Charges 1358.51 1740.00 28.08%
SLDC & POSOCO 15.67 19.68 25.59%
Other charges/Inter ESCOM/Energy balancing -58.68 102.44 -100.00% -100.00%
Total 31216.71 15123.22 4.84 33891.76 20134.52 5.94 8.57% 33.14% 22.61%
• It is observed from the above table that the projected cost for KPCL Thermal has
increased by 73. 51 % from FY 18 and the projected cost for CGS energy has increased
by 42.34 % which amounts to INR 12358 crs.
• It is also observed that BESCOM has not projected the power procurement through
short- and medium-term arrangements. However, BESCOM has been regularly
procuring power from short- and medium-term arrangements in the range of INR 800
crs – 900 crs per annum (FY 17 and FY 18)
• Further, in the current submission, BESCOM has stated the deficit of INR 2933.82
crs for FY 20, requesting for an increase in tariff by INR 1.01 from the
Commission.
• Our analysis has shown that this deficit is arriving mainly because of the increased
projections in the power purchase cost for FY 20 by 33 % from FY 18
• If the power purchase cost is estimated to increase from the actuals of FY 18 by 5% for
FY 20, the total power purchase cost would be estimated at INR 15879 crs. Whereas,
the power purchase cost for FY 20 is at INR 20134.52 crs. We observe that, the power
purchase cost has been inflated by INR 4255 crs while projecting the numbers for
FY 20.
Our Prayer to the Commission
• The deficit estimated for FY 20 is highly inflated to mislead the Commission and
consumers. The deficit of INR 2933.82 crs for FY 20 should be disallowed by KERC.
• For the above-mentioned reasons, the Commission should not accept the proposal
put forth by BESCOM requesting increase in the tariff of INR 1.01 for FY 20.
• The Commission should direct BESCOM to submit realistic projections and also bring
discipline in procuring power at low cost.
21www.bpac.in
Conclusion
BESCOM’s prayer allowing to hike the average tariff by INR 1.01 across all categories
should not be passed on as a burden to consumers for the following reasons:
1) We request the Commission to disallow the variation in distribution loss of 0.67%
(173.9 MU) amounting to an excess loss of INR 120.74 crs.
2) We request the Commission to not to allow the distribution losses calculated by
BESCOM considering the approved loss at 13 % instead of 12.50%. We request
the KERC to direct BESCOM to recalculate the distribution losses with the
Commission approved rate of 12.50%
3) The percentage of PPC to revenue has been increasing disproportionately (from 86.20
% in FY 2017 to 97.06 % in FY 20) and is projected at 102.64 % for FY 22. The power
purchase cost higher than the revenue shows poor planning and incapability of
BESCOM to buy power at lower available market rates. We request the KERC to
direct BESCOM to provide revised submission on realistic projections of power
purchase cost to revenue for the current control period.
4) We request the Commission to disallow the increase in power purchase cost of INR
1102.05 for truing up for FY 18.
5) Through the Commission we request BESCOM to furnish number of identified
illegal IP sets in FY 18 and actions initiated against such consumers.
6) We urge the Commission to take note of the calculation (page 16) and collect the
total power purchase cost from Government of Karnataka and not cross subsidize
consumers from other tariff categories (cross subsidy amounts to INR 299.72 crs)
7) The Hon’ble Commission had directed the Government of Karnataka to formulate a
suitable policy to implement the suggestion of direct remittance of subsidy to farmers
it it’s FY 17 order. However, to the best of our knowledge, GoK has not yet formulated
a policy. We request KERC to advice Government on this matter so as to enable
proper accounting of energy and also facilitate accurate computation of losses in
the distribution system
8) The BESCOM had made provision of INR 1173.51 crs toward doubtful debt. We
request the Commission to direct BESCOM to provide clarification on amounts
recovered for FY 17.
9) The deficit amount for FY 20 is highly inflated to mislead the Commission and
consumers. The deficit of INR 2933.82 crs for FY 20 should be disallowed by
KERC.
22www.bpac.in
10) In the current submission by BESCOM, the details on the CCS from each tariff category
has not been made available. However, it was presented in detailed in the previous tariff
determination submissions. We request the Commission to direct BESCOM to
furnish the same and analyse the CCS charges paid by other segments before
passing the tariff order for FY 20.
11) We request the KERC to set up an expert committee to draw a five-year roadmap
for all the ESCOM’s to determine charges for a long term, instead of setting an
annual tariff.
Sir, as an independent regulator pleases protect the interest of citizens of Bengaluru in an
unbiased manner and not the interest of BESCOM
Hence, on behalf of citizens of Bengaluru, we once again request you to kindly consider the
above-mentioned points while evaluating the proposal from BESCOM for increasing the power
tariff for FY 19 – FY 20 and to draw conclusion which will not burden the citizens of
Bengaluru further.
Thanking you.
--Sd— --Sd—
Revathy Ashok, T.V. Mohandas Pai
Hon Managing Trustee &CEO Vice President
For,
Bangalore Political Action Committee
23You can also read