Initial Public Offering - March 2021 - Karooooo
←
→
Page content transcription
If your browser does not render page correctly, please read the page content below

Initial Public Offering
      March 2021

                          1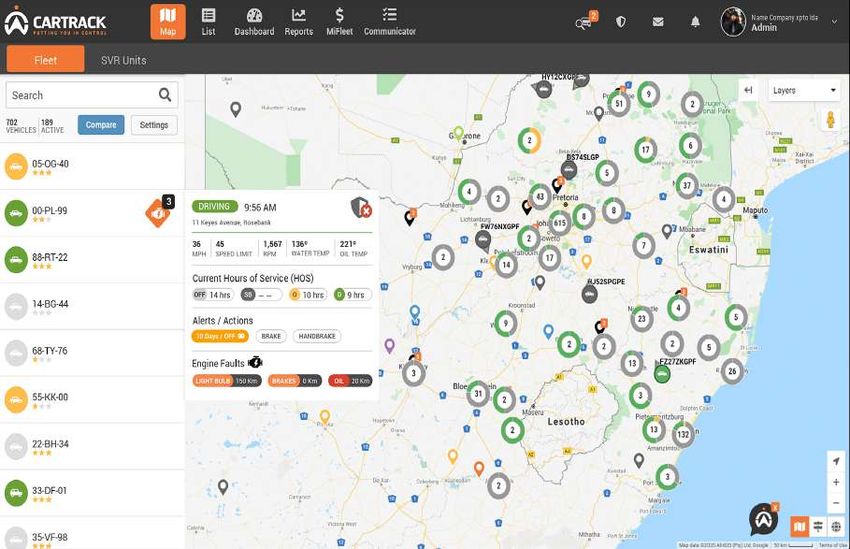
DISCLAIMER
Karooooo Ltd. (“Karooooo,” the “Company,” “we” or “us”) has filed a registration statement on Form F-1 (including a preliminary prospectus) with the Securities and Exchange Commission (the “SEC”) for the offering to which this presentation relates.
The registration statement has not yet become effective. Karooooo’s ordinary shares may not be sold, nor may offers to buy be accepted, prior to the time the registration statement becomes effective. Before you invest, you should read the
preliminary prospectus and the other documents Karooooo files with the SEC for more complete information about Karooooo and this offering. You can obtain these documents for free by visiting EDGAR on the SEC website at www.sec.gov.
Alternatively, copies of the preliminary prospectus may be obtained from Morgan Stanley & Co. LLC, Attention: Prospectus Department, 180 Varick Street, Second Floor, New York, New York 10014; or BofA Securities, Attention: Prospectus
Department, NC1-004-03-43, 200 North College Street, 3rd Floor, Charlotte, NC 28255-0001, or by email at dg.prospectus_requests@bofa.com.
This presentation shall not constitute an offer to sell or the solicitation of an offer to buy these securities, nor shall there be any sale of these securities in any state or jurisdiction in which such offer, solicitation or sale would be unlawful prior to
registration or qualification under the securities laws of any such state or jurisdiction. The information in this presentation is current only as of the date of this presentation and may have changed. We undertake no obligation to update any such
information in light of new information, future events or otherwise.
Forward-Looking Statements
The information in this presentation (which includes any oral statements made in connection therewith, as applicable) includes “forward-looking statements.” Forward-looking statements are based on our beliefs and assumptions and on information
currently available to us, and include, without limitation, statements regarding our business, financial condition, strategy, results of operations, certain of our plans, objectives, assumptions, expectations, prospects and beliefs and statements
regarding other future events or prospects. Forward-looking statements include all statements that are not historical facts and can be identified by the use of forward-looking terminology such as the words “believe,” “expect,” “plan,” “intend,” “seek,”
“anticipate,” “estimate,” “predict,” “potential,” “assume,” “continue,” “may,” “will,” “should,” “could,” “shall,” “risk” or the negative of these terms or similar expressions that are predictions of or indicate future events and future trends.
By their nature, forward-looking statements involve risks and uncertainties because they relate to events and depend on circumstances that may or may not occur in the future. We caution you that forward-looking statements are not guarantees of
future performance and that our actual results of operations, financial condition and liquidity, the development of the industry in which we operate and the effect of acquisitions on us may differ materially from those made in or suggested by the
forward-looking statements contained in this presentation. In addition, even if our results of operations, financial condition and liquidity, the development of the industry in which we operate and the effect of acquisitions on us are consistent with the
forward-looking statements contained in this presentation, those results or developments may not be indicative of results or developments in subsequent periods.
Important factors that could cause actual results, performance or achievements to differ materially from those expressed or implied by these forward-looking statements are disclosed under the “Risk Factors” and “Cautionary Statement Regarding
Forward-Looking Statements” sections of the Registration Statement on Form F-1 filed on March 22, 2021.
You are cautioned not to place undue reliance on any forward-looking statements, which speak only as of the date of this presentation. We disclaim any duty to update and do not intend to update any forward-looking statements, all of which are
expressly qualified by the statements in this section, to reflect events or circumstances after the date of this presentation.
Non-IFRS Financial Measures
This presentation includes certain non-IFRS financial measures, including adjusted EBITDA, adjusted EBITDA margin, free cash flow and free cash flow margin. These non-IFRS financial measures are not measures of financial performance in
accordance with IFRS and may exclude items that are significant in understanding and assessing our financial results. Therefore, these measures should not be considered in isolation or as an alternative or superior to IFRS measures. You should be
aware that our presentation of these measures may not be comparable to similarly-titled measures used by other companies. Please see the reconciliations included in this presentation.
Market and Industry Data
We include statements and information in this presentation concerning our industry ranking and the markets in which we operate, including our general expectations and market opportunity, which are based on information from independent industry
organizations and other third-party sources (including a third-party market study, industry publications, surveys and forecasts). While Karooooo believes these third-party sources to be reliable as of the date of this presentation, we have not
independently verified any third-party information and such information is inherently imprecise. In addition, projections, assumptions and estimates of the future performance of the industry in which we operate and our future performance are
necessarily subject to a high degree of uncertainty and risk due to a variety of risks. These and other factors could cause results to differ materially from those expressed in the estimates made by the independent parties and by us.
Trademarks and Trade Names
In our key markets, we have rights to use, or hold, certain trademarks relating to Cartrack, or the respective applications for trademark registration are underway. We do not hold or have rights to any other additional patents, trademarks or licenses,
that, if absent, would have had a material adverse effect on our business operations. Solely for convenience, trademarks and trade names referred to in this presentation may appear without the “®” or “™” symbols, but such references are not
intended to indicate, in any way, that we will not assert, to the fullest extent possible under applicable law, our rights or the rights of the applicable licensor to these trademarks and trade names. We do not intend our use or display of other
companies’ tradenames, trademarks or service marks to imply a relationship with, or endorsement or sponsorship of us by, any other companies. Each trademark, trade name or service mark of any other company appearing in this presentation is the
property of its respective holder.

                                                                                                                                                                                                                                                                     2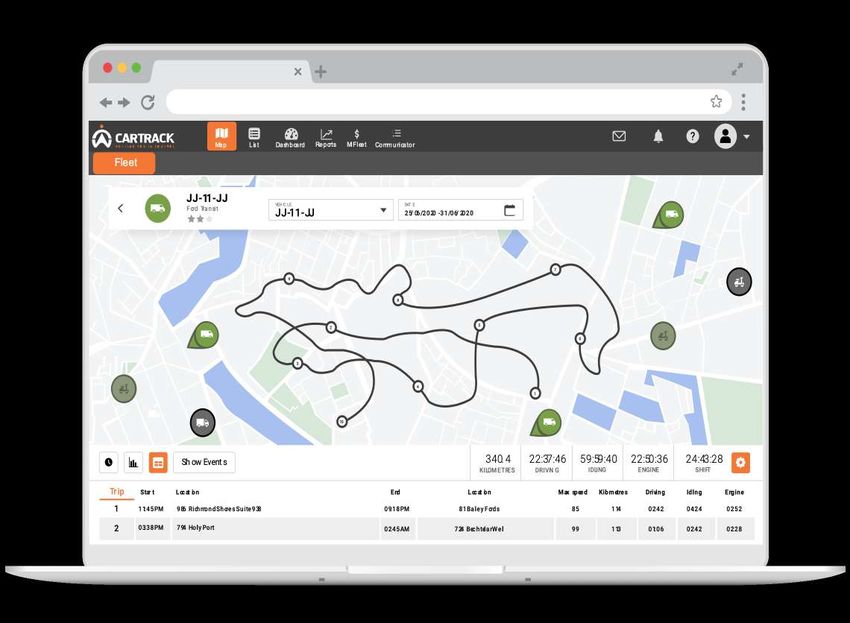
OFFERING SUMMARY

     Issuer                                                             Karooooo Ltd.

     Proposed exchange / ticker                                         Nasdaq: KARO

     Shares offered                                                     4,000,000 (2,500,000 Primary and 1,500,000 Secondary)
     Over-allotment                                                     600,000 (Primary)

     Assumed initial public offering
                                                                        $47.52
     price(1)
                                                                        General corporate purposes including the growth and expansion of Cartrack, such
     Use of proceeds
                                                                        as R&D(2)
     Lock-up                                                            180 days – Selling Shareholder, Directors and Officers

     Bookrunners                                                        Morgan Stanley, BofA Securities, William Blair
     Co-managers                                                        Canaccord Genuity, Raymond James, Stifel Nicolaus

 (1) Based  on the closing price of Cartrack Holdings Limited on March 19, 2021 on the JSE and the rand/U.S. dollar exchange rate of R14.7310 as of March 19, 2021, as adjusted for a ten to one share consolidation. The
 initial public offering price will be based on the closing price of Cartrack Holdings Limited on the JSE, as adjusted for a ten to one share consolidation, and the rand/U.S. dollar exchange on the pricing date.
 (2)
     Assuming full participation in Reinvestment as defined in the Registration Statement on Form F-1 filed on March 22, 2021 by eligible Cartrack shareholders. A portion of the proceeds may be used to repay outstanding   3
 indebtedness, if participation in the Reinvestment is less than 100%
(1)

                              Founded in South Africa, now headquartered in Singapore

(1)   Post Karooooo/Cartrack scheme of arrangement                                      4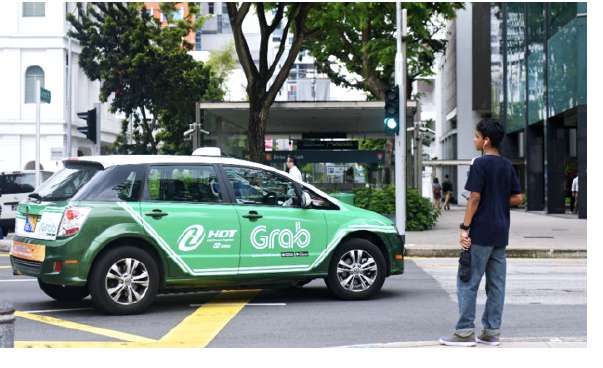
PRESENTERS

Richard Schubert                           Zak Calisto             Morné Grundlingh
 Chief Operating Officer                Founder, Chief Executive   Chief Financial Officer & Board
 Previously Chief Technology Officer    Officer & Board Member                Member

                                                                                                     5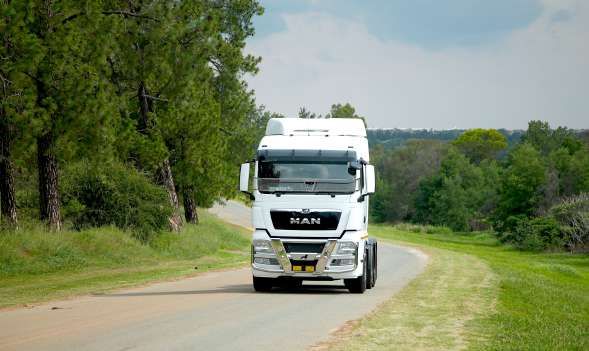
In our view, all vehicles will be
    connected & data will drive all aspects
          of mobility in the future

               OUR MISSION
 To build the leading mobility SaaS
platform that maximizes the value of
                data

                                              6
A HISTORY OF CONSISTENT ORGANIC GROWTH
                                        Scale                                                                      Growth                                                     Profitability

                            Total Subscribers                                                               Total Revenue                                                   Operating Profit
                                            000s                                                                      ZAR M                                                             ZAR M

                                                                                        (1)                                                                                                                              198
                                                                              1,306                                                                    589
                                                                                                                                                                                                                 185
                                                                      1,246                                                                                                                              182
                                                                                                                                               551
                                                                                                                                       535
                                                              1,175                                                                                                                      163     163
                                                      1,134                                                                                                             159
                                              1,127                                                                            511

                                     1,089                                                                            493                                                       147

                             1,039                                                                    468 470
                                                                                              462
                                                                                                                                                                128
                      990
              961

                Q4      Q1      Q2      Q3      Q4      Q1      Q2      Q3      Q4              Q4      Q1      Q2      Q3      Q4      Q1      Q2      Q3        Q4      Q1      Q2      Q3      Q4      Q1      Q2      Q3
              FY2 019 FY2 020 FY2 020 FY2 020 FY2 020 FY2 021 FY2 021 FY2 021 FY2 021         FY2 019 FY2 020 FY2 020 FY2 020 FY2 020 FY2 021 FY2 021 FY2 021   FY2 019 FY2 020 FY2 020 FY2 020 FY2 020 FY2 021 FY2 021 FY2 021

                    WITH STRONG FINANCIAL DISCIPLINE
 (1)As   of February 28 2021 per “Recent Developments” in the F-1                                                                                                                                                                 7
OUR TRACK RECORD OF EXECUTION

                                                                (1)                                                        (1,2,5)                                           (3)

                                                 1.3M+                                     ~163M USD                                                    98%
                                    Active subscribers in 23                                  ARR ZAR 2.4Bn                                 Subscription revenue
                                           countries

                                                               (3)                                                (3)                                                         (4)

                                                   34%                                                51%                                       Rule of 40
                                    Operating profit margin                           Adjusted EBITDA margin                                            Beaten

                     70,000+ COMMERICAL CUSTOMERS
(1)
    As of February 28, 2021 per “Recent Developments” in the F-1
(2)Exchange   rate of 14.6250 ZAR (South African Rand):USD as of February 28,2021
(3) For the 9 months ended November 30, 2020
(4)
    Subscription revenue YoY growth + net profit divided by subscription revenue sum to greater than 40 in FY2020 and Q3 FY2021
(5)
    ARR is defined as the annual run-rate subscription revenue of subscription agreements from all customers at a point in time, calculated by taking the monthly subscription revenue for all customers during that month   8
and multiplying by 12"
CONTINUOUS INNOVATION
Launched in South     Launched entry                   Expansion into   Launched Fleet   JSE IPO        Expansion into                      Beta launch of
 Africa with Track   level Cloud Fleet                    Europe         Optimization                    Asia Pacific                      Next Generation
  & Trace focus        Management                                          Platform                                                           Platform

      2004                 2007              2008        2009-2010          2013          2014            2014-2015         2019                2020            2021

                                         100K                                                                              1M                                1.3M+
                                         subscribers                                                                     subscribers                         subscribers

             Closed System with Limited                                   Fleet Management “SaaS” with                                      Data Enabled
                    Connectivity                                                Connectivity Focus                                            Platform

    Telematics industry evolution

                 Pre-2014                                                                  2014-2018                           2019-Future
                 •   2G/3G                                                                 •   3G/4G LTE                       •   5G
                 •   Proprietary hardware focus                                            •   SaaS focus                      •   Configurable solutions
                 •   Limited functionality                                                 •   Fleet optimization              •   Artificial intelligence
                                                                                                                               •   Data monetization
                                                                                                                                                                       9
WE SOLVE PROBLEMS

High Operating Costs    Unproductive Use of       Fragmented &        Safety & Eco
                            Resources         Inefficient Workflows   Compliance

                 Growing vehicle population with an increasing
                          demand for digitalization

                                                                                     10
A LARGE, UNDERPENETRATED MARKET
2018-2026 EXPECTED CAGR: 26%
(1)
Global TAM
(1)
$320.6Bn
Global TAM
$50.4Bn
$12.2Bn
Global SAM Global SAM
Europe: $6.5Bn USD Europe: $40.3Bn USD $77.4Bn
APAC & ME: $4.8Bn USD APAC & ME: $30.0Bn USD
Africa : $0.9Bn USD Africa : $7.1Bn USD
2018 2026 11
(1)The Global Automotive Telematics Market. Source: Allied Market Research. 2019CONTINUED INTERNATIONAL EXPANSION
UNDER COVID
‘000s Subscribers / ZAR M FY2019 FY2020 YoY change Q3 FY2020 Q3 FY2021 YoY change
SOUTH AFRICA
Subscribers 746 869 17% 841 962 14%
Subscription Revenue 1,117 1,384 24% 1,013 1,182 17%
AFRICA- OTHER
Subscribers 56 60 7% 60 62 3%
Subscription Revenue 98 107 10% 81 78 (3%)
EUROPE
Subscribers 83 99 20% 95 108 13%
Subscription Revenue 142 168 18% 124 164 32%
ASIA, MIDDLE EAST, USA
Subscribers 76 99 30% 92 115 25%
Subscription Revenue 164 228 39% 167 211 26%
12OUR SUCCESS ACROSS INDUSTRIES
South Africa
Rest of Africa
Europe
Asia
13WE CONTEXTUALIZE BILLIONS OF DATA
POINTS & DRIVE EXCEPTIONAL VALUE FOR
CUSTOMERS
DATA COLLECTION & REAL-TIME DATA
DATA CONTEXTUALIZATION MONETIZATION
AGGREGATION DRIVING INSTANT VALUE
Business intelligence
50Bn+ data points monthly(1) Telematics fleet
management
Proprietary Data Predictive analytics
in-vehicle storage &
Smart-Devices processing
AI powered video
telematics DIFFERENTIATED
DATA-DRIVEN Insurance
SaaS PLATFORM
Third-Party & OEM APIs & Communicator
in-vehicle third party systems
Smart-Devices receive & push data Know The Driver
MiFleet
Carzuka
(1)For the 6 month period ended January 30, 2021 14ONE POWERFUL & DIFFERENTIATED PLATFORM
Compliance Know The Driver
Know The Driver
Compliance
Communicator
MiFleet
Insurance Business Intelligence
INSURANCE BUY & SELL FINES &
CARS LICENCE
Carzuka AI Video and Fleet Telematics
Feature-rich & vertically integrated 15OUR PLATFORM ADVANTAGES
Easy-to-use & implement Seamless unified platform Massive data scale
Rapid innovation Strong customer success helpdesks Reliable & secure
CONTINUOUSLY ADDING NEW FEATURES
16COMMUNICATOR
Effortlessly plan, create, manage and optimize
delivery or on-site jobs to deliver high-quality
customer service
MIFLEET
Integrate, digitalize and automate fleet
admin, maintenance, cost analysis and
compliance
17BUSINESS INTELLIGENCE
Track trends, compare vehicles and
drivers, pinpoint inefficiencies and
benchmark your fleet
AI VIDEO & FLEET
TELEMATICS
Gain control of vehicles, drivers and cargo with real-
time visibility and establish a safety first culture with
preventative alerts and effective driver coaching
18KNOW THE DRIVER
Holistic risk management solution driving increased
compliance and enabling developmental finance,
insurance and other services
Temperature range throughout
entire delivery 23oF to 25oF
ECO & COMPLIANCE
Effortless compliance, improved fuel economy,
reduced food spoilage and actionable fleet
eco-efficiency scoring
19FLEET OWNERS AND DRIVERS LOVE US
CHALLENGE:
Driving OEM Optimizing vehicle maintenance & driver
performance
Customer Service SOLUTION:
• Digitalized offering with a user-friendly
dashboard
o Manage & improve customer productivity
o Reduce fuel consumption
o Increase maintenance revenue
CHALLENGE:
The Car Sharing Scaling car sharing
Economy SOLUTION:
• App-based wireless key technology
• 200+ vehicles shared with 14,000+ subscribers
• Increased revenue
• Pricing models built on data
• Optimised vehicle hygiene cleaning schedules
• Risk management with real-time vehicle
diagnostics & predictive maintenance
20FLEET OWNERS AND DRIVERS LOVE US
CHALLENGE:
Mining Safety & Compliance with health, safety & environmental regulations &
accident prevention
Compliance SOLUTION:
• Comprehensive safety of their personnel
• Integrated cameras, anti-collision technology & driver
prevention lock
• Driver behavior management towards zero harm in road
transportation
INDUSTRY:
Credit • Transporting 15M+ people daily
• 250,000+ minibus taxis
Underwriting • Dominant mode of public transport in South Africa
• 80,000+ active minibus taxi subscribers on our base
& Asset CHALLENGE:
Management
• Financing perceived high risk small entrepreneurs
SOLUTION:
• Visibility on affordability based on productivity & route
tariffs
• Analytical reports allow us to predict vehicle life expectancy
& condition of vehicle
• Real-time emergency alerts
21E-COMMERCE ADOPTION IS TRANSFORMING
CAR BUYING
Carzuka South Africa’s Used Car Market
A seamless, personalized and secure
end-to-end vehicle buying and selling experience
Beta-phase testing
~1.2M(1) in progress
South Africa Expected full launch in HY 2021
2019
Carzuka Advantages
• Leverage off our proven digital marketing capabilities
• Powerful analytics that leverage of Cartrack’s 1.3M+ subscribers data pool(2)
• Vehicle profiling and certification
• Visibility of Cartrack customer defleeting allowing first point of contact
• Customer profiling to understand needs and demand
• Established network of trusted dealerships
(1)
PS Market Research. 2019. Used Car Global Industry Analysis and applying Transunion, E-natis (double counting eliminated) & Lightstone data 22
(2)
As of February 28 2021 per “Recent Developments” in the F-1WHY WE WIN
Intuitive, comprehensive & differentiated
High customer ROI
SaaS platform
Vertically-integrated business model Strong brand in our key markets
Customer-centric culture with high
Fast & agile decision-making
referrals
WE PARTNER WITH OUR CUSTOMERS
23GO-TO-MARKET STRATEGY
Consumers & Small Medium Sized Large
Sole Proprietors Businesses Businesses Enterprises
1-60 day 1-90 day 1-8 month 3-24 month
sales cycle sales cycle sales cycle sales cycle
Largely Underpenetrated Market Penetrated Market
Focus on customer acquisition Focus on increasing ARPU
24CUSTOMER GROWTH DESPITE COVID-19
Consumers & Sole Proprietors Small Businesses Medium-Sized Businesses Large Enterprises
1 - 5 vehicles 1 – 24 vehicles 25 - 99 vehicles 100+ vehicles
553,225
Over 65 have
2,343 427
68,505 500+ vehicles(1)
485,843 2,189 409
61,754
397,227 54,368 1,787 341
FY FY Q3 FY FY Q3 FY FY Q3 FY FY Q3
2019 2020 FY2021 2019 2020 FY2021 2019 2020 FY2021 2019 2020 FY2021
Low industry & customer concentration risk
Car Rental Industry
RevenueOUR GROWTH STRATEGY
EXPAND
• Leverage economies of scale
• Target large enterprise fleets
GROW • Open new countries
• Acquire high volume of
small & medium enterprise
IMPLEMENT customers
• Maximize customer ROI
• Localize to customer needs
INNOVATE & culture • Leverage customer referrals
• Build the Cartrack team
• Lead with product
innovation to drive
customer demand
Continue to Innovate & Build Distribution
26A SOLID & EXPERIENCED MANAGEMENT TEAM WITH
A WINNING CULTURE
Zak Calisto Pedro Ventura Morné Grundlingh Richard Schubert Fatima Hassim Juan Marais Carmen Calisto
Chief Executive Chief Technology Chief Financial Chief Operating Chief Financial Joint Chief Revenue Chief Marketing &
Officer & Founder Officer Officer Officer Controller Officer Joint Revenue Officer
Wei Ling Tan Neo Nkobo Harry Louw Joshua Victor Brendan Horan Hong Yap Lau Siok Lan Lai
Joint Joint CEO Deputy CEO Investor Relations Group Consolidation Group Internal Systems
Chief People Officer Chief People Officer South Africa South Africa & Assistant to CEO Officer Officer
Innovative Customer-centric Business savvy 27INVESTMENT HIGHLIGHTS
Large & growing market opportunity with a long runway for sustainable growth
Integrated cloud software platform for enterprises and consumers
(1) (2)
Proven scalability with 1.3M+ subscribers generating 50Bn+ data points per month
Innovative culture with a track record of delivering new applications as customer needs evolve
Multiple levers for expansion that will contribute to sustained growth
Positioned for accelerated growth with consistent strong historical operating & EBITDA margins
Founder-led management team with experience operating as a public company in South Africa
(1) As of February 28 2021 per “Recent Developments” in the F-1 28
(2) For the 6 month period ended January 30, 2021ATTRACTIVE LONG-TERM FINANCIAL MODEL
SaaS Model with Stable Low Cost of Acquiring a Strong Comparative
Average Revenue Per Subscriber Benefits from
Subscriber Economies of Scale
High Margins & Cash Generation
29KEY METRICS
98% ~$163M USD 51%
Subscription revenue(1) ARR(2,3) High EBITDA margins(1)
High Revenue Visibility Strong Subscriptions High Profitability
1.3M+ ~60 95%
As of February 2021(3) Months Customer retention rate(4)
Total Subscribers Subscriber Life Expectancy Loyal Customers
(1)
For the 9 months ended November 30, 2020
(2)
Exchange rate of 14.6250 ZAR:USD as of February 28, 2021
(3) As of February 28 2021 per “Recent Developments” in the F-1
(4) Customer retention rate for small, medium & large enterprises calculated over a 3-year average as of November 30, 2020 by comparing the number of customers at the end of a year that had been with us at the 30
…..start of that yearOUR ORGANIC SUBSCRIPTION REVENUE
GROWTH
(1)
98% ZAR M
Subscription Revenue 24% 18%
YoY growth rate YoY growth rate
$122M USD(2)
1,888
1,635
1,521
1,385
FY FY Q3 Q3
2019 2020 FY202 0 FY202 1
(1)For 9 months ended November 30, 2020
(2)Exchange
31
rate of 15.43 ZAR:USD as of Novemeber 30, 2020ROBUST ARR GROWTH DURING PANDEMIC
ARR
ZAR M
18% under Covid-19
YoY growth rate
• Strong ARR growth despite Covid-19 due to agile
(1) adaptability
2,377
• Quarter ending May FY2021 most affected by hard
2,021 lockdowns
› Despite this we still achieved robust ARR growth
• Subscriber growth accelerated in HY2021
› All-time record for subscriber growth & financial
performance with 70,916 net new subscribers added to
platform in the 3 months ended November 30, 2020
As of February As of February
2020 2021
(1)As of February 28 2021 per “Recent Developments” in the F-1 32ACCELERATING ADJUSTED EBITDA WITH A
POSITIVE CASH FLOW
Adjusted EBITDA(1) FCF(2)
ZAR M ZAR M
27% 22% 14%
YoY growth rate YoY growth rate YoY growth rate
$61M USD(3) $33M USD(3)
937 513
855
738 411
699
361
50
FY FY Q3 Q3 FY FY Q3 Q3
2019 2020 FY202 0 FY202 1 2019 2020 FY202 0 FY202 1
Adjusted EBITDA FCF
44% 48% 49% 51% 3% 26% 25% 25%
Margin(1) Margin(2)
(1) Adjusted EBITDA & adjusted EBITDA margin are non-IFRS metrics. Please see appendix for reconciliation to closest metric calculated in accordance with IFRS
(2) Free cash flow defined as net cash generated from operating activities less purchase of property, plant & equipment. Free cash flow & free cash flow margin are non-IFRS metrics. Please see appendix for reconciliation to closest metric 33
calculated in accordance with IFRS.
(3) Exchange rate of 15.43 ZAR:USD as of November 30, 2020BALANCE SHEET
Balance sheet summary
Q3
ZAR M FY2019 FY2020 FY2021
Total cash 52 147 88
Total capitalized assets(1) 677 894 955
Total assets 1,529 1,845 2,002
Total deferred revenue -- 209 248
Total debt 239 23 18
Total liabilities 692 620 807
(1)Capitalized assets include capitalized telematics devices & intangible assets 34SCALING OUR SUBSCRIBER BASE
Total Active Subscribers
22% CAGR 16% YoY Growth Rate
Pre-pandemic 2016-2020 Despite Covid-19
(1)
1,306,000
1,126,515
960,798
751,380
600,610
502,894
FY FY FY FY FY FY
2016 2017 2018 2019 2020 2021
(1)As of February 28 2021 per “Recent Developments” in the F-1 35OUR LOW COST OF ACQUIRING A SUBSCRIBER
Total Unit Cost of Acquiring a Subscriber
ZAR
2,359
2,148
2,008 2,031
545
520 514
638 Sales and Marketing Opex
305 Non-capitalized
221 226 289
Sales Commission
Capitalized
CapEx
1,814 CapEx CapEx CapEx
1,509 Telematics Devices
1,267 1,488 1,291 1,517 1,510
1,221 Capitalized
FY FY Q3 Q3
2019 2020 FY202 0 FY202 1
36LONG-TERM FINANCIAL GOALS WITHOUT
ADDITIONAL PLATFORM VERTICALS
Reflect our accelerated and aggressive growth strategy
Actual Actual Actual Long-term
FY2019 FY2020 Q3 FY2021 targets(1)
Gross margin 71% 70% 72% 69-72%
Research & development as a % of Subscription Revenue
3% 2% 3% 4-6%
Total capital allocated to Research & development as a %
4% 4% 5% 5-7%
of Subscription Revenue(2)
Sales & marketing as a % of Subscription Revenue 12% 10% 10% 17-19%
General & administrative as a % of Subscription Revenue 29% 24% 23% 12-16%
Operating profit margin 30% 33% 34% 32-36%
Adjusted EBITDA margin % 44% 49% 51% 50-54%
(1) The long-term targets on this slide reflect the company’s long-term goals and are not projections or estimates of future results. The company’s ability to achieve any such long-term targets is subject to various risks and uncertainties.
Accordingly, there are or will be important factors that could cause actual outcomes or results to differ materially from these targets, and there can be no assurance that the company will achieve any such targets within any particular timeframe,
or at all. See slide 2 for further information on forward-looking statements.
37
(2) Refer to pg. 46 for reconciliation of total capital allocated to R&DINVESTMENT HIGHLIGHTS
Large & growing market opportunity with a long runway for sustainable growth
Integrated cloud software platform for enterprises and consumers
(1) (2)
Proven scalability with 1.3M+ subscribers generating 50Bn+ data points per month
Innovative culture with a track record of delivering new applications as customer needs evolve
Multiple levers for expansion that will contribute to sustained growth
Positioned for accelerated growth with consistent strong historical operating & EBITDA margins
Founder-led management team with experience operating as a public company in South Africa
(1) As of February 28 2021 per “Recent Developments” in the F-1 38
(2) For the 6 month period ended January 30, 2021Thank You
Appendix
KEY INCOME STATEMENT METRICS
Reflecting our historical growth trajectory & robust operating metrics

                                                                                                     Q3          Q3
                                                                           FY19        FY20        FY20        FY21

Annual Recurring Revenue ( ZAR ‘000s)                                   1,674,522   2,021,880   2,020,420   2,372,705

Average monthly Revenue per Subscriber (ZAR)                                 148         151         150         153

YoY Subscription Revenue Growth                                            30%(1)        24%        N/A          18%

Gross Margin                                                                 71%         70%         70%         72%

Research & Development as a % of Subscription Revenue                         3%          2%          2%          3%

Sales & Marketing as a % of Subscription Revenue                             12%         10%         10%         10%

General & Administrative as a % of Subscription Revenue                      29%         24%         24%         23%

Operating Profit Margin                                                      30%         33%         33%         34%

Adjusted EBITDA margin                                                       44%         49%         49%         51%

FCF margin                                                                    3%         26%         25%         25%

   (1)Cartrack   Holdings Limited Summarized financial results FY2019                                                   41
FREE CASH FLOW BRIDGE
Q3 Q3
ZAR (000s) FY2019 FY2020 FY2020 FY2021
Revenue 1,693 1,942 1,431 1,675
Subscription revenue 1,521 1,888 1,385 1,635
Cash flow from operations 472 901 665 714
Purchase of PPE (422) (389) (304) (304)
Free cash flow(1) 50 513 361 411
Free cash flow margin 3% 26% 25% 25%
(1)Free
42
cash flow defined as net cash generated from operating activities less purchase of property, plant and equipmentRECONCILIATION OF PROFIT TO ADJUSTED
EBITDA
Q3 Q3
ZAR (‘000) FY19 FY20 FY20 FY21
Profit for the year 361,048 443,526 329 419 394 864
Less: Finance Income (2,749) (2,592) (1,606) (3,852)
Add: Finance Costs 31,438 16,831 14,238 4,833
Add: Taxation 110,182 173,157 126,329 170,130
Add: Depreciation and Amortization 238,515 295,762 219,990 289,065
EBITDA
Add: Corporate - 10,801 10,604 301
Adjusted EBITDA 738,434 937,485 698,974 855,341
43RECONCILIATION OF FREE CASH FLOW & FREE
CASH FLOW MARGIN
Q3 Q3
ZAR (‘000) FY19 FY20 FY20 FY21
Net Cash Generated from Operating Activities 472,258 901,224 664,465 714,234
Less: Purchase of Property, Plant and Equipment (422,061) (388,723) (303,888) (303,719)
Free Cash Flow 50,197 512,501 360,577 410,515
Net Cash Generated from Operating Activities as % of Revenue 27.9% 46.4% 46.4% 42.6%
Less: Purchase of Property, Plant and Equipment as % of revenue 24.9% 20.0% 21.2% 18.1%
Free Cash Flow Margin % 3.0% 26.4% 25.2% 24.5%
44RECONCILIATION OF EBITDA & OPERATING
EXPENSE
Karooooo vs. Cartrack
Q3 Q3
ZAR (‘000) FY2019 FY2020 FY2020 FY2021
EBITDA Karooooo 738,434 926,684 688,370 855,040
Add: Corporate / Karooooo expenses - 10,801 10,604 301
Adjusted EBITDA Cartrack 738,434 937,485 698,974 855,341
EBITDA Margin Karooooo 44% 48% 48% 51%
Adjusted EBITDA Margin Cartrack 44% 48% 49% 51%
Operating Expenses
General & Administration Expenses 443,562 460,402 334,525 371,351
General & Administration Expenses as a % of Subscription Revenue 29.2% 24.4% 24.2% 22.7%
Adjusted for Karooooo Expenses - (10,801) (10,604) (301)
Adjusted General & Administration Expenses 443,562 449,601 323,921 371,050
General & Administration Expenses as a % of Subscription Revenue 29.2% 23.8% 23.4% 22.7%
45RECONCILIATION OF RESEARCH & DEVELOPMENT
CAPITAL ALLOCATION & EXPENSED
Q3
ZAR (M) FY2019 FY2020 FY2021
Subscription Revenue 1,521 1,888 1,635
R&D: Operating Expenses 48.3 44.9 54.2
R&D: Capitalized 13.6 31.2 30.9
Total Capital Allocated to R&D 61.9 76.1 85.1
Total R&D Capital Allocated as a % of Subscription Revenue 4% 4% 5%
R&D: Operating Expenses 48.3 44.9 54.2
R&D: Amortization of Capitalized R&D included in G&A - 9.2 16.2
Total R&D Expensed 48.3 54.1 70.4
Total R&D Expensed as a % of Subscription Revenue 3% 3% 4%
46You can also read


