Company Update June 2021 - VEB

Page created by Benjamin Jennings
 
CONTINUE READING
Company Update June 2021 - VEB
Company Update

                                      June 2021

1 | June 2021 | Company Update
Company Update June 2021 - VEB
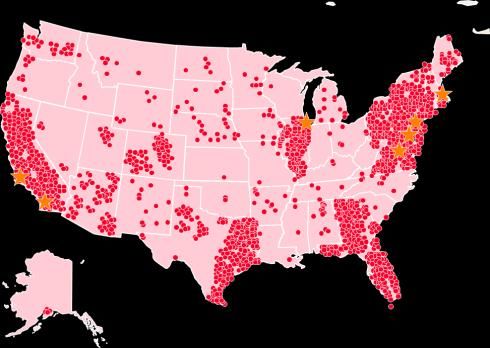
Grubhub transaction highlights

                                             ▪ Just Eat Takeaway.com N.V. (“JET”) completed the acquisition of 100% of the shares of Grubhub Inc. (“GRUB”) on 15 June 2021

  Key Terms
                                             ▪ GRUB shareholders have received JET ADSs representing 0.6710 JET shares in exchange for each GRUB share, representing $75.15 for
                                                  each GRUB share1 and implying a total equity consideration1 of $7.5 billion
                                             ▪ GRUB shareholders own JET ADSs representing approximately 30% of JET's issued share capital as at completion2

  Board and                                  ▪ Matt Maloney, founder of GRUB, appointed to the JET Management Board3
  Management                                 ▪ David Fisher and Lloyd Frink, former GRUB Directors, appointed to the JET Supervisory Board3

                                             ▪ Headquartered and domiciled in Amsterdam, the Netherlands

  HQ and Listing
                                             ▪ Headquarters for GRUB will remain in Chicago, US
                                             ▪ JET is listed on Euronext Amsterdam and on the Main Market of the London Stock Exchange and has introduced an ADS listing on Nasdaq.
                                                  A period of time will be taken to determine the optimal listing venues for JET’s long term future

                                             ▪ We intend to publish a Q2 Trading Update on 15 July, followed by our H1 results in mid-August
  Next steps
                                             ▪ In October, we intend to hold an Investor Day where we will provide more details on the proposed strategy for the Combined Group going forward

1. Based on the undisturbed closing price of Just Eat Takeaway.com on 9 June 2020 of €98.60, converted to USD from EUR at an exchange rate of 1.13585, as per 9 June 2020
2. On a fully diluted basis
3. Appointment to take effect upon formal acceptance thereof

   2 | June 2021 | Company Update
Company Update June 2021 - VEB
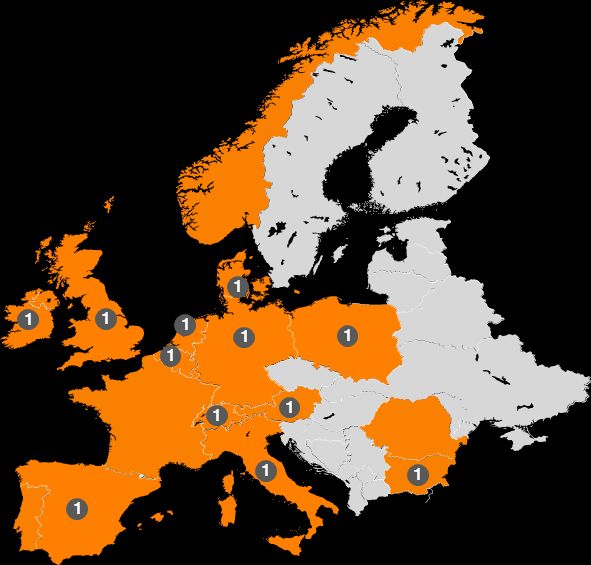
About Just Eat Takeaway.com

3 | June 2021 | Company Update
Just Eat Takeaway.com leverages powerful network effects
                                                                                                                                                                     15.2
                                                                                                          60m                                                   Orders per year
                                                                                                          Active                                                 per Returning
                                                                                                        Consumers                                              Active Consumer

                                                 New Consumers                                              More                                                 More Orders per
                                                                                                          Consumers                                                Consumer
                                               Consumers place order
                                                (and make payment)

                                                                                                                                    Network Effects
                                                                                                                               Our powerful network effects
                                                                                                                                 fuel our ability to attract
                                                                                                                                  more new consumers,
                                                                                                                                compounding our growth

                                                                                                             More
                                                New Restaurants                                           Restaurants                                             More Orders
                                              Just Eat Takeaway.com
                                                  transmits order
                                                                                                           244k                                                     588m
                                                                                                        Restaurants                                                 Orders
Note: Numbers represent FY 2020, presented on the basis of the combined results of Just Eat and Takeaway.com from 1 January 2019 and excluding Grubhub

   4 | June 2021 | Company Update
With a large and growing active consumer base and high re-order frequency

  Stable cohorts result in highly predictable revenues                                                                                     Majority of orders from existing cohorts
  Cumulative orders per consumer by monthly                                 cohort1                                                        Order split by cohort1
                                                                                                                                                                                                                                  +175m
                                                                                                                                                                                                                                                 588m

                                                                                                                                                                                                           +103m                                                2020
                                                                                                      2020                                                                                                                 413m
                                                                                                                                                                                                                                                                2019
                                                                                                      2019
                                                                                                                                                                                                                                                                2018
                                                                                                                                                                                       +72m
                                                                                                      2018                                                                                           310m                                                       2017
                                                                                                      2017                                                       +55m                                                                                           2016
                                                                                                                                                                               238m
                                                                                                      2016
                                                                                                                                                                                                                                                                2015
                                                                                                      2015                                               183m
                                                                                                                                                                                                                                                                2014
                                                                                                      2014
                                                                                                                                                                                                                                                                2013
                                                                                                      2013
                                                                                                                                                                                                                                                                2012
                                                                                                      2012
                                                                                                                                                                                                                                                                Pre 2012

      0       12         24          36       48            60        72         84       96                                                              2016                  2017                  2018                  2019                  2020
                                             Months

1. Cohort refers to consumers grouped by the calendar year in which they each first placed an order with Just Eat Takeaway.com. Numbers presented on the basis of the combined results of Just Eat and Takeaway.com from 1 January 2016 and excluding Grubhub
Source: Company information

   5 | June 2021 | Company Update
Just Eat Takeaway.com maintains an online food delivery share of ~70%
in its European #1 markets1

  Leading online player in major European markets1                                                                                                     Supported by our top-of-mind brand position in Europe2
                                                                                                                                                       Brand awareness in selected European markets, sorted by population

        JET’s online share is
                                                                                                                                                       70%
         multiple times larger
        than the European #2                                                                                                                           60%
           in its #1 markets,
       which contribute >95%                                                                                                                           50%
          of European GMV1
                                                                                                                                                       40%

                                                                                                                                                       30%
                                                                        1
                                       1          1             1                                                                                      20%
                                                                        1              1
                                                            1
                                                                                                                                                       10%
                                                                    1           1
                                                                                                                                                       0%
                                                                            1                                                                                UK    DE     IT    ES     PL     NL    BE   CH   DK   IE
                                                                                                  1
                                              1

                                                                                                                                                                          Just Eat Takeaway.com    #2    #3
Source:
1. Based on SimilarWeb site analysis data – Total visits for the stated websites for the period January 2020 to April 2021
2. Company Analysis using weekly panels (over 30k responses) for March 2021 with the open question “whom do you think of when ordering food online?”

   6 | June 2021 | Company Update
There is significant penetration upside in our markets

  Population aged 15+                         15m                                 32m                      55m                 72m                   268m           283m               724m

                                100%

                                                               37%

                                                                                                                 29%

                                                                                                     17%                                 17%
                                                                                                                                                            12%                                   13%
                                                                                                                                                                                7%

                                         Netherlands                            Canada                     UK                Germany                  US          Rest of the        JET + GRUB
                                                                                                                                                                    World               Total

                                                                                                                       JET + GRUB Active Consumers

Source: Population estimates as presented by local statistical bureaus for each individual country

    7 | June 2021 | Company Update
Proven track record of building
                         leading positions in markets of scale

8 | June 2021 | Company Update
Strong results from investment programme in the UK

  Orders (m)

                                               +96%
                                                                              64              •   Results of investment programme clearly visible in the United Kingdom
                                                             56
                                                                                              •   96% YoY order growth in Q1 2021
                                                 46
                             44                                                               •   695% order growth in Delivery in same period
                                                                              41
             33                                              42                               •   Triple digit YoY order growth in London in Q1 2021

                                                 40                                           •   Scoober launched in London, Birmingham, Liverpool and Brighton
                             41
             30
                                                                                              •   New partnerships signed with leading brands
                                                                              23      +695%
                                                             14
              3                  3               7
         Q1 2020          Q2 2020            Q3 2020      Q4 2020           Q1 2021

                                     Marketplace Orders   Delivery Orders

9 | June 2021 | Company Update
We are widening the absolute gap with the competition

     Relative credit card transactions1                                                         Absolute credit card transactions1                                                               Absolute gap between Just Eat UK and competitors1
     #2 & #3 include grocery and whitelabel orders                                              #2 & #3 include grocery and whitelabel orders                                                   #2 & #3 include grocery and whitelabel orders

                                                                                                                                                                      45m                               25000000

                                                                         20%
                                                                                                                                                                            9m
                                                                                                                                                                                                        20000000

                                                                                                                                                                                                                                                         Gap
                                                                                                                                                                                                                                                         widening
                                                                         28%                                                                                                                                                                             rapidly
                                                                                                                                                                            13m
                                                                                                                                                                                                        15000000

                                                                         52%
                                                                                                                                                                                 9m Delivery            10000000

                                                                                                                                                                                 Orders

                                                                                                                                                                            23m                          5000000

                                                                                                                                                                                                               0

 Jan-20                        Jul-20                       Jan-21                            Jan-20                       Jul-20                       Jan-21                                             Jan-20              Jul-20           Jan-21

                                                                                                                                          #2       #3

                                                                                                                     Entered in Jun-16           Entered in Feb-13

Source:
1. Credit card transaction volumes measured by Cardlytics credit card transactions supplemented with cash orders for the period January 2020 to April 2021, with transaction volumes for all competitors scaled

   10 | June 2021 | Company Update
And rapidly gaining online food delivery share in London

      Relative credit card transactions1
      #2 & #3 include grocery and whitelabel orders

50%

                                                                                                                                                            Online food delivery share gains in London driven by:
40%
                                                                                                                               36%                          •      Closing restaurant supply gap on both chains and local heroes
                                                                                                                               35%
30%
                                                                                                                               29%
                                                                                                                                                            •      Increased roll-out of employed delivery model throughout the city

                                                                                                                                                            •      Enhanced top-of-mind brand awareness thanks to increasing
20%                                                                                                                                                                volume of fully clothed and branded couriers in the streets
                    Start of
                  investment
                  programme
10%                  in Q3

 0%
         Jul-20                                                             Jan-21                                        May-21

Source:
1. Credit card transaction volumes measured by Cardlytics credit card transactions supplemented with cash orders for the period July 2020 to May 2021, whereby London is defined as all area within the M25

   11 | June 2021 | Company Update
We outgrow our online competition in all other key markets
                        Germany                                                                                                       Canada                                                                                                        Netherlands

Google trends web search interest1
  Skewed towards new user addition

                                                           3%
                                                                                                                                                                                                                                                                                5%
                                                                                                                                                                   16%
                                                                                                                                                                                                                                                                               15%
                                                                                                                                                                   31%
                                                          97%
                                                                                                                                                                                                                                                                               80%
                                                                                                                                                                   53%

Jan-20                                  Jan-21                                                         Jan-20                                    Jan-21                                                               Jan-20                                    Jan-21

Indicative absolute monthly orders2
  Based on SimilarWeb visits

                                                                                                                                                                       Gap
                                                                                                                                                                       expanding
                                                                                                                                                                                                                                                                                  Gap
                                                                Gap                                                                                                                                                                                                               growing
                                                                growing                                                                                                                                                                                                           fast
                                                                rapidly

 Jan-20                                Jan-21                                                            Jan-20                                Jan-21                                                                    Jan-20                                 Jan-21

                                          #2                                                                                                  #2          #3                                                                                                   #2        #3

                                  Entered in Aug-20                                                                      Entered in May-15           Entered in Nov-15                                                                     Entered in Sep-16        Entered in Sep-15
Source:
1. Google Trends for the period January 2004 up to and including May 2021, extracted on 14 June 2021
2. Based on SimilarWeb site analysis data for desktop and mobile web – Total visits for the stated websites for the period January 2020 to May 2021. Competition assumed to have similar visits to orders ratio as Just Eat Takeaway.com

    12 | June 2021 | Company Update
We also outgrow online competition in other important food delivery markets
                        Australia                                                                                                     Poland                                                                                                Italy

Google trends web search interest1
  Skewed towards new user addition

                                                                                                                                                                     4%
                                                                                                                                                                    16%
                                                          7%                                                                                                                                                                                                             9%
                                                          10%                                                                                                       14%
                                                                                                                                                                                                                                                                        20%
                                                          38%
                                                                                                                                                                                                                                                                        24%
                                                                                                                                                                    66%
                                                          45%                                                                                                                                                                                                           47%

Jan-20                                  Jan-21                                                         Jan-20                                    Jan-21                                                               Jan-20                          Jan-21

Indicative absolute monthly orders2
  Based on SimilarWeb visits

                                                              Gap
                                                              widening                                                                                                  Clearly                                                                                            Gap
                                                              rapidly                                                                                                   outgrowing                                                                                         widening
                                                                                                                                                                        competition                                                                                        quickly

 Jan-20                                Jan-21                                                            Jan-20                                 Jan-21                                                                  Jan-20                       Jan-21

                               #2       #3       #4                                                                                     #2       #3       #4                                                                                   #2      #3      #4

   Entered in Apr-16         Entered in Sep-19          Entered in Nov-15                                   Entered in Feb-18         Entered in Jan-10          Entered in Dec-18                                    Entered in Oct-15    Entered in Mar-16        Entered in Oct-16
Source:
1. Google Trends for the period January 2004 up to and including May 2021, extracted on 14 June 2021
2. Based on SimilarWeb site analysis data for desktop and mobile web – Total visits for the stated websites for the period January 2020 to May 2021. Competition assumed to have similar visits to orders ratio as Just Eat Takeaway.com

    13 | June 2021 | Company Update
Our stake in iFood is continuing to increase in value

  A highly attractive and fast-growing asset…                                                #1 online food delivery
  •       ~80% online food delivery share in the Brazil market1                              company in Brazil…
  •       Heavily urbanised population with rapid market growth
  •       Over 1,000 cities and 235,000 restaurants in Brazil alone

  …with significant value to Just Eat Takeaway.com
  •       As a non-operated asset, iFood provides optionality to
          realise value in case an offer at fair value is received
  •       In case of a disposal, approximately half of the net proceeds
          intended to be returned to shareholders
                                                                                             …doubling orders and more than doubling GMV in 2020

                                                                                                         Orders                    GMV (€bn)
                         Ownership structure
                                                                                                         +100%                         +134%
                                                           Just Eat                                               478                          3.6
                                                        Takeaway.com
                                                            33%
                      Prosus                                                                      239                            1.5
                       62%
                                                       Other
                                                       Movile
                                                        5%                                        2019            2020          2019           2020
Note: Numbers represent FY 2020 numbers
1. Management estimate based on user web and app traffic, number of sessions and downloads

      14 | June 2021 | Company Update
The pro-forma JET + GRUB company

15 | June 2021 | Company Update
What is JET + GRUB?

                           The #1 food delivery platform in Europe, Israel, Australia and Canada1

                           Strong entry point into the US market through the acquisition of Grubhub

                           The only player with a proven hybrid model, offering the broadest selection and best price/value proposition to consumers

                           Sizeable and efficient logistics operations, outgrowing direct competitors

                           A uniquely positioned B2B offering across key food delivery markets

1. In terms of orders, GMV and revenue

   16 | June 2021 | Company Update
Creation of one of the world’s largest online food delivery companies

                                                                                                                                                               24
                                                                                                             Europe                                       Countries
                                                                                           Market
                                                                                                             Market
                                                                                           leader
                                                                                                             leader
                                                                                                                                                          >500k
                                                                                                                                                      Restaurants1,2

                    Americas                                                                                                                                 91m
                                                                                                                                                            Active
                                                                                                                                                       Consumers1
 Leading positions in                                                                               Market
   North America,                                                                                   leader                                               >720m
 Europe and Australia                                                                                                               Australia &        Addressable
                                                                                                                                   New Zealand
                                                                                                                                                       population1,3
                                                                                                                                             Market
                                                                                                                                             leader

Notes: Light shaded orange colour indicates iFood equity stake
                                                                                                                          Israel                            13%
                                                                                                                      Market
Numbers represent FY 2020, presented on the basis of the
combined results of Just Eat and Takeaway.com from 1 January 2020                                                     leader                          Penetration1,4
1. Excluding Colombia and Brazil
2. Partnered restaurants only (for which there is a contract)
3. Addressable population aged over 15 years
4. Represents total active consumers as a proportion of the total addressable population

   17 | June 2021 | Company Update
Founder-led management team, with a proven track record of building
leading positions in markets of scale

                 Jitse Groen                                         Matt Maloney1         Brent Wissink                         Jörg Gerbig
                          CEO                                          North America             CFO                                   COO
         Founded Takeaway.com                                        Founded Grubhub      Joined Takeaway.com                Founded Lieferando.de
                 2000                                                     2004                    2011                              2009

                     55+ years                of combined experience in food delivery
                                                                                        Proven track record      of building leading   positions
                                                                                                           in markets of scale

                         Founders of Takeaway.com,                   Grubhub,             Track record of successful
                                                                                                              execution of M&A,
                  Lieferando                  and Pyszne still active in the company    integration programmes and capital markets

Source: Company information
1. Appointment to take effect upon formal acceptance thereof

   18 | June 2021 | Company Update
JET + GRUB operates at scale with proven profitability potential

  FY 2020 pro forma figures for the combined Group

                        Orders                                                                  GMV                                            Revenue   Adj. EBITDA
                         816m                                                             €20.5bn                                              €4.0bn      €352m
                                                                                             $23.4bn                                            $4.6bn     $401m

  Q1 2021

                        267m                                                                €6.8bn
                                                                                              $7.7bn

Note: Numbers are presented on the basis of the combined results of Just Eat Takeaway.com and Grubhub per FY 2020 for illustrative purposes.
Grubhub financials prepared under US GAAP and converted to EUR from USD at an average exchange rate of 0.8768, as per 31 December 2020

   19 | June 2021 | Company Update
About Grubhub

20 | June 2021 | Company Update
Grubhub is uniquely positioned within the US food delivery market
                                                                                                                                                              Restaurant-focused offering

                                                                                                                                                                 >280,000 partner restaurants as per Q1

                                                                                                                                                                 >4,000 cities

                                                                                                                                                                 Leading corporate and campus product

                                                                                                                                                                 Comprehensive loyalty / marketing program tools

                                                                                                                                                                 Robust direct POS integrations

                                                                                     Tier 1 Cities1
                                                                                     Tier 2 & 3 Cities2                                                          Grubhub Direct – no commission online ordering

Source: Company information
1. Tier 1 represents markets launched prior to 2012, and include Boston, Chicago, Los Angeles, New York City, Philadelphia, San Francisco and Washington DC
2. Tier 2 represents markets launched in 2012, and Tier 3 represents all other markets

   21 | June 2021 | Company Update
Strong financial performance in FY20, despite Covid-19 headwinds in
New York and corporate business
    Orders (m)1                                                                                        GMV (€bn)2                                                             Revenue (€bn)

             +27%                                                                                               +47%                                                               +39%

                      228                                                                                                7.6                                                            1.6

        180
                                                                                                                                                                                1.2
                                                                                                            5.2

                                                      +43%                                                                                            +60%                                                +52%

                                                              67                                                                                            2.3                                                0.5
                                                 47                                                                                                 1.4                                                0.3

     FY 2019 FY 2020                        Q1 2020 Q1 2021                                             FY 2019 FY 2020                           Q1 2020 Q1 2021             FY 2019 FY 2020        Q1 2020 Q1 2021

                Accelerating organic growth rates from 2020 to Q1 2021                                                                          110bps impact of fee caps on take rate expected to reverse in 2021

Note: Grubhub financials prepared under US GAAP and converted to EUR from USD at an average exchange rate of 0.8768, as per 31 December 2020.
1. Orders calculated by multiplying the Daily Average Grubs by the number of days in a given period
2. Based on Grubhub’s Gross Food Sales definition

   22 | June 2021 | Company Update
We intend to align the US strategy with our successful European strategy

Intend to apply similar strategy as in Europe, with focus on profit pool geographies and creating a bigger “moat”

Observations
•     Grubhub is one of the largest food delivery websites in the US, but it is not the leader everywhere
•     Removal of fee caps to positively impact profitability
•     Offices reopening, relevant to B2B offering (Seamless and Grubhub for Work)

Strategy
•     Refocus - expand the Grubhub strongholds;
      focus will be less on the whole country
•     Seamless to transition to Grubhub, in line with our
      single brand strategy
•     We intend to share further strategic updates
      with regards to the US in the course of H2 2021

 23 | June 2021 | Company Update
Next steps

  •       Q2 trading update            15 July

  •       H1 results                   mid-August

  •       Investor day                 October 2021

Note: Dates can be subject to change

   24 | June 2021 | Company Update
Legal disclaimer

NOT FOR RELEASE, PRESENTATION, PUBLICATION OR DISTRIBUTION IN WHOLE OR IN PART IN, INTO OR FROM ANY JURISDICTION WHERE TO DO SO WOULD CONSTITUTE A VIOLATION OF THE RELEVANT LAWS OR REGULATIONS OF
SUCH JURISDICTION.

This presentation has been prepared by Just Eat Takeaway.com N.V. (“Just Eat Takeaway.com”) and Grubhub Inc. (“Grubhub”) in connection with the acquisition of Grubhub by Just Eat Takeaway.com in an all-stock transaction (the “Merger”).
These slides do not purport to contain all the information that may be necessary or desirable to fully and accurately value Just Eat Takeaway.com, Grubhub or the business prospects of the Merger. The information set out in this presentation is
not intended to form the basis of any contract. By attending (whether in person, by telephone or webcast) this presentation or by reading the presentation slides, you agree to the conditions set out below. You should conduct your own
independent analysis of Just Eat Takeaway.com and Grubhub, including consulting your own independent advisers in order to make an independent determination of the suitability, merits and consequences of any investment. You should not
base any behaviour in relation to financial instruments related to Just Eat Takeaway.com’s or Grubhub’s securities or any other securities and investments on information contained in this presentation until after such information is made
publicly available by Just Eat Takeaway.com or Grubhub or any of their advisers. Any dealing or encouraging others to deal on the basis of such information may amount to insider dealing under the Criminal Justice Act 1993 and/or market
abuse under the Market Abuse Regulation (and/or, as applicable, such regulation as it forms part of the domestic UK law by virtue of section 3 of the European Union (Withdrawal) Act 2018 as amended from time to time).

None of Just Eat Takeaway.com, Grubhub, or any of their respective shareholders, subsidiaries, affiliates, associates, or their respective directors, officers, partners, employees, representatives and advisers (the “Relevant Parties”) makes any
representation or warranty, express or implied, as to the accuracy or completeness of the information contained in this presentation, or otherwise made available, nor as to the reasonableness of any assumption contained herein or therein,
and any liability therefor (including in respect of direct, indirect, consequential loss or damage) is expressly disclaimed. Nothing contained herein or therein is, or shall be relied upon as, a promise or representation, whether as to the past or
the future and no reliance, in whole or in part, should be placed on the fairness, accuracy, completeness or correctness of the information contained herein or therein. This presentation includes only summary information and does not purport
to be comprehensive. The information contained in this presentation has not been independently verified. Further, nothing in this presentation should be construed as constituting legal, business, tax, actuarial, financial or other specialist
advice. None of the Relevant Parties has independently verified the material in this presentation. No statement in this presentation (including any statement of estimated synergies) is, nor is any intended to be a profit forecast or estimate for
any period and no statement in this presentation should be interpreted to mean that cash flow from operations, free cash flow, earnings, earnings per share or income on a clean current cost of supplies basis for Just Eat Takeaway.com or
Grubhub, for the current or future financial years would necessarily match or exceed the historical published cash flow from operations, free cash flow, earnings, earnings per share or income on a clean current cost of supplies basis for Just Eat
Takeaway.com or Grubhub, as appropriate.

Statements of estimated cost savings and synergies relate to future actions and circumstances which, by their nature, involve risks, uncertainties and contingencies. As a result, the cost savings and synergies referred to may not be achieved,
may be achieved later or sooner than estimated, or those achieved could be materially different from those estimated. No statement in this presentation should be construed as a profit forecast or interpreted to mean that the combined
group's earnings in the first full year following implementation of the Merger, or in any subsequent period, would necessarily match or be greater than or be less than those of Just Eat Takeaway.com or Grubhub for the relevant preceding
financial period or any other period. As a result of rounding, the totals of data presented in this presentation may vary slightly from the actual arithmetic totals of such data.

The companies in which Just Eat Takeaway.com directly and indirectly owns investments are separate entities. In this presentation “Just Eat Takeaway.com” is sometimes used for convenience where references are made to Just Eat
Takeaway.com and its legacy subsidiaries in general. Likewise, the words “we”, “us” and “our” are also used to refer to subsidiaries in general or to those who work for them. These expressions are also used where no useful purpose is served by
identifying the particular company or companies. Similar references are made to “Grubhub” with similar logical application.

Just Eat Takeaway.com is a Dutch company subject to Dutch and UK procedural and disclosure requirements that are different from those of the U.S. Certain financial statements or other information included in this presentation may have
been prepared in accordance with non-U.S. accounting standards that may not be comparable to the financial statements of U.S. companies or companies whose financial statements are prepared in accordance with generally accepted
accounting principles in the U.S.

 25 | June 2021 | Company Update
Legal disclaimer (continued)

Forward Looking Statements
This presentation contains “forward-looking statements” regarding Grubhub, Just Eat Takeaway.com or their respective management’s future expectations, beliefs, intentions, goals, strategies, plans and prospects, which are made in reliance on
the “safe harbor” provisions of the U.S. Private Securities Litigation Reform Act of 1995. Forward-looking statements involve substantial risks, known and unknown, uncertainties, assumptions and other factors that may cause actual results,
performance or achievements to differ materially from future results expressed or implied by such forward-looking statements including, but not limited to, difficulties and delays in integrating Grubhub’s and Just Eat Takeaway.com’s
businesses; risks that the merger disrupts Grubhub’s or Just Eat Takeaway.com’s current plans and operations; failing to fully realize anticipated synergies, cost savings and other anticipated benefits of the merger when expected or at all;
potential adverse reactions or changes to business relationships resulting from completion of the merger; the risk that unexpected costs will be incurred; the ability of Grubhub or Just Eat Takeaway.com to retain and hire key personnel; the
diversion of management’s attention from ongoing business operations; uncertainty as to the long-term value of the ordinary shares of Just Eat Takeaway.com; the continued availability of capital and financing following the merger; the
outcome of any legal proceedings that may be instituted against Grubhub, Just Eat Takeaway.com or their respective directors and officers; changes in global, political, economic, business, competitive, market and regulatory forces; changes in
tax laws, regulations, rates and policies; future business acquisitions or disposals; competitive developments; and the timing and occurrence (or non-occurrence) of other events or circumstances that may be beyond Grubhub’s and Just Eat
Takeaway.com’s control. These and other risks, uncertainties, assumptions and other factors may be amplified or made more uncertain by the COVID-19 pandemic, which has caused significant economic uncertainty. The extent to which the
COVID-19 pandemic impacts Grubhub’s and Just Eat Takeaway.com’s businesses, operations and financial results, including the duration and magnitude of such effects, will depend on numerous factors, which are unpredictable, including, but
not limited to, the duration and spread of the outbreak, its severity, the actions taken to contain the virus or treat its impact, and how quickly and to what extent normal economic and operating conditions can resume. Forward-looking
statements generally relate to future events or Grubhub and Just Eat Takeaway.com’s future financial or operating performance and include, without limitation, statements relating to the merger and the potential impact of the COVID-19
outbreak on Grubhub and Just Eat Takeaway.com’s business and operations. In some cases, you can identify forward-looking statements because they contain words such as “anticipates,” “believes,” “contemplates,” “could,” “seeks,” “estimates,”
“intends,” “may,” “plans,” “potential,” “predicts,” “projects,” “should,” “will,” “would” or similar expressions and the negatives of those terms.

While forward-looking statements are Grubhub’s and Just Eat Takeaway.com’s current predictions at the time they are made, you should not rely upon them. Forward-looking statements represent Grubhub’s and Just Eat Takeaway.com’s
management’s beliefs and assumptions only as of the date of this presentation , unless otherwise indicated, and there is no implication that the information contained in this presentation is made subsequent to such date. For additional
information concerning factors that could cause actual results and outcomes to differ materially from those expressed or implied in the forward-looking statements, please refer to the cautionary statements and risk factors included in
Grubhub’s filings with the Securities and Exchange Commission (the “SEC”), including Grubhub’s Annual Report on Form 10-K filed with the SEC on February 28, 2020, Grubhub’s Quarterly Reports on Form 10-Q and any further disclosures
Grubhub makes in Current Reports on Form 8-K. Grubhub’s SEC filings are available electronically on Grubhub’s investor website at investors.grubhub.com or the SEC’s website at www.sec.gov. For additional information concerning factors that
could cause future results to differ from those expressed or implied in the forward-looking statements, please refer to Just Eat Takeaway.com’s non-exhaustive list of key risks and cautionary statements included in Just Eat Takeaway.com’s
Annual Report, which is available electronically on Just Eat Takeaway.com’s investor website at https://www.justeattakeaway.com. Except as required by law, Grubhub and Just Eat Takeaway.com assume no obligation to update these forward-
looking statements or this presentation, or to update, supplement or correct the information set forth in this presentation or the reasons actual results could differ materially from those anticipated in the forward-looking statements, even if
new information becomes available in the future. All subsequent written and oral forward-looking statements attributable to Grubhub, Just Eat Takeaway.com or any person acting on behalf of either party are expressly qualified in their entirety
by the cautionary statements referenced above.

No Offer or Solicitation
This presentation shall not constitute an offer to sell or the solicitation of an offer to sell or the solicitation of an offer to buy any securities, nor shall there be any sale of securities in any jurisdiction in which such offer, solicitation or sale would
be unlawful prior to registration or qualification under the securities laws of any such jurisdiction. No offer of securities shall be made except by means of a prospectus meeting the requirements of Section 10 of the Securities Act of 1933, as
amended and applicable United Kingdom, Dutch and other European regulations.

Non-GAAP Financial Measures and Alternative Performance Measures
This presentation includes certain non-GAAP financial measures as defined by SEC rules and alternative performance measures as defined by European rules. Each of Grubhub and Just Eat Takeaway.com uses these non-GAAP financial
measures and alternative performance measures, respectively, as key performance measures because each believes they facilitate operating performance comparisons from period to period by excluding potential differences primarily caused
by variations in capital structures, tax positions, the impact of acquisitions and restructuring, the impact of depreciation and amortization expense on its fixed assets and the impact of stock-based compensation expense. These non-GAAP
financial measures and alternative performance measures are not measurements of Grubhub's financial performance under GAAP nor of Just Eat Takeaway's financial performance under IFRS and should not be considered as an alternative to
performance measures derived in accordance with GAAP and IFRS, as applicable. Each of Grubhub and Just Eat Takeaway.com has provided a reconciliation of those measures to the most directly comparable GAAP and IFRS measures,
respectively, which are available in Grubhub’s 2020 Annual Report on Form 10-K and in Just Eat Takeaway.com's 2020 Annual Report, respectively.

 26 | June 2021 | Company Update
You can also read