PALADIN ENERGY LTD BMO Capital Markets - 27th Global Metals & Mining Conference
←
→
Page content transcription
If your browser does not render page correctly, please read the page content below
PALADIN ENERGY LTD
BMO Capital Markets
27th Global Metals & Mining Conference
                                         12 December, 2016
Hollywood, Florida, February 25-28

Alexander Molyneux                       Private and Confidential
Chief Executive Officer

                                                      Paladin Energy   |   Company Update   |   0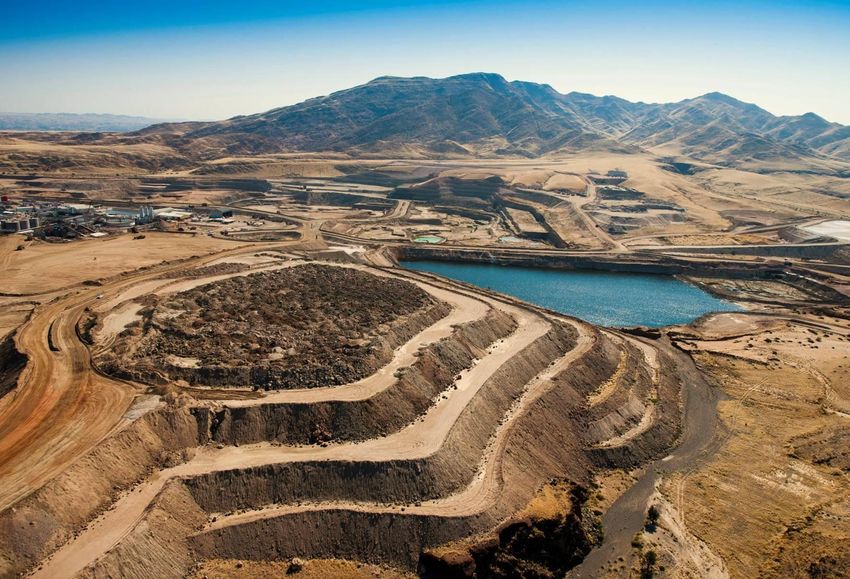
Disclaimer and Notes for JORC and NI 43-101 Mineral Resources
      and Ore Reserves

This presentation includes certain statements that may be deemed “forward-looking statements”. All statements in this presentation, other than statements of historical facts, that
address future production, reserve or resource potential, exploration drilling, exploitation activities and events or developments that Paladin Energy Ltd (the “Company”) expects to
occur, are forward-looking statements.

Although the Company believes the expectations expressed in such forward-looking statements are based on reasonable assumptions, such statements are not guarantees of
future performance and actual results or developments may differ materially from those in the forward-looking statements. Factors that could cause actual results to differ
materially from those in forward looking statements include market prices, exploitation and exploration successes, and continued availability of capital and financing and general
economic, market or business conditions.

Investors are cautioned that any such statements are not guarantees of future performance and actual results or developments may differ materially from those projected in the
forward-looking statements. Readers should not place undue reliance on forward-looking information. The Company does not assume any obligation to update or revise its
forward-looking statements, whether as a result of new information, future events or otherwise.

In the following presentation, for those deposits that are reported as conforming to the Joint Ore Reserves Committee (JORC) 2004 or 2012 code, the terms Inferred Mineral
Resources, Indicated Mineral Resources, Measured Mineral Resources, Ore Reserves, Proved Ore Reserves, Probable Ore Reserves and Competent Person are equivalent to
the terms Inferred Mineral Resources, Indicated Mineral Resources, Measured Mineral Resources, Mineral Reserves, Proven Mineral Reserves, Probable Mineral Reserves and
Qualified Person, respectively, used in Canadian National Instrument 43-101 (NI 43-101).

The technical information in this presentation that relates to Exploration Results, Mineral Resources and Ore Reserves is based on information compiled by David Princep B.Sc.
and Stephanie Raiseborough B.E., both of whom are Fellows of the Australasian Institute of Mining and Metallurgy. Mr. Princep and Ms. Raiseborough each have sufficient
experience that is relevant to the style of mineralisation and type of deposit under consideration and to the activity that they are undertaking to qualify as Competent Persons as
defined in the 2012 Edition of the “Australasian Code for Reporting of Exploration Results, Mineral Resources and Ore Reserves”, and as Qualified Persons as defined in NI 43-
101. Mr. Princep and Ms. Raiseborough consent to the inclusion of the relevant information in this announcement in the form and context in which it appears.

Some of the information in this presentation, in relation to the mineral resources and ore reserves for all deposits except Manyingee and Michelin, was prepared and first disclosed
under the JORC Code 2004. It has not been updated since to comply with JORC Code 2012 on the basis that the information that the estimates are derived from has not
materially changed since it was last reported.

                                                                                                                                                   Paladin Energy      |     Company Update   |   1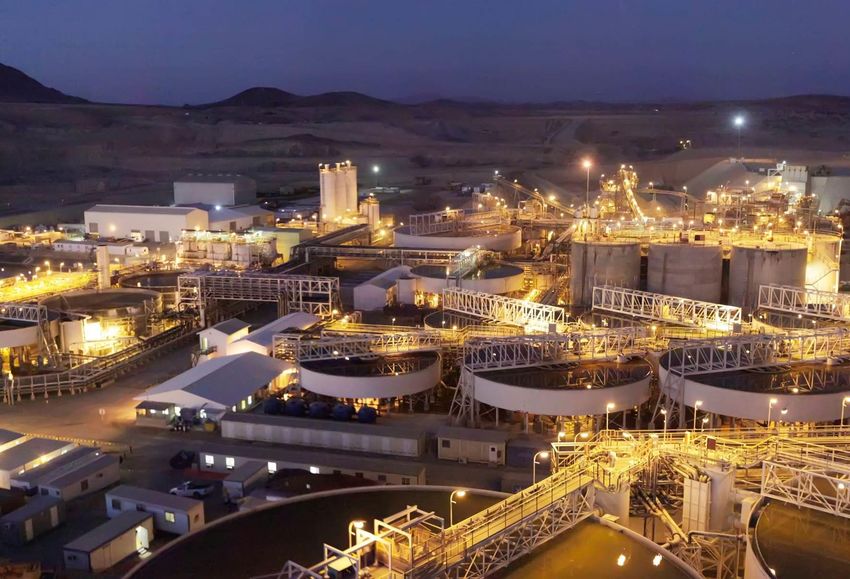
Paladin

                 A GLOBAL URANIUM LEADER

      OWNS LANGER HEINRICH A STRATEGIC TIER ONE MINE

          BALANCE SHEET STRENGTH AND FLEXIBILITY

          BEST SENIOR LEVERAGE TO URANIUM UPSIDE

                                              Paladin Energy   |   Company Update   |   2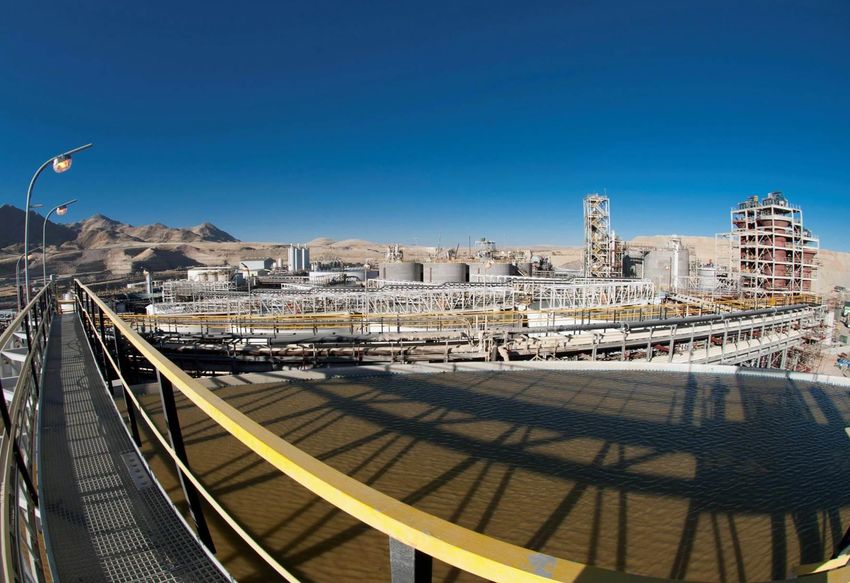
Global Uranium Leader
Resources (measured, indicated
and inferred, mlbs) Production capacity (mlbs)1
1,023
28 27
889
23
758
611
447 12
344 10
8
271
6
89 85 84 77 58
18
Uranium One
Kazatomprom
Cameco
BHP Billiton
Areva
Rio Tinto
Paladin
Bannerman
Berkeley
Penninsula Energy
Deep Yellow
Toro
Areva
Kazatomprom
Paladin
ARMZ / Uranium One
Cameco
Vimy Resources
Boss Resources
Rio Tinto
ARMZ /
Namibia
Malawi
Malawi
Namibia
Undeveloped projects Attributable Reserves and Resources Resources and Reserves shown on the map represent
Proved + Probable 85.7mlb U3O8 100% of the Resource of Reserve – not the participant's
Langer Heinrich (75%) Measured + Indicated 248.7mlb U3O8 share, and are depleted for mining where appropriate
Kayelekera (85%) Inferred 112.1mlb U3O8
Source: Company filings
Note: Paladin Energy | Company Update | 3
1. Paladin figure based on attributable total production capacity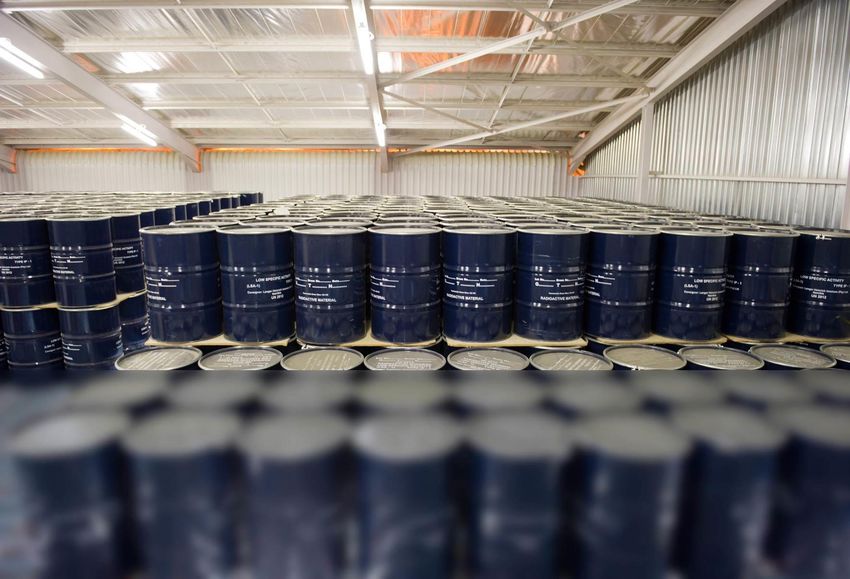
Langer Heinrich A Strategic Tier One Mine

                              First Quartile
                                  All-in Cash Cost1
                          Lowest cost open-pit mine globally1

                         Top 10 Uranium Mine
                                          2
                            by Production
                                       4th largest open-pit

                                                                                   Mineral Resources depleted to 30th June 2017
                                                                               3
                         +20 Year Mine Life                                        Class
                                                                                   Measured
                                                                                   Indicated
                                                                                                  Tonnes Mt
                                                                                                        60.7
                                                                                                        21.5
                                                                                                                 Grade ppm
                                                                                                                        513
                                                                                                                        459
                                                                                                                                Metal Mlb
                                                                                                                                    68.72
                                                                                                                                    21.72
                                                                                   Total M+I            82.2            499         90.44
                                                                                   Inferred              8.7            468          8.98
                                                                                   Stockpiles           33.9            381         28.47

                                        42.4mlb                                    Mineral Reserves depleted to 30th June 2017
                                                                                   Class
                                                                                   Proved
                                                                                                  Tonnes Mt
                                                                                                        42.0
                                                                                                                 Grade ppm
                                                                                                                        524
                                                                                                                                Metal Mlb
                                                                                                                                    48.49
                                  Cumulative production                            Probable             13.1            485         14.03
                                                                                   Stockpiles           33.9            381         28.47
                                                                                   Total                89.0            464         91.00
Source:
1. UxC Uranium Production Cost Study – August 2017
                                                                                                    Paladin Energy   |   Company Update     |   4
2. TradeTech Uranium Market Study – 2017: Issue 3 (based on 2016 production)
3. At current processing rates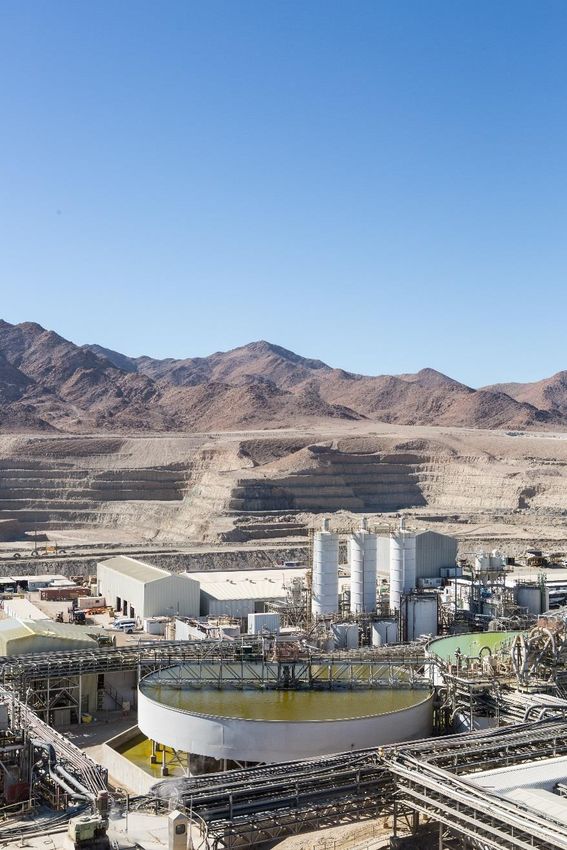
Summary of Recent Recapitalisation
                                                           1
                                     Paladin
                                     PaladinEnergy
                                             Energy   ||   Company
                                                            CompanyUpdate
                                                                    Update   |   5
Key Elements of Recent Recapitalisation
Debt for equity swap – Previous bondholders and former EDF pre-payment debt (note: EDF’s claims were acquired
by Deutsche Bank during the restructuring) were transferred 70% of existing pre-restructure Paladin shares
outstanding pro-rata to the value of their claims
New US$115M bond issue (New Notes) – New senior secured bond with 5-year term (bullet) and interest of 9.0%
(note: interest can be paid at 10.0% PIK instead of cash interest). New Notes subscribers were transferred 25% of
existing pre-restructure Paladin shares outstanding
Underwriter shares – New Notes issue was fully underwritten prior to completion and underwriters received (via
transfer) 3% of existing pre-restructure Paladin shares outstanding
Pre-restructure shareholders – Kept the remaining 2% of existing pre-restructure Paladin shares outstanding
Paladin acquisition of LHM working capital facility – Paladin acquired the US$60M LHM working capital facility
using some of the funds from the New Notes issue
Extinguishment of all “subordinated claims” against Paladin
New board – All directors new other than the ongoing Chairman (Rick Crabb)
No material change in underlying assets or business – Paladin continues to own 75% of its ‘flagship’ operating
Langer Heinrich Mine in Namibia, together with Kayelekera Mine (care and maintenance) and its suite of pre-
development properties in Australia and Canada. Paladin remains listed on the ASX under the ticker PDN
Recapitalisaton completed – All relevant elements to the transaction completed on or before 1 February 2018
Paladin Energy | Company Update | 6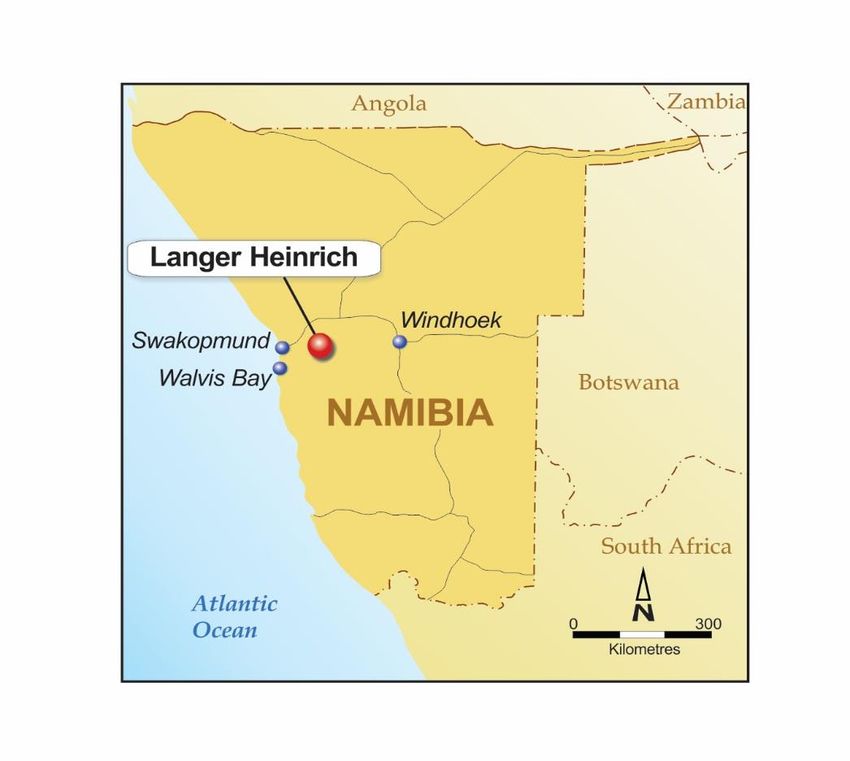
Key Outcomes

Significant reduction in debt and debt servicing

                                                                      Pre-Restructure     Post-Restructure

                                                                            US$715m

    Net Debt1

                                                                                                  US$44m

                                                                          31 Dec 2017    Pro-forma 31 December 20174

    Average Debt Tenor                                                       1.5 Years            5 Years

    Annual Interest Cost
                                                                            US$24.4m                   -
    - Cash
    - PIK                                                                          -            US$11.5m2

    All-in Company–Wide Cash                                               US$29-31/lb         US$27-30/lb3
    Expenditure

1 Based on face value of debt
2 10% PIK Toggle Notes. Cash coupon of 9% payable if certain cash flow thresholds met        Paladin Energy   |   Company Update   |   7
3 Pre mining restart.
4 Notes US$115m less pro-forma cash as at 31 December 2017 of US71m
Substantial Shareholders
Pre-Restructure
HOPU 14.6%
GIC 7.0%
Post -Restructure
Tembo 13.1%
Burlington Loan Management (Davidson Kempner) 12.4%
Value Partners 11.8%
Deutsche Bank AG and its affiliates 10.2%
JPMorgan 9.9%
HOPU 7.0%
China Investment Corporation 5.6%
During the restructure, Deutsche Bank purchased the EDF’s claim and largely brokered it to equity-minded
investors – Paladin now enjoys a stronger institutional equity base
New cornerstone investors Tembo and HOPU have helped relieve any potential overhang and help broaden the
equity base
Paladin Energy | Company Update | 8
New Board of Directors
Mr Rick Wayne Crabb Mr Crabb holds degrees of Bachelor of Jurisprudence (Honours), Bachelor of Laws and a Master of Business Administration from the University of
B. Juris (Hons), LLB, MBA, Western Australia. He practised as a solicitor from 1980 to 2004 specialising in mining, corporate and commercial law and advised in relation to
FAICD numerous project developments in Australia, Asia and Africa.
Mr Crabb now focuses on his public company directorships and investments.
Non-executive Chairman He is also a non-executive director of Eagle Mountain Mining Limited (since September 2017), Thundelarra Limited (since November 2017) and was a
non-executive director of Golden Rim Resources Ltd (from August 2001 to November 2017) and was nonexecutive chairman of Otto Energy Ltd (from
November 2004 to November 2015) and Lepidico Ltd (formerly Platypus Minerals Ltd) (from September 1999 to October 2015).
Mr David Noel Riekie Mr Riekie is an experienced ASX director at both the Executive and Non-Executive levels.
Mr Riekie has operated in a variety of counties globally and throughout Africa; notably Namibia and Tanzania. David is Managing Director of junior
BEcon, Dip Acc , MAICD, CA
explorer iCobalt Limited. David has throughout his career provided corporate, strategic and compliance services.
Additional experiences were been gained during his time as a corporate reconstruction specialist with Price Waterhouse. David has overseen, exploration
Independent Non-executive and resource development, scoping and feasibility studies, production, optimisation and rehabilitation initiatives.
Director Mr Riekie has special interest in the energy and energy storage sector, primarily through energy storage minerals and commodities with specific
knowledge of uranium (Uranio Limited), oil and gas (Hawkley Oil and Gas), graphite (Battery Minerals Limited) and cobalt (iCobalt Limited).
David has previously operated as either Chairman or member of Audit, Risk, Remuneration and Nomination Committees.
Mr Daniel Harris Mr Harris is a seasoned and highly experienced mining executive and director and has most recently held the role of interim CEO and Managing Director
of ASX listed Atlas Iron. Daniel remains an Non-Executive Director to the Atlas Iron Board and is Chairman of the Audit and Risk Committee.
BSc Mr Harris has been involved in all aspects of the industry for over 37 years and held both COO and CEO positions in Atlantic Ltd. As COO, Daniel was
tasked with the start-up of the newly constructed vanadium plant, before moving to the CEO role.
Independent Non-executive Mr Harris is also the former Vice President of EVRAZ Plc, responsible for their global vanadium business. EVRAZ plc is a £4.2 billion publicly traded
Director steel, mining and vanadium business with operations in the Russian Federation, Ukraine, Europe, USA, Canada and South Africa.
Prior to EVRAZ, Mr Harris held numerous positions with Strategic Minerals Corporation. Throughout his 30 years with the company, he advanced his
career from junior engineer, through to CFO and CEO roles within the group.
Mr Harris is also a Non-Executive Director of Perth based Australian Vanadium, a consultant and member of the Advisory Board of Black Rock Metals.
Mr Harris is the Chief Advisor to the Board of Directors of Queensland Energy Minerals, QEM, based in Brisbane.
John Hodder Mr Hodder is a Geologist by background with a B.Sc. in Geological Sciences and a BCom in Finance and Commerce from the University of Queensland
BSc, Bcom, MBA Mr Hodder spent ten years in the mining and oil and gas industries before completing a M.B.A. at London Business School. John established the
Commonwealth Development Corporation (CDC) mining, oil and gas investment department in 1995 and was responsible for its investment activities for
some eight years.
Non-executive Director Mr Hodder has served as a director of a number of junior mining companies and has significant experience of operating and investing in Africa. John also
worked at Suncorp and Solaris as a Fund Manager focusing on the resources sector managing an index-linked natural resource portfolio of
~AUD$1.25bn. In 2014 John was one of three principals who established Tembo Capital a mining focused private equity fund.
Paladin Energy | Company Update | 9Current Operating Status and Outlook
2
Paladin
PaladinEnergy
Energy || Company
CompanyUpdate
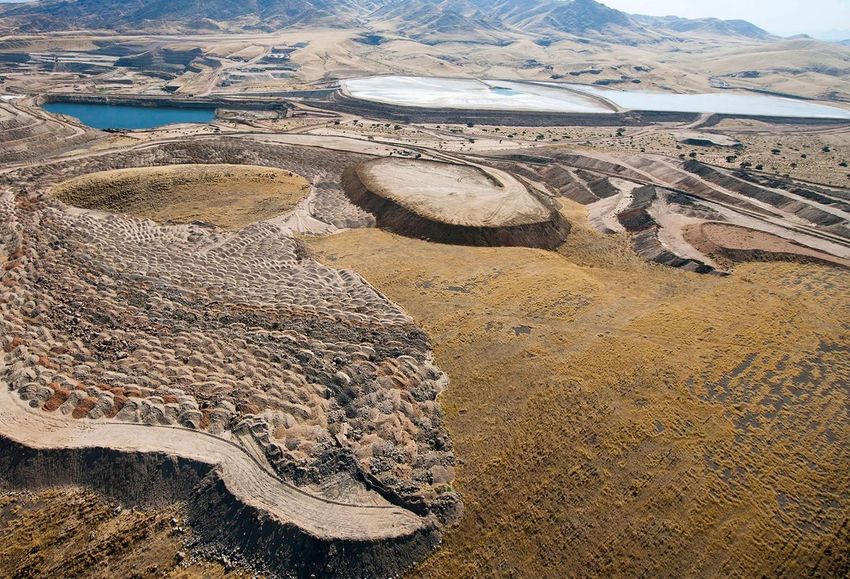
Update | 10Langer Heinrich Mine – Status
Located near the west coast of central Namibia, 85km northeast of Walvis Bay
To reduce cash operating costs, LHM ceased
physical mining in November 2016 maintaining
processing feed from medium grade ore stockpiles
C1 cash costs reduced from US$25.27/lb to a
record low of US$16.25/lb (half to Dec 2016)
LHM’s current mining curtailment strategy relies on
processing medium grade stockpiled ore
Such stockpiles will be exhausted by mid-2019
A decision needs to be made at least six months
prior as to whether to restart physical mining,
process low grade stockpiles or place LHM on care
and maintenance
Total resource of 128.9Mlb at 465ppm containing a
total reserve of 91Mlb at 464ppm1
1at a break even cut-off grade of 250ppm for all resource and reserve categories. Ownership 75% Paladin. Paladin Energy | Company Update | 11Historical and Continued Optimisation
Langer Heinrich Mine - Cost Reductions
Optimisation has resulted in a reduction in C1 Cash Costs to a record low of US$16.25/lb
C1 Cash Cost (US$/lb)
35
Recent costs increased due to lower production and higher
30.55 reagent usage. Lower production caused by:
30 28.52 C1 cash cost (USD/lb) lower plant feed grade due to MG 3 Stockpile
27.66
26.50 Variability
25.27
- Reject ratios and head grades varied
25 22.95 23.11 considerably
- Ore type exhibiting poor settling characteristics
20 - A minimum of five variables in the current MG
3 blend to control
US$/lb
lower plant throughput due to wet ore limiting
15 16.25 throughput and thickening/CCD issues including
overloaded/bypassed thickeners and underflow
pumping restrictions (both mechanical breakdown
10 Mining Curtailment and capacity issues)
5 Bicarbonate Recovery Plant Flash Splash (3QFY17)
- US$5-6/lb stand-alone saving - US$0.25/lb stand-alone saving Back-end Upgrade 3A/4 (FY20-21)
- US$4-5/lb stand-alone saving
0
Jun 14 Dec 14 Jun 15 Dec 15 Jun 16 Dec 16 Jun 17 Dec 17 Jun 18 Dec 18 Jun 19 Dec 19 Jun 20
Notes:
Paladin Energy | Company Update | 12
* Above numbers based on half year resultsLanger Heinrich Mine – Future Optimisation Potential
Innovation remains key to increasing operation efficiencies and lowering production costs
Back-end Upgrade Project (BUP) U-pgrade
The BUP will utilise the existing LHM process across Marenica Energy Ltd has performed initial test work and
the Beneficiation, Leach and CCD & TSF areas with proceeded to calculate the possible benefit to LHU of
relatively minor changes feeding the currently uneconomical low grade ore into an
upgrade plant. Preliminary results a positive
The PLS to be treated via a substantially new process
that has been divided into the following process areas: The U-pgrade™ process uses mineralogical data to
• PLS concentration; determine a processing route to reject a low grade
• Vanadium precipitation; stream, leaving a high grade product for further
• Uranium precipitation; processing
• Causticisation & carbonation;
• Crystallisation; Initial study and testwork for a 3Mt (avg grade of
• Vanadium refinery; and 325ppm) per annum U-pgrade™, plant to co-process
• Uranium refinery low grade material
BUP has completed the R&D phase with material
Potential to increase production 1.5-1.8Mlb p.a. and
benefits across the operations including;
reduce average costs by US$1-2/lb
Potential to reduce process cost by US$4-5/lb
• Vanadium produced for sale
• Process more stable and operability improved
• Implementation period of 2 years and a Simple capex
return period of 12-18 months
Paladin Energy | Company Update | 13Non-Langer Heinrich Portfolio – An Industry Leading Suite of Development Assets
Michelin (100%)
Mt Isa (82/91/100%)
91,500ha mineral licence in
Labrador Direct 50% interest in 2,724ha of
336,130m of cumulative licences and 82% ownership of
linear drilling Canada ASX-listed Summit Resources
US$75m of total historical in Largest uranium deposit in
ground exploration to-date Queensland
Among largest deposits in Potential for future development
North America of 5-7mlbpa uranium mine
Potential development 2022- Status: Pre-development
2025 timeframe exploration/scoping
Status: Pre-development
exploration/scoping
Malawi
Manyingee (100%)
Australia
Three mining licences covering
Kayelekra (85%) 1,307ha
Carley Bore (100%)
Fully built mine commissioned Over US$17.9m of cumulative
in 2008 with 3.3mlbpa Three exploration licences exploration and testing to date
capacity covering 1,013km2, 100km including 55,764m of
south of Manyingee cumulative drilling and field
Produced cumulative 10.9mlb leach trial
before being placed in care Acquired in 2015 for US$13m
and maintenance in 2014 Potential for 1-2mlbpa ISR mine
Potential for “stand alone” or
Restart implementation plan satellite ISR to Manyingee ISR
under preparation project Status: Moving to pre-feasibility
incorporating optimised
economics
Status: Pre-development
Status: Developed mine on care & maintenance exploration/scoping
Paladin Energy | Company Update | 14Continued Reduction in Non-LHM Spending
Exploration and other controllable costs have been significantly reduced and are expected to hit a "run rate" of c. US$10-11m per year
from FY19E
32.9 Reduction of c. 68%
Exploration
Previously deferred exploration commitments at 5.3
the Michelin project are expected to result in
increased exploration expenditure in FY19 and
FY20 (assumes 100% ownership of Michelin
project)
Exploration carrying cost of c. US$2-3m until
improved uranium market 11.6
19.1
3.1
Corporate Costs and KM
6.1 11.8 11.3
Corporate head count has been reduced by 10.5 10.5
approximately two thirds since 2015 2.3
2.6
2.5 2.5
All non-essential expenditure continues to be 16.0 3.2
reduced 3.2
3.0 3.0
Corporate costs will likely plateau around US$3m 9.9
per year and KM care and maintenance at US$5m 6.3
per year 5.5 5.0 5.0
FY15a FY16a FY17a FY18e FY19e FY20e
KM C&M costs Corporate costs Exploration costs
Notes:
Paladin Energy | Company Update | 15
* Excludes one-off items and working capital requirements.Best Senior Leverage To Uranium Upside
3
Paladin Energy | Company
CompanyUpdate
Update | 16Uranium is Unsustainable at US$20-25/lb
Contracts are rolling off industry-wide and the spot price is too low to cover costs for most
Global uranium cost curve vs forecasted achieved price (US$/lb) Global uranium cost curve vs forecasted achieved price (US$/lb)
100% 5% 40
90% 38
32%
80% 36
70% 62% 34
US$/lb nom
74%
% of sales
60% 32
88%
2017 weighted avg achieved price (as derived below) 50% 100% 95% 30
2018 achieved 40% 28
2019 achieved 68%
2020 30% 26
2021
2022 20% 24
Spot 38%
10% 26% 22
12%
-% 20
2017 2018 2019 2020 2021 2022
Uncontracted % (LHS) Contracted % (LHS) Weighted average price (RHS)
Taking into account contracts and un-contracted volumes, Paladin estimates the industry average received price is now falling below US$40/lb
If Spot stays US$20-25/lb, average received prices will fallPositive Catalysts Are Happening
Positive supply and demand changes are already driving prices off CY16&17 lows
Key catalysts Historical uranium price (US$/lb)
KazAtomProm announced (in January 17), it $80.00 Green shoots leading into 2018
$30.00
plans to cut 2017 uranium production by 10%
(equates to c. 4% of global production)
$70.00 $25.00
Cameco announced (in November 17) it would
suspend production at its McArthur River/Key
Lake project for up to ten months in 2018, which
$60.00 $20.00
should remove approximately 15 million pounds
U3O8from the supply side
Other projects have seen announced output $15.00
$50.00
Oct 17 Nov 17 Dec 17 Jan 18
reductions in 2017, including AREVA NC’s
SOMAIR mine in Niger, and multiple U.S. ISR
projects – Energy Fuels’ Nichols Ranch and Ur- $40.00
Energy’s Lost Creek
New regulation in New York and Illinois prove
US policy is becoming more supportive for $30.00
nuclear
Progress continues towards the construction for
$20.00
the Hinkley Point C nuclear power plant in the
UK
The Genkai 3 and 4 reactors in Japan have $10.00
been cleared to restart
$0.00
2010 2011 2012 2013 2014 2015 2016 2017 2018
Paladin Energy | Company Update | 18Unique Leverage Through Potential Volume Growth
Our fully built capacity plus pipeline provides unique growth potential
Potential volume growth within existing capacity (mlbs) Future Pipeline
8
7 Michelin
2.50
6
MT Isa
5
mlbs
1.5 Manyingee
4
7.50
3
2
3.50
1
-
LHM Curtailment Undwinding of KM unwind C&M Total exisiting 1 2 3 4 5 6
curtlaiment (*3-4 (18 months lead- capacity
month lead time) time) Years
Paladin Energy | Company Update | 19Outlook 4
Paladin
PaladinEnergy
Energy || Company
CompanyUpdate
Update | 20Strategy
MAXIMISE LHM OPERATING CASH FLOWS THROUGH CONTINUED OPTIMISATION
INITIATIVES WHILST PRESERVING THE INTEGRITY OF THE LONG-TERM LIFE OF MINE
PLAN
MAINTAIN KM AND EXPLORATION ON A “MINIMAL EXPENDITURE, CARE AND
MAINTENANCE BASIS”
MINIMISE CORPORATE AND ADMINISTRATIVE COSTS
PREPARE FOR GROWTH
Paladin Energy | Company Update | 21Paladin Energy Ltd – Contact Details
Head Office
Level 4, 502 Hay Street
Subiaco Western Australia 6008
PO Box 201, Subiaco
Western Australia 6904
Telephone: +61 (0) 8 9381 4366
Facsimile: +61 (0) 8 9381 4978
Email: paladin@paladinenergy.com.au
Website: www.paladinenergy.com.au
Paladin Energy | Company Update | 22Paladin Energy Ltd
Additional Information
Paladin Energy | Company Update | 23Post Restructure Pro-Forma Balance Sheet
Pro-Forma Balance Sheet Forecast Pro-Forma Adjustments Key components Comment
at 31 December 2017 31 Dec Debt to New Repay DB Pre-admin Pro-
2017 Equity Notes Facility Creditors Forma 2017 and 2020 Bondholders claim of US$391m
US$m US$m US$m US$m US$m US$m Convertible Bonds exchanged into equity representing 40%
ASSETS of the existing equity.
Current assets
Cash and cash equivalents 27 1081 (63)2 (1) 71 Bondholders and acquirers of EDF
Trade and other receivables 16 (2) 14 claims provided the opportunity to fund
Inventories 30 30 the new secured notes of US$115m.
TOTAL CURRENT ASSETS 73 108 (65) (1) 115
EdF Former EDF claim of US$288m
exchanged into equity representing 30%
Non current assets
of the existing equity.
Property, plant and equipment 376 376
TOTAL NON CURRENT ASSETS 376 376 DB Facility Drawn DB Facility of US$60m paid down
to US$45m from cash on hand.
TOTAL ASSETS 449 108 (65) (1) 491
Balance of US$45m repaid from
LIABILITIES proceeds of new senior secured bond.
Current liabilities
Trade and other payables 23 (3) (1) 19 New funding Total new funding of US$115m in the
Interest bearing loans and borrowings 739 (679) (60) - form of a senior secured 10% PIK with a
TOTAL CURRENT LIABILITIES 762 (679) (63) (1) 19 9% cash toggle to fund liquidity for FY18
to FY21 assuming uranium price stays
Non current liabilities lower for longer.
Interest bearing loans and borrowings - 733 73 In consideration for providing new
Other Interest bearing loans - CNNC 91 91 money of US$115m, participating new
Provisions 92 92 funders receive a further 25% of the
TOTAL NON CURRENT LIABILITIES 183 73 256 existing equity and their pro rata portion
of the new secured bond.
TOTAL LIABILITIES 945 (679) 73 (63) (1) 275 For those participating new funders that
commit to underwrite any shortfall of the
NET ASSETS (496) 679 35 (2) 216 new secured bond, they will receive a
further 3% of the existing equity.
TOTAL EQUITY (496) 679 35 (2) 216
1 Noteproceeds net of transaction costs
2 Repayment of DB facility including fees Paladin Energy | Company Update | 24
3 Notes of US$115m split between debt and equity, representing shares issued to new Note holdersResource and Reserve Tables
30 June 2017
30 June 2017
Ore Reserves grade % Metal Ownership
Mineral Resources
M tonnes grade % U3O8 Metal t Paladin Ownership %
M tonnes U3O8 t %
Canada Malawi
Measured Jacques Lake - - - 100
Michelin 17.62 0.097 17,045 100
Proven Kayelekera 0.39 0.117 457 85
Rainbow 0.21 0.092 193 100 Probable Kayelekera 5.34 0.088 4,709 85
Indicated Gear 0.35 0.077 270 100
Inda 1.2 0.069 826 100
Stockpiles Kayelekera 1.59 0.076 1,199 85
Jacques Lake 12.96 0.063 8,145 100
Namibia
Michelin 20.65 0.098 20,225 100
Nash 0.68 0.083 564 100 Proven Langer Heinrich 41.97 0.052 21,997 75
Rainbow 0.76 0.086 655 100 Probable Langer Heinrich 13.14 0.048 6,366 75
Inferred Gear 0.3 0.093 279 100
Inda 3.26 0.067 2,171 100 Stockpiles Langer Heinrich 33.90 0.038 12,915 75
Jacques Lake 3.61 0.055 1,988 100
Michelin 4.54 0.099 4,470 100
Nash 0.51 0.072 367 100
Rainbow 0.91 0.082 739 100
Malawi
Measured Kayelekera 0.74 0.101 753 85
Indicated Kayelekera 12.71 0.070 8,901 85
Inferred Kayelekera 5.35 0.062 3,334 85
Stockpiles Kayelekera 1.59 0.076 1,199 85
Namibia
Measured Langer Heinrich 60.71 0.051 31,169 75
Indicated Langer Heinrich 21.48 0.046 9,854 75
Inferred Langer Heinrich 8.70 0.047 4,073 75
Stockpiles Langer Heinrich 33.90 0.038 12,915 75
Australia
Measured Valhalla 16.02 0.082 13,116 91
Indicated Andersons 1.4 0.145 2,079 82
Bikini 5.77 0.050 2,868 82
Duke Batman 0.53 0.137 728 100
Odin 8.2 0.055 4,534 91
Skal 14.3 0.064 9,177 91
Valhalla 18.64 0.084 15,662 91
Carley Bore 5.4 0.042 2,268 100
Manyingee 8.37 0.085 7,127 100
Inferred Andersons 0.1 0.164 204 82
Bikini 6.7 0.049 3,324 82
Duke Batman 0.29 0.110 325 100
Honey Pot 2.56 0.070 1,799 100
Mirrioola 2 0.056 1,132 82
Odin 5.8 0.059 3,430 91
Skal 1.4 0.052 708 91
Valhalla 9.1 0.064 5,824 91
Watta 5.6 0.040 2,260 82
Warwai 0.4 0.036 134 82
Carley Bore 17.4 0.028 4,825 100
Manyingee 5.41 0.085 4,613 100
Paladin Energy | Company Update | 25You can also read


