Reliability Outlook An adequacy assessment of Ontario's electricity system - IESO
←
→
Page content transcription
If your browser does not render page correctly, please read the page content below
Reliability Outlook
An adequacy assessment of Ontario’s
electricity system
FROM JULY 2020 TO DECEMBER 2021
Executive Summary
Ontario’s economy is starting to reopen after COVID-19 but there is still some uncertainty as to the
pandemic’s long-term impacts on demand for electricity. The stay-in in-place order and the closure of non-
essential businesses caused overall electricity consumption to drop but as expected, with more people
working from home, residential consumption has increased since the start of the lockdown. By contrast,
commercial loads have declined significantly since the shutdown of non-essential businesses.

Although the situation remains fluid, demand patterns have started to return to normal as businesses re -start
their operations. Given its role as Ontario’s power system integrator, conversations with generators,
transmitters, distributors and large customers are ongoing, and will help ensure we are collectively prepared
to adapt to the “new normal.” The IESO continues to monitor the situation closely and will provide further
updates when available.

Overall, Ontario’s electricity system is well-positioned for the next 18 months, with adequate supply to meet
demand. Potential risks in summer 2020 and summer 2021 are expected to be mitigated by outage
rescheduling. While COVID-19 has affected demand for electricity, its impacts have been far reaching across
the sector. A number of planned outages at generation and transmission resources were rescheduled, and the
pandemic may continue to impact these and other inputs to the capacity and energy adequacy assessments.
The IESO continues to monitor the situation, and will provide updated assessments when more information
becomes available.

Late last week the government announced it would be implementing an Industrial Conservation Initiative
(ICI) peak hiatus to enable and encourage businesses to focus on their operations during this time. After
considering the impacts of an ICI hiatus, the IESO has determined that Ontario’s electricity system should
remain reliable this summer without the program. To help manage periods of high demand, we can rely on
other tools such as imports and/or outage deferrals.

Recent events, whether it’s COVID-19, or just unusually hot weather earlier this spring, show that Ontario’s
power system is resilient and has the flexibility needed to adapt to changing circumstances. Through
electricity market mechanisms as well as our diverse supply mix, the IESO has a broad range of tools to
manage the system and support reliability and cost-effectiveness.

Independent Electricity Sy stem Operator | Public                                                               1
Contents

1. Introduction                                                                                    4
2. Updates to this Outlook                                                                         5
     2.1 Updates to the Demand Forecast                                                             5
     2.2 Updates to Resources                                                                       5
     2.3 Updates to the Transmission Outlook                                                        5
     2.4 Updates to the Operability Outlook                                                         5
3. Demand Forecast                                                                                 6
4. Resource Adequacy                                                                               10
     4.1 Assessment Assumptions                                                                    11
           4.1.1 Generation Resources                                                              11
           4.1.2 Generation Capability                                                             12
           4.1.3 Demand Measures                                                                   14
           4.1.4 Firm Transactions                                                                 14
           4.1.5 Summary of Scenario Assumptions                                                   15
     4.2 Capacity Adequacy Assessment                                                              16
           4.2.1 Firm Scenario with Normal and Extreme Weather                                     16
           4.2.2 Planned Scenario with Normal and Extreme Weather                                  16
           4.2.3 Comparison of the Current and Previous Weekly Adequacy Assessments for the Firm
           Normal Weather Scenario                                                                 17
     4.3 Energy Adequacy Assessment                                                                18
           4.3.1 Summary of Energy Adequacy Assumptions                                            18
           4.3.2 Results – Firm Scenario with Normal Weather                                       19
           4.3.3 Findings and Conclusions                                                          19
5. Transmission Reliability Assessment                                                             22
     5.1 Transmission Projects                                                                     22
     5.2 Transmission Outages                                                                      22
     5.3 Transmission Considerations                                                               22
6. Operability                                                                                     25
     6.1 Surplus Baseload Generation                                                               25
7. Resources Referenced in This Report                                                             29
8. List of Acronyms                                                                                30

Independent Electricity Sy stem Operator | Public                                                       2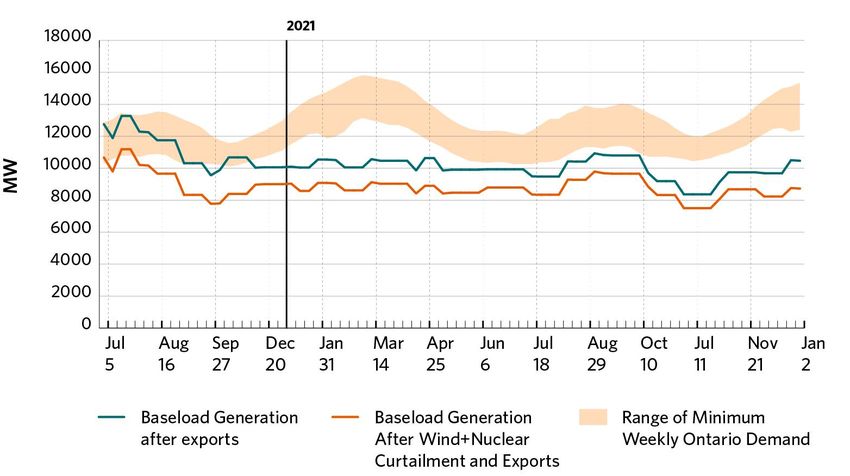
List of Figures
Figure 4-1 | Monthly Wind Capacity Contribution Values                                              13
Figure 4-2 | Monthly Solar Capacity Contribution Values                                             14
Figure 4-3 | Comparison of Normal and Extreme Weather: Firm Scenario Reserve Above Requirement      16
Figure 4-4 | Comparison of Normal and Extreme Weather: Planned Scenario Reserve Above Requirement   17
Figure 4-5 | Comparison of Current and Previous Outlook: Firm Scenario Extreme Weather Reserve Above
Requirement                                                                                          18
Figure 4-6 | Forecast Energy Production by Fuel Type                                                20
Figure 4-7 | Forecast Monthly Energy Production by Fuel Type                                        20
Figure 6-1 | Minimum Ontario Demand and Baseload Generation                                         26
Figure 6-2 | Minimum Ontario Demand and Baseload Generation                                         27
Figure 6-3 | Monthly Off-Peak Wind Capacity Contribution Values                                     28

List of Tables
Table 3-1 | Forecast Energy Summary                                                                  7
Table 3-2 | Forecast Seasonal Peaks                                                                  7
Table 4-1 | Existing Grid-Connected Resource Capacity                                               10
Table 4-2 | Committed Generation Resources Status                                                   11
Table 4-3 | Monthly Historical Hydroelectric Median Values for Normal Weather Conditions            12
Table 4-4 | Summary of Available Resources under Normal Weather                                     15
Table 4-5 | Summary of Zonal Energy for Firm Scenario Normal Weather                                19
Table 4-6 | Ontario Energy Production by Fuel Type for the Firm Scenario Normal Weather             21
Table 7-1 | Additional Resources                                                                    29

Copyright © 2020 Independent Electricity System Operator. All rights reserved.

Independent Electricity Sy stem Operator | Public                                                    3
1. Introduction
This Outlook covers the 18 months from July 2020 to December 2021, and supersedes the Outlook released
on March 24, 2020.
The purpose of the 18-month horizon in the Reliability Outlook is to:
Advise market participants of the resource and transmission reliability of the Ontario electricity system
Assess potentially adverse conditions that might be avoided by adjusting or coordinating maintenance
plans for generation and transmission equipment
Report on initiatives being implemented to improve reliability within this time frame
This Outlook assesses resource and transmission adequacy based on the stated assumptions, following the
Methodology to Perform the Reliability Outlook. Due to uncertainties associated with various assumptions,
readers are encouraged to use their judgment in considering possible future scenarios.
Additional supporting documents are located on the IESO website.
Security and adequacy assessments are published on the IESO website on a daily basis and progressively
supersede information presented in this report.
For questions or comments on this Outlook, please contact us at 905-403-6900 (toll-free 1-888-448-7777) or
customer.relations@ieso.ca.
Independent Electricity Sy stem Operator | Public 4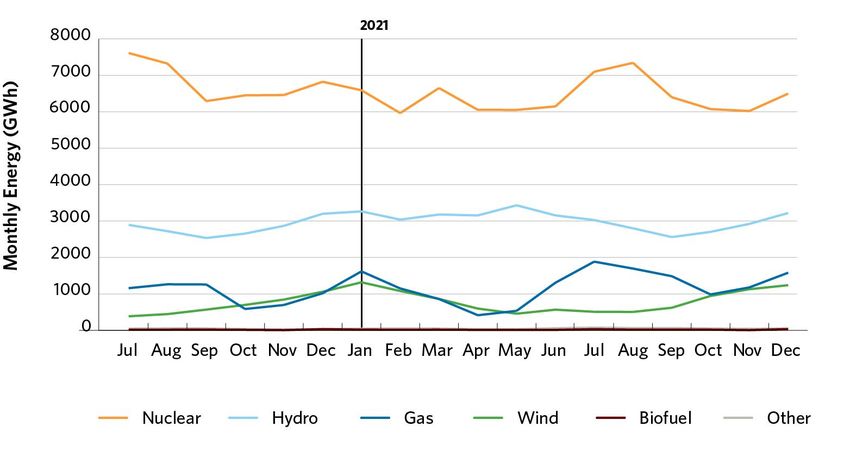
2. Updates to this Outlook

2.1 Updates to the Demand Forecast
The demand forecast used in this Outlook is informed by actual demand, weather and economic data through
to the end of April, 2020, and has been updated to reflect the most recent economic projections. Actual
weather and demand data for April and May 2020 are included in the tables.

2.2 Updates to Resources

This Reliability Outlook considers planned generator outages over the 18-month period, submitted by market
participants to the IESO’s outage management system as of June 1, 2020. Market participants are required
annually to submit information to enable the IESO to conduct reliability assessments. This information,
provided to the IESO through Form 1230, was submitted by April 1, 2020.

2.3 Updates to the Transmission Outlook

This Outlook also considers transmission outage plans that were submitted to the IESO’s outage management
system by April 27, 2020.

2.4 Updates to the Operability Outlook
The outlook for surplus baseload generation (SBG) conditions over the next 18 months is based on generator
outage plans submitted by market participants to the IESO’s outage management system as of June 1, 2020.

Independent Electricity Sy stem Operator | Public                                                          5

3. Demand Forecast

    The IESO has updated the demand forecast to reflect post-COVID-19 conditions. Economic disruption
    from COVID-19 is widespread, causing reductions in provincial energy demand and peak demand.
    Going forward, the situation remains fluid and the IESO will continue to monitor and provide updated
    forecasts as new information becomes available.

The IESO is responsible for forecasting electricity demand on the IESO-controlled grid. This demand forecast
covers the period July 2020 to December 2021 and supersedes the previous forecast released in March 2020.
Tables of supporting information are contained in the 2020 Q2 Outlook Tables.

The onset of the coronavirus and the ensuing public health and policy responses, have had significant effects
on Ontarians’ behaviour and economic activity. These effects are being seen in changing patterns of electricity
consumption.

The stay-in-place order and the closure of non-essential businesses have caused overall electricity
consumption to drop. As expected, with more people working from home, residential consumption has
increased. By contrast, commercial loads have dropped significantly due to the emergency lock down and
physical distancing measures. However, the current state is unlikely to persist as the weather begins to warm
up and the province continues to reopen the economy.

Going forward, the path is not clearly defined and remains fluid. A staged reopening of the economy will take
place over the course of the summer. As people return to work and businesses open their doors , electricity
demand in the business sector will begin to increase. By fall of 2020, schools of all levels are expected to be
open in some form or another, further bolstering demand for electricity.

During the final two quarters of 2020, Ontario’s economy is likely to start recovering which will result in a
rebound in electricity demand.

There are risks to this forecast. A surge in virus cases could lead to further suspension of economic activities
and, thus, further reductions in demand. As well, Ontario’s economy is highly integrated with the American
economy. Circumstances that impact the U.S. recovery and subsequent growth will be felt in Ontario. Barriers
to trade could negatively impact Ontario’s recovery.

In addition to demand profiles evolving as the economy reopens this summer, the Ministry of Energy,
Northern Development, and Mines recently announced current participants in the Industrial Conservation
Initiative (ICI) program1 do not need to reduce demand during peak hours in 2020-2021 as part of the

1
  https://news.ontario.ca/mndmf/en/2020/06/ontario-provides-stable-e lectricity-pricing-for-industria l-and-commercia l-
companies.html?ut m_source=onde mand&ut m_medium=e mail&ut m_ca mpaign=m
Independent Electricity Sy stem Operator | Public                                                                          6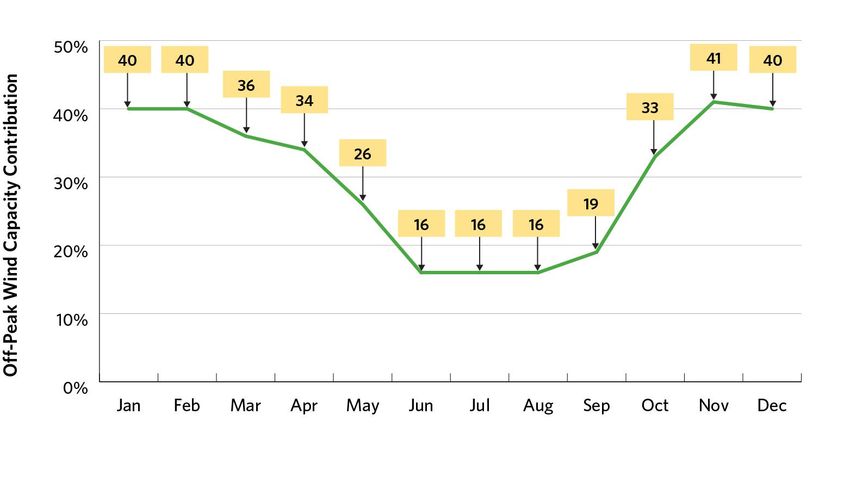
government’s response to COVID-19. This change contributes to a higher peak for summer 2020 than was
previously forecast. The program is expected to return to its normal operation for 2021-2022.

The IESO continues to monitor the situation and will provide updated forecasts when more information
becomes available.

Table 3-1 | Forecast Energy Summary

Year                                                Normal Weather Energy (TWh)                        % Growth in Energy

2020 (Forecast)                                                            129.6                                   -3.40%

2021 (Forecast)                                                            134.3                                    3.64%

Table 3-2 | Forecast Seasonal Peaks

Season                                                Normal Weather Peak (MW)                 Extreme Weather Peak (MW)

Summer 2020                                                                22,364                                  24,731

Winter 2020-21                                                             20,558                                  21,737

Summer 2021                                                                22,103                                  24,375

Table 3-3 | Weekly Energy and Peak Demand Forecast

                                     Nor mal Peak         Extreme Peak                 Load Forecast        Nor mal Energy
Week Ending                                ( M W)               ( M W)              Uncertainty (MW)        Demand (GWh)

05-Jul-20                                  18,697               20,789                          814                  2,445

12-Jul-20                                  21,570               23,034                          838                  2,638

19-Jul-20                                  22,239               24,261                         1,035                 2,659

26-Jul-20                                  22,329               24,347                          841                  2,672

02-Aug-20                                  22,364               24,377                          958                  2,667

09-Aug-20                                  20,608               24,325                          985                  2,548

16-Aug-20                                  21,397               24,506                         1,362                 2,684

23-Aug-20                                  21,631               24,731                         1,413                 2,675

30-Aug-20                                  20,407               22,783                         1,370                 2,532

06-Sep-20                                  20,312               22,487                          680                  2,516

13-Sep-20                                  20,217               22,192                          781                  2,459

20-Sep-20                                  18,980               21,720                          420                  2,374

27-Sep-20                                  17,963               20,250                          554                  2,333

04-Oct-20                                  17,293               19,558                          786                  2,275

11-Oct-20                                  16,129               16,436                          507                  2,249

Independent Electricity Sy stem Operator | Public                                                                   7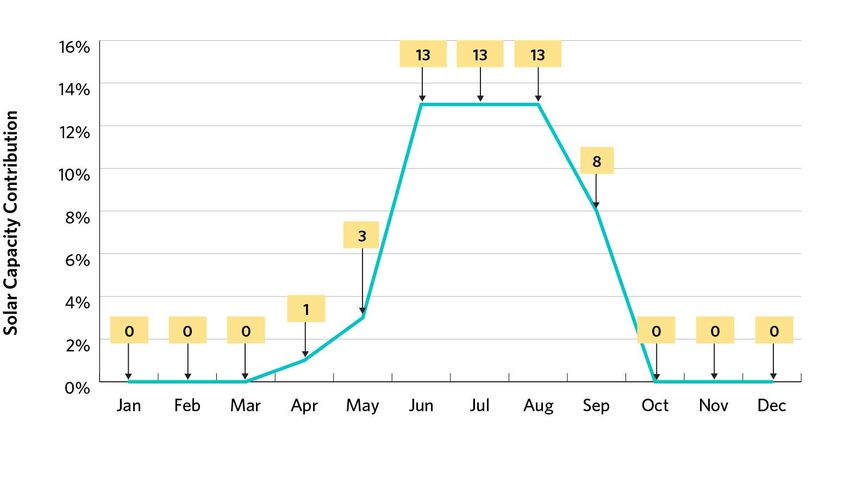
Nor mal Peak   Extreme Peak      Load Forecast   Nor mal Energy
Week Ending                                ( M W)         ( M W)   Uncertainty (MW)   Demand (GWh)

18-Oct-20                                  16,213         16,610               392             2,228

25-Oct-20                                  16,368         16,955               318             2,297

01-Nov -20                                 16,560         17,298               416             2,338

08-Nov -20                                 17,170         17,964               601             2,372

15-Nov -20                                 17,949         18,162               342             2,426

22-Nov -20                                 18,311         18,915               607             2,510

29-Nov -20                                 18,730         19,670               409             2,558

06-Dec-20                                  19,152         20,501               555             2,655

13-Dec-20                                  19,574         20,980               690             2,687

20-Dec-20                                  19,514         20,920               362             2,698

27-Dec-20                                  19,297         20,536               528             2,604

03-Jan-21                                  19,271         20,528               528             2,617

10-Jan-21                                  20,388         21,737               570             2,828

17-Jan-21                                  20,353         21,555               547             2,849

24-Jan-21                                  20,535         21,532               483             2,856

31-Jan-21                                  20,558         21,552               404             2,856

07-Feb-21                                  20,132         20,978               734             2,767

14-Feb-21                                  19,707         20,559               635             2,755

21-Feb-21                                  19,533         20,701               581             2,717

28-Feb-21                                  19,216         20,690               501             2,727

07-Mar-21                                  18,834         20,161               531             2,626

14-Mar-21                                  18,053         19,482               649             2,574

21-Mar-21                                  17,518         18,986               611             2,508

28-Mar-21                                  17,370         18,530               569             2,460

04-Apr-21                                  17,013         18,043               567             2,359

11-Apr-21                                  16,488         17,026               471             2,340

18-Apr-21                                  16,405         17,167               496             2,331

25-Apr-21                                  16,312         16,902               531             2,276

02-May -21                                 16,304         17,132               721             2,273

09-May -21                                 16,726         18,652               849             2,293

16-May -21                                 17,236         19,239               845             2,323

23-May -21                                 17,569         20,942              1,175            2,311

30-May -21                                 18,257         20,913              1,330            2,292

06-Jun-21                                  18,786         20,246              1,292            2,382

13-Jun-21                                  20,183         21,352              1,055            2,516

20-Jun-21                                  20,751         21,896               835             2,547

27-Jun-21                                  21,561         22,451               754             2,600

04-Jul-21                                  21,018         21,908              1,016            2,586

11-Jul-21                                  21,920         22,766               814             2,777

Independent Electricity Sy stem Operator | Public                                             8
Nor mal Peak   Extreme Peak      Load Forecast   Nor mal Energy
Week Ending                                ( M W)         ( M W)   Uncertainty (MW)   Demand (GWh)

18-Jul-21                                  21,936         24,006               838             2,789

25-Jul-21                                  22,018         24,098              1,035            2,804

01-Aug-21                                  22,103         24,098               841             2,800

08-Aug-21                                  21,484         24,006               958             2,687

15-Aug-21                                  21,716         24,177               985             2,812

22-Aug-21                                  21,870         24,375              1,362            2,794

29-Aug-21                                  21,234         22,404              1,413            2,658

05-Sep-21                                  20,706         22,055              1,370            2,630

12-Sep-21                                  20,929         21,706               680             2,573

19-Sep-21                                  19,676         21,219               781             2,485

26-Sep-21                                  18,637         20,922               420             2,440

03-Oct-21                                  17,930         20,197               554             2,386

10-Oct-21                                  16,705         17,003               786             2,340

17-Oct-21                                  16,764         17,157               507             2,316

24-Oct-21                                  16,887         17,472               392             2,380

31-Oct-21                                  17,049         17,788               318             2,415

07-Nov -21                                 17,166         17,962               416             2,432

14-Nov -21                                 18,419         18,629               601             2,503

21-Nov -21                                 18,790         19,393               342             2,589

28-Nov -21                                 19,240         20,183               607             2,639

05-Dec-21                                  19,677         20,425               409             2,727

12-Dec-21                                  20,114         20,920               555             2,774

19-Dec-21                                  20,077         20,883               690             2,788

26-Dec-21                                  20,478         21,116               362             2,810

02-Jan-22                                  19,555         20,812               528             2,698

Independent Electricity Sy stem Operator | Public                                             9
4. Resource Adequacy

   The IESO expects to have sufficient generation supply for winter 2020/2021, accounting for zonal
   transmission constraints. Potential risks in summer 2020 and summer 2021 are expected to be mitigated
   by outage rescheduling.

This section assesses the adequacy of resources to meet the forecast demand. Resource adequacy is one of
the reliability considerations used for approving outages. When reserves are below required levels, with
potentially adverse effects on the reliability of the grid, the IESO will reject outage requests based on their
order of precedence. Conversely, when reserves are above required levels, additional outages can be
contemplated, provided other factors – such as local considerations, operability or transmission security – do
not pose a reliability concern. In those cases, the IESO may place an outage at risk, signaling to the facility
owner to consider rescheduling the outage.

The existing installed generation capacity is summarized in Table 4-1. This includes capacity from new
facilities that have completed the IESO’s market registration process since the previous Outlook. The forecast
capability at the Outlook peak is based on the firm resource scenario, which includes resources currently in
commercial operation, and takes into account deratings, planned outages and an allowance for capability
levels below rated installed capacity.

Table 4-1 | Existing Grid-Connected Resource Capacity

                                                For ecast Capability Forecast Capability
                          T otal Installed         at O utlook Peak    at O utlook Peak       Number C hange in Number    C hange in Installed
Fuel Type                 C apacity (MW)     Nor mal Weather (MW) [ Extreme] (MW)          of Stations      of Stations             C apacity

Nuclear                            13,009                    11,223              10,681             5                0                      0

Hy droelectric                      9,065                     5,187               4,086            76                0                      0

Gas/Oil                            11,270                     9,333               8,963            32                0                      0

Wind                                4,486                       634                 634            39                0                      0

Biofuel                               295                       286                 261             7                0                      0

Solar                                 478                        64                  64            10                0                      0

Demand Measures                         -                       586                 586             -                 -                     -

Firm Imports (+) /
Exports (-) (MW)                        -                       -15                 -15             -                 -                     -

Total                           38,603                     27,298             25,259            169                  0                      0

Independent Electricity Sy stem Operator | Public                                                                                     10
4.1 Assessment Assumptions
4.1.1 Generation Resources
All generation resources scheduled to come into service, be upgraded or be shut down within the Outlook
period are summarized in Table 4-2. This includes generation projects in the IESO’s connection assessment
and approval process (CAA), those under construction, and contracted resources. Details regarding the IESO’s
CAA process and the status of these projects can be found on the Application Status section of the IESO
website.
The estimated effective date column in Table 4-2 indicates when the market registration process is expected
to be complete for each generation resource, based on information available to the IESO as of June 1, 2020.
Two scenarios are used to describe project risks:
The planned scenario assumes that all resources scheduled to come into service are available over
the assessment period.
The firm scenario assumes resources are restricted to those that have reached commercial
operation status at the time this assessment was completed.
Planned shutdowns or retirements of generators that have a high certainty of occurring are considered for
both scenarios.
Table 4-2 | Committed Generation Resources Status
C apacity Considered
Estimated Fir m P lanned
P r oject Name Zone Fuel Type Effective Date P r oject Status ( M W) ( M W)
H env ey Inlet Wind F arm E ssa Wind 2020-Q 3 C ommissioning 0 300
Romney Wind E nergy C entre West Wind 2020-Q 4 C ommissioning 0 60
C alstock N ortheast Biofuel 2020-Q 4 E xpiring C ontract -38 -38
Iroquois F alls N ortheast G as 2021-Q 4 E xpiring C ontract -131 -131
T otal -1 69 191
N otes on Table 4-2:
The total may not add up due to rounding and does not include in-serv ice facilities. P roject status prov ides an indication of the project progress,
using the follow ing terminology :
• U nder Dev elopment – projects in approv als and permitting stages (e.g., env ironmental assessment, municipal approv als, IE S O connection
assessment approv als) and projects under construction
• C ommissioning – projects undergoing commissioning tests w ith the IE S O
• C ommercial O peration – projects that hav e achiev ed commercial operation status under the contract criteria, but hav e not met all of the IE S O ’s
market registration requirements
• E xpiring C ontract – contracts that w ill expire during the O utlook period are included in both scenarios only up to their contract expiry date.
G enerators (including non-utility generators) that continue to prov ide forecast output data are also included in the planned scenario for the rest of
the 18-month period.
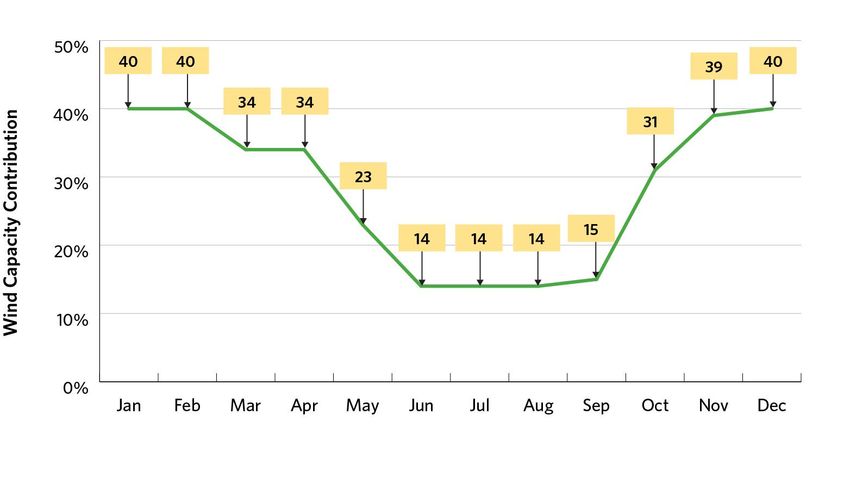
Independent Electricity Sy stem Operator | Public 114.1.2 Generation Capability Hydroelectric A monthly forecast of hydroelectric generation output is calculated based on median historical value s of hydroelectric production and contribution to operating reserve during weekday peak demand hours. Through this method, routine maintenance and actual forced outages of the generating units are implicitly accounted for in the historical data (see the first row in Table 4-3). To reflect the impact of hydroelectric outages on the reserve above requirement (RAR) and allow the assessment of hydroelectric outages as per the outage approval criteria, the hydroelectric capability is also calculated, without accounting for historical outages (see the second row of Table 4-3). Table 4-3 uses data from May 2002 to March 2020, which are updated annually to coincide with the release of the Q2 Outlook. Table 4-3 | Monthly Historical Hydroelectric Median Values for Normal Weather Conditions M onth Jan Feb Mar A pr May Jun Jul A ug Sep Oct Nov Dec H istorical H y droelectric M edian 6,327 6,266 6,068 6,021 6,116 5,940 5,790 5,431 5,227 5,600 5,851 6,312 C ontribution (M W) H istorical H y droelectric M edian C ontribution 6,835 6,854 6,593 6,542 6,561 6,427 6,238 5,998 6,068 6,430 6,601 6,815 w ithout O utages (M W) Thermal Generators Thermal generators’ capacity, planned outages and deratings are based on market participant submissions. Forced outage rates on demand are calculated by the IESO based on actual operational data. The IESO will continue to rely on market participant-submitted forced outage rates for comparison purposes. Wind For wind generation, monthly wind capacity contribution (WCC) values from the weekday peak time are used. The process for determining wind contribution can be found in the Methodology to Perform the Reliability Outlook. Figure 4-1 shows the monthly WCC values, which are updated annually with the release of the Q2 Outlook. Independent Electricity Sy stem Operator | Public 12
Figure 4-1 | Monthly Wind Capacity Contribution Values

Solar
For solar generation, monthly solar capacity contribution (SCC) values are used from the weekday peak time.
Information on how the solar contribution is calculated can be found in the Methodology to Perform the
Reliability Outlook. Figure 4-2 shows the monthly SCC values, which are updated annually for the release of
the Q2 Outlook.

The grid demand profile has been changing, due in part to the increasing penetration of embedded solar
generation, which is pushing summer peaks to later in the day. As a result, the contribution from grid-
connected solar resources has declined at the time of peak Ontario demand.

Independent Electricity Sy stem Operator | Public                                                             13
Figure 4-2 | Monthly Solar Capacity Contribution Values

4.1.3     Demand Measures
Both demand measures and load modifiers can impact demand, but differ in how they are treated within the
Outlook. Demand measures, such as dispatchable loads and demand response procured through the IESO’s
capacity auction, are not incorporated into the demand forecast and are instead treated as resources. Load
modifiers are incorporated into the demand forecast. The impacts of activated demand measures are added
back into the demand history prior to forecasting demand for future periods.

4.1.4     Firm Transactions
Capacity-Backed Export
The IESO allows Ontario resources to compete in the capacity auctions held by certain neighbouring
jurisdictions, but only if Ontario has adequate supply. Capacity-backed exports of 15 MW installed capacity
were successful in the New York Independent System Operator (NYISO) auctions for delivery between May
and October 2020.

System-Backed Exports

As part of the electricity trade agreement between Ontario and Quebec, Ontario will supply 500 MW of
capacity to Quebec each winter from December to March until 2023. In addition, Ontario will receive up to
2.3 TWh of clean energy annually, scheduled economically via Ontario’s real-time markets. The imported

Independent Electricity Sy stem Operator | Public                                                             14
energy will target peak hours to help reduce greenhouse gas emissions in Ontario. The agreement includes
the opportunity to cycle energy.

As part of this capacity exchange agreement, Ontario can call on 500 MW of capacity during summer before
September 2030, based on the province’s needs. Ontario does not expect to call on this capacity during this
18-month period.

4.1.5     Summary of Scenario Assumptions
To assess future resource adequacy, the IESO must make assumptions about the amount of available
resources. The Outlook considers two scenarios: a firm scenario and a planned scenario.

The starting point for both scenarios is the existing installed resources shown in Table 4-1. The planned
scenario assumes that all resources scheduled to come into service are available over the assessment period.
The firm scenario considers only those resources that have reached commercial operation status as of the
time of this assessment. Generator-planned shutdowns or retirements that have a high certainty of occurring
are considered for both scenarios. They also both reflect planned outages submitted by generators. Table 4-4
shows the available resources that are forecast for the 18 months, under the two scenarios in normal weather
conditions, at the time of the summer and winter peak demands during the Outlook.

Table 4-4 | Summary of Available Resources under Normal Weather

                                                                Summer Peak 2020       Winter P eak 2020/2021           Summer Peak 2021

                                                                Fir m      P lanned         Fir m         P lanned      Fir m     P lanned
Notes        Description
                                                             Scenar io    Scenar io      Scenar io       Scenar io   Scenar io   Scenar io

1            Installed Resources (M W)                          38,603       38,903         38,603         38,963       38,603     38,963

2            Total Reductions in Resources (M W)                11,876       12,133         11,194         11,433       12,322     12,631

3            Demand M easures (M W)                               586           586            700            700          28             28

4            F irm Imports (+) / E xports (-) (M W)                -15           -15          -500            -500           0              0

5            A v ailable Resources (M W)                        27,298       27,341         27,609         27,730       26,309     26,360

6            Bottling (M W)                                          0            0            647            671            0              0

7            A v ailable Resources w ithout Bottling (M W)      27,298       27,341         28,256         28,401       26,309     26,360

Notes on Table 4-4:

1. Installed Resources: The total generation capacity assumed to be installed at the time of the summer and winter peak s.
2. Total Reductions in Resources: The sum of deratings, planned outages, limitations due to transmission constraints and allowances for
capability lev els below rated installed capacity .
3. Demand Measures: The amount of demand expected to be av ailable for reduction at the time of peak .
4. Firm Imports/Exports: The amount of expected firm imports and exports at the time of summer and winter peak s.
5. Av ailable Resources: Installed Resources (line 1) minus Total Reductions in Resources (line 2) plus Demand Measures (line 3) and Firm
Imports/Exports (line 4). This differs from the Forecast Capability at Sy stem Peak shown in Table 4-1 due to the impacts of generation
bottling (transmission limitations).
6. Av ailable Resources without Bottling: Av ailable resources after they are reduced due to bottling.

Independent Electricity Sy stem Operator | Public                                                                                     15
4.2 Capacity Adequacy Assessment
The capacity adequacy assessment accounts for zonal transmission constraints resulting from planned
transmission outages assessed as of April 27, 2020. The generation planned outages occurring during this
Outlook period have been assessed as of June 1, 2020.
The outbreak of COVID-19 has added some uncertainty to our forecasts. The IESO will continue to provide
timely updates to these assessments as new information becomes available.
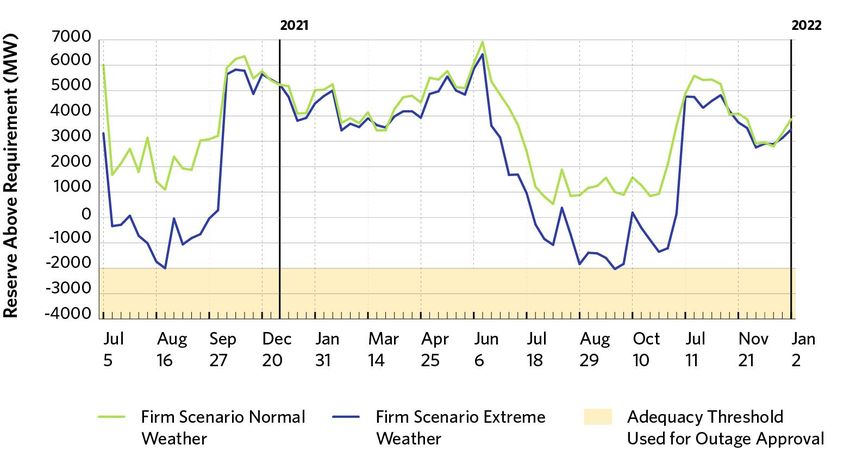
4.2.1 Firm Scenario with Normal and Extreme Weather
The firm scenario incorporates all capacity that had achieved commercial operation status as of June 1, 2020.
Figure 4-3 shows Reserve Above Requirement (RAR) levels, which represent the difference between available
resources and required resources. The latter equals demand plus the required reserve. The reserve
requirement in the firm scenario under normal weather conditions is met throughout the entire Outlook
period.
Figure 4-3 | Comparison of Normal and Extreme Weather: Firm Scenario Reserve Above Requirement
4.2.2 Planned Scenario with Normal and Extreme Weather
The planned scenario incorporates all existing capacity, as well as all capacity expected to come into service.
Approximately 360 MW of generation capacity is expected to connect to Ontario’s grid over this Outlook
period, while 169 MW of generation capacity contracts will expire, and these resources will no longer be
available to meet demand for electricity.
Independent Electricity Sy stem Operator | Public 16Figure 4-4 shows RAR levels under the planned scenario. As observed, the reserve requirement will be met
throughout the Outlook period under normal weather conditions.
Figure 4-4 | Comparison of Normal and Extreme Weather: Planned Scenario Reserve Above Requirement
4.2.3 Comparison of the Current and Previous Weekly Adequacy Assessments for the Firm Normal
Weather Scenario
Figure 4-5 compares forecast RAR values in the current Outlook with those in the previous Outlook, which
was published on March 24, 2020. The difference is primarily the result of changes in planned outages and
the expected in-service dates of new resources, as well as the removal of ICI impacts from summer 2020 (see
chapter 3).
Independent Electricity Sy stem Operator | Public 17Figure 4-5 | Comparison of Current and Previous Outlook: Firm Scenario Extreme Weather Reserve Above
Requirement
Resource adequacy assumptions and risks are discussed in detail in the Methodology to Perform the Reliability
Outlook.
4.3 Energy Adequacy Assessment
This section assesses energy adequacy to determine whether Ontario has sufficient supply to meet its
forecast energy demands, while highlighting potential adequacy concerns during the Outlook time frame. At
the same time, the assessment estimates the aggregate production by resource category to meet the
projected demand based on assumed resource availability.
4.3.1 Summary of Energy Adequacy Assumptions
The energy adequacy assessment (EAA) uses the same set of assumptions as the capacity assessment, as
outlined in Table 4-1 and Table 4-2, which indicate the total capacity of committed resources and when they
are expected to be available over the next 18 months. The monthly forecast of energy production capability,
based on energy modelling results, is included in the 2020 Q2 Outlook Tables.
For the EAA, only the firm scenario in Table 4-5 with normal weather demand is assessed. The key
assumptions specific to this assessment are described in the Methodology to Perform the Reliability Outlook.
Independent Electricity Sy stem Operator | Public 184.3.2 Results – Firm Scenario with Normal Weather
Table 4-5 summarizes the energy simulation results over the next 18 months for the firm scenario with
normal weather demand both for Ontario and for each transmission zone.
Table 4-5 | Summary of Zonal Energy for Firm Scenario Normal Weather
Zonal Energy Demand A vailable Energy on
Net Inter-Zonal on P eak Day of 18- P eak Day of
1 8 -Month Energy Demand 1 8 -Month Energy Production Energy Transfer M onth Period 1 8 -Month Period
Zone T Wh A verage MW T Wh A verage MW T Wh GWh GWh
Bruce 0.9 69 60.0 4,557 59.1 1.4 120.9
E ast 12.8 972 17.7 1,347 4.9 26.4 96.1
E ssa 12.6 956 3.5 268 -9.1 27.4 13.9
N iagara 6.1 460 20.7 1,567 14.6 15.3 53.0
N ortheast 15.7 1,190 14.1 1,067 -1.6 26.7 34.1
N orthw est 6.3 475 6.9 522 0.6 10.7 20.6
O ttaw a 20.0 1,521 0.2 17 -19.8 42.3 1.2
S outhw est 39.9 3,031 7.3 558 -32.6 91.6 19.5
Toronto 71.3 5,413 61.9 4,698 -9.4 164.3 185.4
West 21.2 1,612 14.5 1,099 -6.7 49.2 74.5
O ntar io 206.9 15,700 206.9 15,700 0.0 455.3 619.2
4.3.3 Findings and Conclusions
The EAA results indicate that Ontario is expected to have sufficient supply to meet its forecast energy needs
throughout the outlook period for the firm scenario with normal weather demand, without having to rely on
support from external jurisdictions.
The figures and tables in this section are based on a simulation of the province’s power system, using the
assumptions presented within the Outlook to confirm that Ontario will be energy adequate.
Figure 4-6 breaks down projected production by fuel type to meet Ontario’s energy demand for the next 18
months, while Figure 4-7 shows the production by fuel type for each month. The province’s energy exports
and imports are not considered in this assessment. Table 4-6 summarizes these simulated production results
by fuel type, for each year.
Independent Electricity Sy stem Operator | Public 19Figure 4-6 | Forecast Energy Production by Fuel Type
Figure 4-7 | Forecast Monthly Energy Production by Fuel Type
Independent Electricity Sy stem Operator | Public 20Table 4-6 | Ontario Energy Production by Fuel Type for the Firm Scenario Normal Weather Fuel Type 2 020 (July – December) 2 021 T otal ( Gr id-Connected) ( GWh) ( GWh) ( GWh) N uclear 40,961 76,886 117,847 H y dro 16,876 36,461 53,337 G as & O il 5,981 14,697 20,678 Wind 4,003 9,831 13,834 Bio F uel 108 220 328 O ther (S olar & DR) 239 601 840 T otal 68,168 138,695 206,864 Independent Electricity Sy stem Operator | Public 21
5. Transmission Reliability Assessment

   Ontario’s transmission system is expected to continue to reliably supply province-wide demand, while
   experiencing normal contingencies defined by planning criteria for the next 18 months. However, some
   combinations of transmission and/or generation outages could create operating challenges.

The IESO assesses transmission adequacy using a methodology based on conformance to established criteria,
including the Ontario Resource and Transmission Assessment Criteria (ORTAC), NERC transmission planning
standard TPL 001-4 and NPCC Directory #1 as applicable. Planned system enhancements and projects, and
known transmission outages are also considered in the studies.

Ontario’s transmission system is expected to continue to reliably supply province-wide demand while
experiencing normal contingencies defined by planning criteria for the next 18 months.

5.1 Transmission Projects
This section considers the information transmitters provide with respect to transmission projects that are
planned for completion within the next 18 months. The list of transmission projects is provided in Appendix
B1. Note that the planned in-service dates in this table and throughout this document are as of March 2020.
Some of these dates are expected to change as a result of the impact of the COVID-19 pandemic on project
logistics. Any changes will be communicated through subsequent Reliability Outlooks.

5.2 Transmission Outages
The IESO’s assessment of transmission outage plans is shown in Appendix C, Tables C1 to C11. The
methodology used to assess the transmission outage plans is described in the Methodology to Perform the
Reliability Outlook. This Outlook reflects transmission outage plans submitted to the IESO as of April 27,
2020. Following the start of the state of emergency in Ontario due to the COVID-19 outbreak, the IESO in
coordination with market participants, recalled all of the ongoing and planned transmission outages prior to
July 2020 to prepare for potential workforce shortages resulting from social distancing and quarantine
measures.

5.3 Transmission Considerations
The purpose of this section of the report is to highlight projects and outages that may affect the scheduling of
other outages and/or may affect reliability, and to categorize these considerations by zone.

Independent Electricity Sy stem Operator | Public                                                              22
Bruce, Southwest, and West Zones

Hydro One has begun replacing the aging infrastructure at the Bruce 230 kV switchyard, which requires
careful coordination of transmission and generation outages. This project is scheduled to be completed by Q2
2021. A series of non-contiguous planned outages will impact the flow out of Bruce from July 2020 to January
2021. Planned outages affect the following circuits: B501M, B502M, B560V, and B561M.

Significant growth in the greenhouse sector has led to a number of customer connection requests in the
Windsor-Essex region that are expected to exceed the capacity of the existing transmission system in the
area. A new switching station at the Leamington Junction is proceeding toward a Q2 2022 in-service date.
Outages may be more challenging to facilitate as new load connections are made and required transmission
reinforcements are being implemented.

Toronto, East, and Ottawa Zones

Operational challenges due to high voltages in eastern Ontario and the Greater Toronto Area continue to
occur during low-demand periods. This has been exacerbated due to business closures following the
pandemic-related quarantine measures. The IESO and Hydro One are currently managing this situation by
removing from service certain 500 kV circuits mainly in eastern Ontario and occasionally in the Bruce area
during those periods. Up to three 500 kV circuits were removed from service during instances of the lowest
demand periods in Ontario. To address this issue on a longer-term basis, two 500 kV line-connected shunt
reactors will be installed at Lennox TS with a target in-service date of Q4 2020 for the first reactor and Q4
2021 for the second reactor.

Aging circuit breakers in the Richview 230 kV switchyard are to be replaced by Q1 2021. Hydro One and the
IESO will coordinate the outages required to reduce the impact on the Flow East Toward Toronto transfer
capabilities.

Northwest, Northeast, and Essa Zones

In the Kapuskasing area, system reinforcements are planned for Q4 2021. During the construction of these
reinforcements, certain outages may be restricted.

A two-and-a-half-week breaker outage at Hanmer TS starting July 28, 2020 will reduce transfer capability
south on the North-South Tie. A one-month outage of circuit X504E starting September 28, 2020 will reduce
transfer capability of the North-South Tie.

A two-week outage in September 2020 and a four-week outage in November 2020 of circuits E510V and
E511V respectively will impact transfer capabilities between the Essa and Toronto zones.

Significant construction activities for the East West Tie reinforcement project will also occur over the Outlook
period, requiring outages to existing transmission facilities in the northwest. A two-week outage of M24L will
impact the transfer capability west across the East-West Tie starting July 6, 2020. A two-week outage of
M23L will impact the transfer capability east across the East-West Tie, starting November 9, 2020.

Independent Electricity Sy stem Operator | Public                                                               23
Interconnections

The failure of the phase angle regulator (PAR) connected to the Ontario-New York 230 kV interconnection
circuit L33P in early 2018 continues to hinder the province’s ability to import electricity from New York
through the New York-St. Lawrence interconnection and from Quebec through the Beauharnois
interconnection. This has required enhanced coordination with affected parties and more focused
management of St. Lawrence-area resources in real-time. Careful coordination of transmission and generation
outages will continue to be required in the area.

PARs are unique pieces of equipment and replacements are not readily available. Replacement options for the
unit are being investigated jointly with the IESO, Hydro One, NYISO and the New York Power Authority. The
preferred replacement option is a new PAR with a +/- 60-degree angle range, based on the recommendation
by the joint New York/Ontario team to Hydro One for tendering. The return-to-service date for the L33P PAR
is currently expected to be August 2022.

There are three outages that will reduce import and export transfer capability between Ontario and Michigan.
The first outage is a planned one-week outage starting July 26, 2020, which will impact interconnection circuit
J5D. The second outage is a planned two-week outage starting September 21, 2020, which will impact
equipment at Lambton TS. The third outage is a planned two-month outage starting January 18, 2021, which
will impact interconnection circuit J5D.

Independent Electricity Sy stem Operator | Public                                                            24
6. Operability

   During the Outlook period, Ontario will continue to experience potential surplus baseload conditions,
   much of which can be managed with existing market mechanisms, such as exports and curtailment of
   variable generation.

This section highlights existing or emerging operability issues that could impact the reliability of Ontario’s
power system.

6.1 Surplus Baseload Generation
Baseload generation is made up of nuclear, run-of-the-river hydroelectric and variable generation, such as
wind and solar. When baseload supply is expected to exceed Ontario demand, market signals reflect such
conditions through lower prices, and resources in Ontario and at the interties respond accordingly. The
resulting market outcomes may include higher export volumes, dispatching down of hydroelectric generation
and grid-connected renewable resources, and nuclear manoeuvring or shutdowns. For severe surplus
conditions that could affect the reliability of the system, the IESO may take out-of-market actions, such as
manually curtailing resources and/or imports.

Ontario will continue to experience potential surplus baseload conditions during the Outlook period. Figure 6-1
highlights the periods during which expected baseload generation may exceed forecast demand.

Independent Electricity Sy stem Operator | Public                                                                25
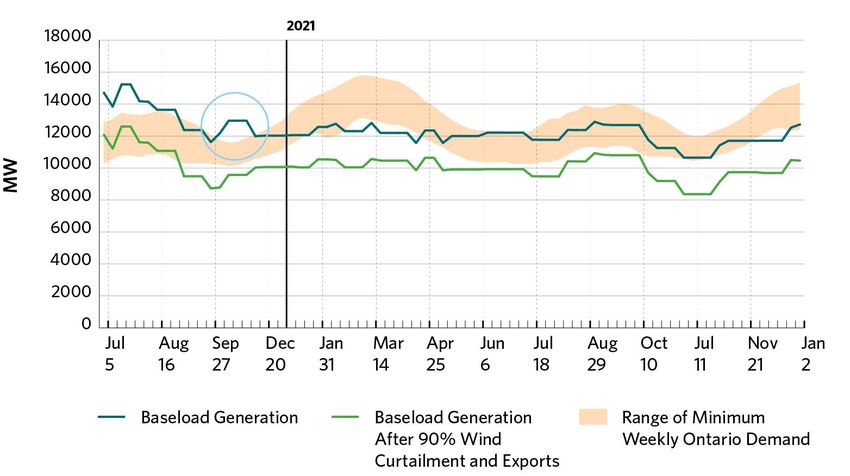
Figure 6-1 | Minimum Ontario Demand and Baseload Generation

Most of the surplus baseload conditions can be managed with existing market mechanisms signaling for
exports, and by curtailing variable and nuclear generation. Going forward, as shown in Figure 6-2, existing
mechanisms will be sufficient for managing SBG.

Independent Electricity Sy stem Operator | Public                                                             26
Figure 6-2 | Minimum Ontario Demand and Baseload Generation

The baseload generation assumptions include expected exports and run-of-river hydroelectric production, the
latest planned outage information and in-service dates for new or refurbished generation. The expected
contribution from self-scheduling and intermittent generation has been updated to reflect the latest data.
Information on the dispatch order of wind, solar and flexible nuclear resources can be found in Market Manual
4 Part 4.2. Output from commissioning units is explicitly excluded from this analysis due to uncertainty and
the highly variable nature of commissioning schedules. Figure 6-3 shows the monthly off-peak wind capacity
contribution values calculated from actual wind output up to March 31, 2020. These values are updated
annually to coincide with the release of the Q2 Outlook.

Independent Electricity Sy stem Operator | Public                                                              27
Figure 6-3 | Monthly Off-Peak Wind Capacity Contribution Values

Independent Electricity Sy stem Operator | Public                                              28
7. Resources Referenced in This Report
The table below lists additional resources in the order they appear in the report.

Table 7-1 | Additional Resources

        Resource                                                   URL                                       Location in This Report

    Reliability O utlook       http://www.ieso.ca/en/Sector-Participants/Planning-and-
         Webpage               Forecasting/Reliability -Outlook                                                     Introduction

 S ecurity and A dequacy
                               http://www.ieso.ca/power-data/data-directory                                         Introduction
       A ssessments

                               http://www.ieso.ca/-/media/files/ieso/document-library/planning-
2020 Q 2 O utlook Tables                                                                                           Throughout
                               forecasts/reliability -outlook /Reliability OutlookTables_2020Jun.xls

C onnection A ssessments       http://www.ieso.ca/en/sector-participants/connection-                         Assessment Assumptions
  and A pprov al P rocess      assessments/application-status

M ethodology to P erform       http://www.ieso.ca/-/media/files/ieso/document-library/planning-                    Throughout
 the Reliability O utlook      forecasts/reliability -outlook /Reliability OutlookMethodology2020Jun.pdf

    C apacity A uction         http://www.ieso.ca/en/Sector-Participants/Market-Operations/Markets-             Demand Measures
                               and-Related-Programs/Capacity -Auction

E nabling C apacity E xports   http://www.ieso.ca/en/Sector-Participants/Market-Renewal/Capacity -              Firm Transactions
                               Exports

  O ntario Resource and        http://www.ieso.ca/-/media/files/ieso/Document%20Library /Market-
Transmission A ssessment       Rules-and-Manuals-Library /market-manuals/mark et-administration/IMO -      Transmission Considerations
          C riteria            REQ-0041-TransmissionAssessmentCriteria.pdf

    N E RC Transmission
 P lanning S tandard TP L-     http://www.nerc.com/pa/Stand/Reliability %20Standards/TPL-001-4.pdf         Transmission Considerations
           001-4

   N P C C Directory #1        https://www.npcc.org/Standards/Directories/Directory_1_TFCP_rev_201         Transmission Considerations
                               51001_GJD.pdf

                               http://www.ieso.ca/-/media/Files/IESO/Document-Library/Market-Rules-
M arket M anual 4 P art 4.2    and-Manuals-Library /market-manuals/mark et-operations/mo-                  Surplus Baseload Generation
                               dispatchdatartm.pdf?la=en

G rid-LDC Interoperability     http://www.ieso.ca/Sector-Participants/Engagement-Initiativ es/Standing-    Distributed Energy Resources
   S tanding C ommittee        Committees/Grid-LDC -Interoperability -Standing-Committee

Independent Electricity Sy stem Operator | Public                                                                                      29
8. List of Acronyms CAA Connection Assessment and Approval CROW Control Room Operations Window DER Distributed Energy Resource DR Demand Response EAA Energy Adequacy Assessment ESAG Energy Storage Advisory Group FETT Flow East Toward Toronto GS Generating Station GTA Greater Toronto Area ICI Industrial Conservation Initiative IESO Independent Electricity System Operator IRRP Integrated Regional Resource Plan kV Kilovolt LDC Local Distribution Company MW Megawatt(s) NERC North American Electric Reliability Corporation NPCC Northeast Power Coordinating Council NYISO New York Independent System Operator ORTAC Ontario Resource and Transmission Criteria PAR Phase Angle Regulator RAR Reserve Above Requirement RAS Remedial Action Scheme SBG Surplus Baseload Generation SCC Solar Capacity Contribution TS Transmission/Transformer Station TWh Terawatt-hour(s) WCC Wind Capacity Contribution Independent Electricity Sy stem Operator | Public 30
Independent Electricity
System Operator
1600-120 Adelaide Street West
Toronto, Ontario M5H 1T1
Phone: 905.403.6900
Toll-free: 1.888.448.7777
E-mail: customer.relations@ieso.ca

ieso.ca
    @IESO_Tweets
   facebook.com/OntarioIESO
   linkedin.com/company/ieso
You can also read