Bare Point Water Treatment Plant & Distribution Subsystem - Revised November 16, 2014
←
→
Page content transcription
If your browser does not render page correctly, please read the page content below
Bare Point
                     Water Treatment Plant & Distribution Subsystem

    Revised
November 16, 2014
    TB67(rev11/14)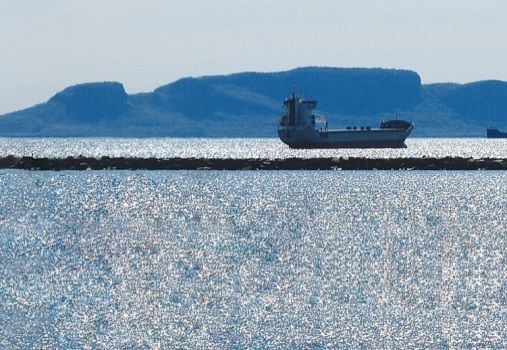
CITY OF THUNDER BAY CORROSION CONTROL PLAN

                                                                       Table of Contents

 EXECUTIVE SUMMARY ........................................................................................................................................................... 1

    LEAD TESTING RESULTS ...................................................................................................................................................... 2

   OVERVIEW OF CORROSION CONTROL PLAN ....................................................................................................................... 2

 1.0 INTRODUCTION & DRINKING WATER SYSTEM DESCRIPTION
    1.1 SYSTEM DESCRIPTION................................................................................................................................................... 4
        1.1.1 PROCESS DIAGRAM ............................................................................................................................................ 5-6
        1.1.2 OVERVIEW OF SYSTEM COMPONENTS ................................................................................................................. 7
        1.1.3 DISTRIBUTION SYSTEM / PRESSURE ZONE MAP ................................................................................................... 8
        1.1.4 PRESSURE ZONE DESCRIPTION .............................................................................................................................. 9
   1.2 SOURCE WATER SUPPLY INFORMATION & CHARACTERISTICS ................................................................................... 10
            1.2.1 SOURCE WATER CHARACTERISITCS ................................................................................................................ 10
  1.3 TREATMENT FACILITY INFORMATION & CHARACTERISTICS ........................................................................................ 10
            1.3.1 OVERVIEW OF TREATMENT CAPACITY ........................................................................................................... 10
            1.3.2 TREATMENT TARGETS .................................................................................................................................... 10
            1.3.3 OVERVIEW OF TREATED WATER QUALITY...................................................................................................... 11
  1.4 DISTRIBUTION SYSTEM INFORMATION & CHARACTERISTICS ...................................................................................... 11
        1.4.1 OVERVIEW OF DISTRIBUTION WATER QUALITY .................................................................................................. 11
  1.5 SUMMARY OF LEAD SERVICE LINE REPLACEMENT PROGRAM .................................................................................... 12

2.0 IDENTIFICATION OF INTERNAL CORROSION CONTROL PROBLEMS & SOURCES OF CONTAMINATION
        2.1 PREMISE PIPING – MAY 2007 DIRECTORS ORDERS ................................................................................................ 12
        2.2 LEAD RESULT, FLUSHED SAMPLE CUSTOMERS TAP & FIELD RESULTS MAY 7, 2007.............................................. 12
        2.3 PREMISE PIPING – SCHEDULE 15.1-7................................................................................................................. 13-17
        2.4 RESULTS ROUND 2 FLUSHED SAMPLE .................................................................................................................... 18
        2.5 WATER QUALITY SAMPLES ..................................................................................................................................... 18
            2.5.1 BACTERIOLOGICAL SAMPLING SITES .............................................................................................................. 18

 3.0 ASSESMENT OF SIGNIFICANCE OF CONTAMINANTS & SOURCES
        3.1 METALS RESULTS ............................................................................................................................................... 18-19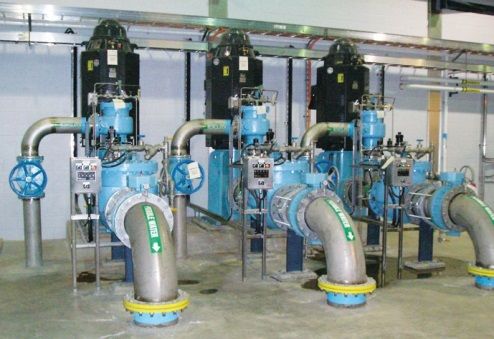
CITY OF THUNDER BAY CORROSION CONTROL PLAN

4.0 IDENTIFICATION OF ALTERNATE CHEMICAL CORROSION CONTROL MEASURES & THEIR IMPACTS ........................ 19-20
        4.1 CHEMICAL LIFE CYCLE COSTS.................................................................................................................................. 21
        4.2 LIFE CYCLE COSTS.................................................................................................................................................... 21

5.0 IDENTIFICATION OF PREFERRED MEASURE OF CHEMICAL CORROSION CONTROL ................................................... 21-22
        5.1 pH vs SODIUM HYDROXIDE RESULTS...................................................................................................................... 23
        5.2 pH vs SODIUM HYDROXIDE ADDITION ................................................................................................................... 23
        5.3 SECONDARY IMPACTS ............................................................................................................................................ 24

6.0 PUBLIC NOTIFICATION & STAKEHOLDER CONSULTATION
        6.1 TYPES OF MEDIA TO BE CONTACTED .............................................................................................................. 24

7.0 MONITORING CORROSION CONTROL EFFECTIVENESS ........................................................................................... 24
        7.1 RECOMMENDED PARAMETERS & LOCAITONS FOR POST CHEMICAL IMPLEMENTATION MONITORING
        ...................................................................................................................................................................................... 25

8.0 CORROSION CONTROL PLAN IMPLEMENTATION
        8.1 CORROSION CONTROL PLAN IMPLEMENTATION ........................................................................................... 25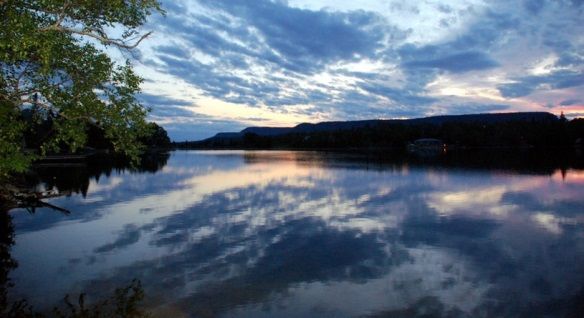
CITY OF THUNDER BAY CORROSION CONTROL PLAN

EXECUTIVE SUMMARY

The Environment Division Water Authority operates the Bare Point Water Treatment Plant and Distribution Subsystem
on behalf of the City of Thunder Bay. In accordance with Schedule 15.1-11 O.Reg170/03 the City of Thunder Bay
Corrosion Control Plan was approved on May 16, 2011. The following Corrosion Control Plan (CCP) includes revisions to
the original document with consultation and approval from the Ministry of the Environment’s Approvals and Licensing
Section and is designed to ensure compliance with the regulations.

The purpose of the CCP is to provide an overview of the following:

    1.   Overview of the Drinking Water System
    2.   Identification of internal corrosion problems and sources of contamination
    3.   Assessment of the significance of the contaminants
    4.   Identification of alternative corrosion control measures and their impacts
    5.   Preferred measures including rationale
    6.   Public notifications
    7.   Monitoring of the effectiveness of the plan
    8.   Corrosion control implementation

The Bare Point Water Treatment Plant treats approximately 45 million liters of water per day from Lake Superior
utilizing a Zeeweed 1000v3 membrane filtration system. Sodium Hypochlorite is used for disinfection in Pre Treatment,
Post Treatment, as well as residual maintenance in the Distribution System. The treated water is described as being soft
(alkalinity avg. **40 mg/L as CaC03) and the treated water pH averages **7.90. Treated water temperature varies from
**1°C in the winter months to **11°C in the summer. The distribution system consists of approximately 719 km of
water main with 47% unlined cast, 27% Ductile Iron, 10% PVC, 5% concrete and 1% HDPE. The Municipality does not
purchase water from another system. The City of Thunder Bay is both the Owner and Operating Authority of the
Drinking Water System.

** 2009 Statistics

1|P a g e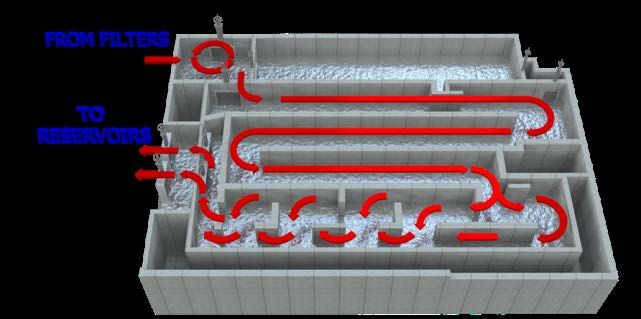
CITY OF THUNDER BAY CORROSION CONTROL PLAN
LEAD TESTING RESULTS
Using results from the first 5 rounds of testing under schedule 15.1-4 it was determined that the City of Thunder Bay
would be required to develop a corrosion control plan. All 5 rounds determined that more than 10% of plumbing
samples exceeded the 10 ug/L limit for lead. Below summarizes all 14 rounds of lead sampling from 2008-2014.

                                    S u m m a ry o f R e s u l t s o f R o u n d 1 - 14
                                            Number
                                                       Number       Number of     Number of
                                               of                                                  % of sample
                                                          of        individual     Sampling
Contaminant      Source        Location     individu                                              points with an   Min   Max
                                                       Sampling      Sample      Points with an
                                               al                                                  Exceedance
                                                        Points     Exceedances    Exceedance
                                            Samples
                 Lake
Lead ug/L                        Tap
               Superior                      2317       1137          433            283             24.89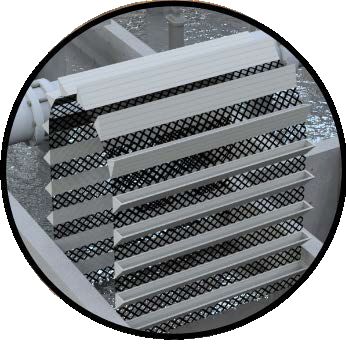
CITY OF THUNDER BAY CORROSION CONTROL PLAN
    •   Update City of Thunder Bay website to clarify homeowner responsibilities and City of Thunder Bay
        responsibilities when replacing lead service line. Provide link to permit applications in Planning Department and
        link to Priority Lead Water Service Replacement Form.
    •   Increase person to person communication with respect to lead service replacement and testing.
    •   Inter-departmental communication to spread the “Get the Lead Out” campaign with Water Meter Shop.
    •   Provide private plumbing contractors with information pamphlet “Get the Lead Out” to assist in public
        awareness
    •   Include TBDHU and MOE in public awareness campaign through risk assessment committee.
    •   Private plumbing sampling to follow OReg170/03 s. 15.1, along with a third flushed plumbing sample to
        determine effectiveness of flushing. Homeowner provided with these results.
    •   Annual review of CCP progress / effectiveness.

2014 Corrosion Control through Chemical Addition
Corrosion control through chemical addition will be considered as a last measure to reduce levels of lead at the tap. This
decision will be based on a review of the success in reducing the amount of lead service lines and fixtures connected to
the distribution system and the promotion of public awareness on water quality. The final decision to use chemical
addition will be based on reviewing the success of lead service line replacement and discussing these results with the
local Ministry of Health and Ministry of Environment. The City of Thunder Bay approaches corrosion control with the
goal of lead service replacement, which removes lead sources that come into contact with drinking water, as to
minimize risk to the safety of the drinking water. This process of lead removal / replacement will take time and
cooperation from the public. Based on a review of historical data, the 1996 Chemical Corrosion Control Study as well as
the community lead testing program it has been determined that corrosion control by products that will need to be
monitored or controlled include lead, copper iron, zinc and manganese.

Utilization of the 1996 corrosion study performed by the City of Thunder Bay in conjunction with the Ministry of
Environment and McMaster University determined that the most effective form of chemical corrosion control would be
the use of sodium hydroxide. With the expansion of the Bare Point Water Treatment Plant provisions were
implemented to include sodium hydroxide and are included in drinking Water Works Permit # 024-021. In order to
reduce lead levels within premise plumbing it has been determined that pH adjustment will need to be between 9.0 and
9.6 in order to ensure effectiveness. Since the raw source water pH averages 7.87, the addition of sodium hydroxide
does raise concern since the pH will need be increased to 9.0-9.6 to control corrosion. Raising the pH within this range
may compromise the effectiveness of the sodium hypochlorite. For this reason, the addition of sodium hydroxide for
the purpose of corrosion control will commence in a phased approach. A localized designated area of The City of
Thunder Bay – Current River has been selected as a test area.

All homes in this area with known lead services will be issued a lead information pamphlet with the opportunity to
request sampling. Baseline lead sampling will occur December 15, 2014 through April 15, 2015 and June 15, 2015
through Oct 15, 2015 for the Current River section of the city. Additional samples to be collected include chlorine
residual, alkalinity, temperature, colour, hardness, conductivity, turbidity, copper, iron and microbiological. These will
be collected in conjunction with corresponding lead plumbing and distribution samples.

Starting December, 2015 sodium hydroxide will be added to the Current River area at the entry point of Hodder
pumping station. The second phase of lead sampling will follow the addition of chemical at the same locations that were
sampled prior to the addition – December 15, 2015 through April 15, 2016 and June 15, 2016 through October 15, 2016.
3|P a g e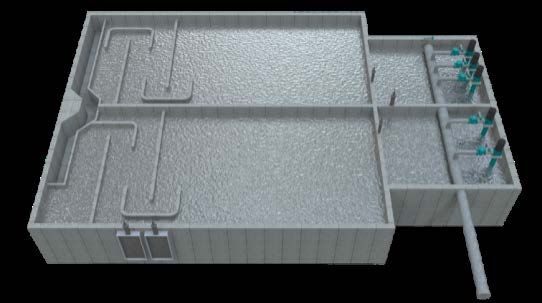
CITY OF THUNDER BAY CORROSION CONTROL PLAN
Additional samples for chlorine residual, alkalinity, temperature, colour, hardness, conductivity, turbidity, copper, iron
and microbiological will also be collected in conjunction with all lead plumbing and distribution samples taken. Once
sampling is complete, results from all rounds will be compared.

1.0 INTRODUCTION AND DRINKING WATER SYSTEM DESCRIPTION

1.1 System Description

Raw water is fed to the plant by gravity through three intake lines approximately one km from the shore line.

Traveling screens remove debris and particles from the raw water where it enters the plant. After the screens, Sodium
Hypochlorite is added to reduce the growth potential and reduce the formation of biofilm. Low lift pumps move this
water through a 900mm pipe to the Membrane Filtration building. Here water is pulled through the Zeeweed 1000v3
membrane filtration system using vacuum pressure. After filtration, the water travels to the final stage of the process,
the clear well area, where Sodium Hypochlorite is added for primary disinfection. The combination of the clear well and
reservoir creates the CT and Log removal required.

Two 2 ML storage reservoirs hold the water before transfer to the distribution system. The Bare Point Water Treatment
Plant produces an average of 45 million litres of water per day. The plant has the capacity to produce 113.5 million litres
per day.

4|P a g e
CITY OF THUNDER BAY CORROSION CONTROL PLAN
1.1.1 Process Diagram
Lake to Lake approach for Safe Drinking Water
Step
Step1:1: Source Water
Source Water
Our drinking water
Our drinking water starts with
starts thethe
with world’s largest
world’s source
largest sourceof of
freshwater,
fresh water, Lake
Lake Superior.
Superior. TheThe intake
intake forfor
thethe plant
plant is located
is located
nearly 1km from the shoreline and is positioned
nearly 1km from the shoreline and is positioned at a water at a water
depth of approximately 18 metres and rests approximately 9
depth of approximately 18 metres and rests approximately 9
metres above the lake bottom. The depth of the intake
metres above
protects the lake
it from bottom.
debris Thefrom
entering depththeofbottom
the intake
of the lake
protects it from debris entering
and from the water surface. from the bottom of the lake
and from the water surface.
Step
Step2: Screening
2: Screening
The
The rawraw water
water enters
enters thethe plant
plant through
through the the intake.
intake. Traveling
Traveling
screens
screens remove
remove debris
debris andand particles
particles fromfrom entering
entering the and
the plant plant
and the raw water is stored briefly in the wet
the raw water is stored briefly in the wet well. The screens arewell. The
screens are similar to common household window screens,
similar to common
although they arehousehold
made from window screens,
stainless steel.although
Low lift they are
pumps
made
thenfrom stainless
lift the watersteel.
throughLowthelift pumps then
plant and liftthere
it is the water
that
sodiumthe
through hypochlorite
plant and itisisinitially
there thatadded to help
sodium discourage
hypochlorite is
biological
initially added growth in discourage
to help the plant. biological growth in the plant.
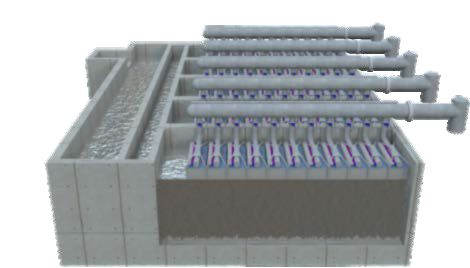
Step 3: Filtration
Step
The 3: Filtration
water is then pulled through the Zeeweed membrane
The water is thenusing
filtration system pulled through
vacuum the Zeeweed
generated frommembrane
pumps.
filtration system using vacuum generated from pumps.
Hollow fibre ultrafiltration membranes use gentle suction to
Hollow fibre ultrafiltration membranes use gentle suction to
filter
filterimpurities
impuritiesfrom
from the
the water.
water.
5|P a g e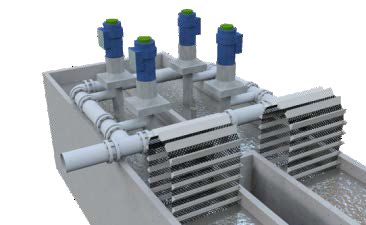
CITY OF THUNDER BAY CORROSION CONTROL PLAN

                  Step 4: Disinfection
                  The clearwell is used for primary disinfection as described by
                  the Ministry of the Environment. Sodium hypochlorite is
                  added to the water in the clearwell mixing chamber. The
                  clearwell uses a baffling system to allow the sodium
                  hypochlorite to mix with the water. This creates a long
                  contact time or soaking time for the water to mix with the
                  hypochlorite. Contact time is a measurement of the
                  concentration of the sodium hypochlorite multiplied by
                  the time traveled in the clearwell.

                  Step 5: Storage
                  The clean safe disinfected drinking water is then stored at the
                  plant in two underground storage tanks to keep the water
                  cool and fresh awaiting delivery to customers taps. Each
                  reservoir can hold over two million litres of water.

                   Step 6: Water Delivery
                   Water is pumped from the storage reservoirs into the
                   distribution system by high lift pumps. Some of the
                   water is delivered directly to customer taps and some
              wat
              is
                   delivered to one of five storage reservoirs within the
              dist distribution system.

                  Step 7: Environmental Protection
                  Wastewater from the membrane filtration process is piped to
                  the Atlantic Avenue Water Pollution Control Plant for
                  processing before being returned clean to Lake Superior.

6|P a g e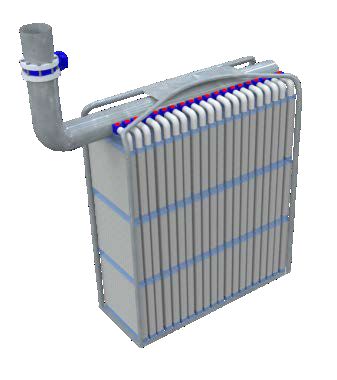
CITY OF THUNDER BAY CORROSION CONTROL PLAN

1.1.2 Overview of System Components

The system consists of:

    •   1 Water Treatment Plant
    •   1 Water Test Area
    •   5 Water Storage Facilities
    •   8 Water Pumping Stations
    •   8 Water Pressure Zones
    •   719 Kilometers of Water mains The water distribution pipe system is made up of approximately 47% unlined
        Cast Iron, 27% Ductile Iron, 10% PVC, 5% concrete, 4% lined Cast Iron, 4% steel, 2% Asbestos Cement and 1%
        HDPE
   •    2,495 Industrial/Commercial/Institutional Service Connections
   •    3,402 Fire Hydrants
   •    9,212 Valves
   •    36,732 Residential Water Service Connections

7|P a g e
CITY OF THUNDER BAY CORROSION CONTROL PLAN
1.1.3 Distribution System/Pressure Zone
Hodder
Standpipe
COPE NH AGE N R D
DAWS
ON HODDER ZONE BARE POINT WATER
Bare Point Water
Treatment Plant
TREATMENT PLANT
RD
HODDER ZONE
HILLDA LE RD
Hazelwood Water
Storage Facility McIntyre Pumping
Station & Water
HOD DE R AVE
Storage Facility AR UN D EL
ST
LY
O
N
B
LV
Hodder Avenue
D
Pumping Station
CU YLER S T
ZONE 3N
BA LSAM ST
ST
A
IN
SS
FA
RIV
VA
RED
ZONE 2A
ER
L
ST
Chamberlain
LE
NEW ZONE 2A
RIV
Y
JOH N ST. R D
ST
ER
RI
S VE
RD
AY
Pumping Station
E R
AV
W
ST
SS
T
NO
RE
JU
ZONE 2N
P
EX
AY
B
ER
JO
ND
H NS
U
T
TH
OLIVE R R D
ST
Duke Street Water
R
TE
WA
OLIVE R R D
Storage Facility
GOLF LINK S RD
A L AV E
CEN TR
D
CEN TRA L AV E
MR
ZONE 1N
L IA
James Street Pump-
IL
TW
RES SWAY
BA LMORA L ST
HA RB OUR EXP
FO R
ing Station JA MES ST
N
EDWA RD ST N
Vickers Street
AR THU R ST W
VICTORIA AV E W VICTORIA AV E E
AR THU R ST E
Pumping Station
S
E
JA MES ST S
EDWA RD ST S
AV
E
AT
WA LSH S T E
IC
ND
SY
FOR D S T S
ZONE 2S ROSS LYN R D
GOR E ST W
Rockcliff Water ZONE 1S
Storage Facility
Broadway Avenue
Pumping Station WATERMAIN
Y
W
H
61
NEEBING ZONE
NEEBING ZONE
Neebing Booster
Pumping Station
8|P a g e
T H U N D E R B AY WAT E R Q UA L I T Y 2 0 1 3 A N N UA L R E P O R TCITY OF THUNDER BAY CORROSION CONTROL PLAN
1.1.4 Pressure Zone Description
Thunder Bay’s water distribution system is divided into Zone 2A
seven pressure zones (see map previous page).High lift
The Duke Street Reservoir stores water for this zone. It
pumps move the treated water from the plant into the
was added to increase and maintain water pressure for
distribution system. The water storage facilities and
this area.
pumping stations regulate water pressure within the
distribution system. Water can be redirected through Zone 2N
the distribution system when needed. The system is
The McIntyre Reservoir stores water for this zone.
made up of the following components:
Water is pumped from the Bare Point Water Treatment
Standpipe – Above-ground water storage facility Plant through the Chamberlain Pumping Station to this
providing pressure by water column height zone.
Reservoir – Large volume in-ground water storage
facility Zone 3N
Pumping Station – Pumps water from one zone into The Hazelwood Standpipe stores water for this zone.
another zone and can be used to increase water Water is pumped from the Bare Point Water Treatment
pressure to an area Plant through the Chamberlain Pumping Station to the
McIntyre Reservoir. The McIntyre Pumping station
Water Pressure Zone – Areas where a minimum and supplies water to the Hazelwood Standpipe.
maximum water pressure can be expected in water
distribution system Zone 1S
Zone 1N The Rockcliff Reservoir stores water for this zone.
Water is pumped from the Bare Point Water Treatment
The reservoirs at the Bare Point Water Treatment Plant Plant through the Vickers and
store water for this zone and pump it into this area as
needed. The Duke Street Reservoir also provides water James Street Pumping Stations filling the Rockcliff
storage for this zone. Reservoir and supplying water to the area.
Hodder Zone Zone 2S
The Hodder Standpipe stores water for this zone. Water Water is pumped from the Broadway Avenue Pumping
is pumped from the Bare Point Water Treatment Plant Stations to this zone. Water is drawn from the Zone 1S
to the Hodder pumping station. This station supplies water distribution system, which includes the Rockcliff
water to the Standpipe as needed. Approximately 165 Reservoir.
properties were converted from Zone 1 water pressure
Neebing Zone
zone. The work included relocation of check valves in
the distribution system combined with installations of Water is drawn into this zone from the Zone 2S
pressure reducing valves and expansion tanks. Original distribution system. The Neebing Booster Pumping
water pressures of 40-50 p.s.i. have been improved to a Station increases water pressure for this zone.
constant 60 p.s.i.
9|P a g eCITY OF THUNDER BAY CORROSION CONTROL PLAN
1.2 Source Water Supply Information and Characteristics
The Bare Point Water Treatment Plant treats its water from Lake Superior and is a single source system. The
following table describes the source water characteristics utilizing 2013 data.
1.2.1 Source Water Characteristics – Lake Superior
Characteristics Result – 2013 Averages
pH 7.8
Alkalinity (mg/L as CaCO3) 30.7
Conductivity (umho/cm) 97.4
Hardness(mg/L as CaCO3) 42.1
Chloride (mg/L) 1.10
Turbidity NTU 1.0
Color (True) 5.3
Temperature ‘C 5.52
Sodium (Na) Total 2.00
Calcium (Ca) Total 13.88
1.3 Treatment Facility Information and Characteristics
Typical flow rates, rated capacities, chemicals used etc. are listed in Tables 1.3.2 and 1.3.3. A flow diagram is
supplied in Figure 1.1.1 under system description. The Bare Point Water Treatment Plant and Distribution
Subsystem is operated 24hrs per day 7 days per week.
1.3.1 Overview of Treatment Capacity
Rated Capacity Flow (m3/d)
Treatment Facility Source
(m3/d) Average Maximum
Bare Point Water
Lake Superior 113.5 45 70.45
Treatment Plant
1.3.2 Treatment Targets
Sodium Hypochlorite pH Adjustment
Facility Target Residual in
Free Chlorine Chemical Dose Target pH
Treated Water
Bare Point Water
Free 1.4 Sodium Hydroxide TBD 9-9.6
Treatment Plant
TBD – To Be Determined
10 | P a g eCITY OF THUNDER BAY CORROSION CONTROL PLAN
1.3.3 Overview of Treated Water Quality
Treated water characteristics related to lead release and lead control are summarized in Table 1.3.4. The pH of
treated water varied between 7.47 and 8.29 in 2009.
Bare Point Water Treatment Plant Point Entry to Distribution System
Parameter
Average Minimum to Maximum
pH 7.90 7.47 to 8.29
Alkalinity, mg/L as CaCO3 40.7 32 to 44
Temperature °C 4.36 1 to 11
Chlorine Residual, mg/L 1.79 1.61-1.94
Conductivity, μmhos/cm 110 100.1-112
Chloride, mg/L 3.43 3.31-355
Phosphate, mg/L (ortho)CITY OF THUNDER BAY CORROSION CONTROL PLAN
1.5 Summary if Current Lead Service Line (LSL) Replacement Program
The City of Thunder Bay has had a lead service line replacement program to assist residents in reducing lead
levels in drinking water. The ongoing watermain replacement program renews the piped water infrastructure as
part of our asset management program. When watemains are replaced in the distribution system, all lead
service connections are replaced to the property line. Homeowners have the option to replace the service from
the property line into the house at their expense. The City also has a cleaning and rehabilitation program to line
older watermains with a protective coating.
As part of the LSL replacement program and community awareness concerning lead the City of Thunder Bay will
endorse the following actions:
• Replacement of lead service connections to the property line as part of the new main rehabilitation
program.
• Free sampling for homeowners with known or suspected lead connection at their request.
• Priority replacement of lead service to property line, once private lead portion is replaced.
• Public education / awareness on the impacts of lead in drinking water and options for service
replacement via door stuffers, mail out pamphlets, media releases and the City website.
2.0 INDENTIFCATION OF INTERNAL CORROSION CONTROL PROBLEMS AND
SORUCES OF CONTAMINATION
2.1 Premise Piping – May 2007 Directors Order
The City of Thunder Bay conducted sampling in twenty homes in response to the Directors Order that had
known lead connections. At that time the distribution system was split and fed from two separate sources; Loch
Lomond and Lake Superior. Ten samples were taken in each distribution system and for the purposes of the
Directors Order and the results were submitted together. The Lake Superior source did not have any samples
exceeding 10ug/L and the Loch Lomond source had two samples which exceeded the 10ug/L limit. Currently the
City of Thunder Bay’s distribution system is fed from Lake Superior and is a single source system.
Results from the lead sampling conducted in response to the Director’s Order are presented in Table 2.2. These
samples represent lead levels measured at the tap after a 5 minute flush.
2.2 Lead Results, Flushed Samples at Customer Tap and Field Results May 2007
Number above Detection
Parameter Number of Sites Average Minimum Maximum
10ug/L Limit
Lead ug/L 20 4.35CITY OF THUNDER BAY CORROSION CONTROL PLAN
2.3 Premise Piping – Schedule 15.1-7
Results from standing samples collected at residential and non-residential plumbing are summarized in Tables
2.3.1 – 2.3.14 and encompass fourteen rounds of testing.
2.3.1 Results Round 1
with an Exceedance
with an Exceedance
individual Samples
% of sample points
individual Sample
Sampling Points
Sampling Points
CONTAMINANT
Exceedances
Number of
Number of
Number of
Number of
LOCATION
Significant
(yes/no)
SOURCE
Max
Min
Lake
Lead ug/L Tap
Superior 234 117 48 35 29.91CITY OF THUNDER BAY CORROSION CONTROL PLAN
2.3.3 Results Round 3
Number of Sampling
Number of Sampling
with an Exceedance
individual Samples
% of sample points
individual Sample
CONTAMINANT
Points with an
Exceedances
Exceedance
Number of
Number of
LOCATION
Significant
(yes/no)
SOURCE
Points
Max
Min
Lake
Lead ug/L Tap
Superior 226 113 44 30 26.54CITY OF THUNDER BAY CORROSION CONTROL PLAN
2.3.6 Results Round 6
Number of Sampling
Number of Sampling
with an Exceedance
individual Samples
% of sample points
individual Sample
CONTAMINANT
Points with an
Exceedances
Exceedance
Number of
Number of
LOCATION
Significant
(yes/no)
SOURCE
Points
Max
Min
Lake
Lead ug/L Tap
Superior 220 110 52 33 30CITY OF THUNDER BAY CORROSION CONTROL PLAN
2.3.9 Results Round 9
Number of Sampling
Number of Sampling
with an Exceedance
individual Samples
% of sample points
individual Sample
CONTAMINANT
Points with an
Exceedances
Exceedance
Number of
Number of
LOCATION
Significant
(yes/no)
SOURCE
Points
Max
Min
Lake
Lead ug/L Tap 220 110 30 23 21CITY OF THUNDER BAY CORROSION CONTROL PLAN
2.3.12 Results Round 12
Number of Sampling
Number of Sampling
with an Exceedance
individual Samples
% of sample points
individual Sample
CONTAMINANT
Points with an
Exceedances
Exceedance
Number of
Number of
LOCATION
Significant
(yes/no)
SOURCE
Points
Max
Min
Lake
Lead ug/L Tap 30 15 8 7 47CITY OF THUNDER BAY CORROSION CONTROL PLAN
In conjunction with round 2 the City of Thunder Bay collected a flushed sample at each of the plumbing sites
in order to verify if flushing was a viable option. As shown in Table 2.4.1 the number of sample points with an
exceedance dropped 82% when the sample was flushed.
2.4 Results of Round 2 Flushed Sample
Number of Sampling
Number of Sampling
with an Exceedance
individual Samples
% of sample points
individual Sample
CONTAMINANT
Points with an
Exceedances
Exceedance
Number of
Number of
LOCATION
Significant
(yes/no)
SOURCE
Points
Max
Min
Lake Tap
Lead ug/L 228 114 8 8 7CITY OF THUNDER BAY CORROSION CONTROL PLAN
3.1 Metals Results
Copper ug/L (average) Iron ug/L (average) Lead ug/L (average)CITY OF THUNDER BAY CORROSION CONTROL PLAN
average per capita consumption and timed usage. Each unit had three sets of ten lead/tin solder and copper
coupons, which were located in a plexiglass sleeve that could be removed individually by set. The first set was
removed after 30 days of the trial period, the second in 60 days and the third in 90 days.
The study concluded that the addition of sodium hydroxide showed the greatest promise of corrosion control.
Graphs 1-4 summarize the results.
Graph 1
Graph 2
Graph 3
Graph 4
20 | P a g eCITY OF THUNDER BAY CORROSION CONTROL PLAN
4.1 Chemical Life Cycle Costs
The chemical usage costs from Bare Point WTP are as follows:
It is estimated that approximately 1125L of 50% of Sodium Hydroxide will be required to adjust the pH to 9.3
based on an average daily production of 45 MLD. The approximate daily cost for chemical addition will be
$845.45 using 2014 supplier chemical pricing ($0.49 per Kg 50% caustic). This will be an annual operating cost of
$308 590.01. Table 4.1.1 details the predicted Life Cycle costs not including chemical costs.
4.2 Life Cycle Costs for Hodder Study and Installation at Bare Point WTP
Hodder Bare Point
Capacity Condition and Study WTP Long
Equipment TOTAL
characteristics suggested works Short term: term:
2015-2017 2018-2028
Install new peristaltic
chem pump at the
Hodder station (short
term study period)
with additional
laboratory analysis
costs. Install new
Chemical injection pump at Bare Point
equipment For pH WTP (long term).
$50,000 $100,000 $150,000
(2 Sodium adjustment SCADA programming.
Hydroxide pumps) Replacement parts
for chemical feed
system, piping
including valves,
tubing kits etc. and
pump repair
(diaphragm kits):
$10,000/year.
5.0 IDENTIFICATION OF PREFERRED MEASURE OF CHEMICAL CORROSION
CONTROL
Using the lead solubility charts as well as well as historical data it has been determined that the City of Thunder
Bay will need to adjust the pH of the distribution system to between 9 and 9.6. The addition of sodium
hydroxide has been approved in Drinking Water Works Permit #024-201. The City of Thunder Bay will continue
to endorse public education, flushing, and the replacement of lead service lines over time throughout the entire
City.
The characteristics of Lake Superior source water make it unique among the Great Lakes. It is a soft water
(calcium carbonate hardness = 50 mg/L), low buffering capacity (alkalinity = 45 mg/L as CaCO3) and has a low
dissolved inorganic carbon content (about 10 mg/L). The pH of the source water ranges between 7.6 and 7.9.
21 | P a g eCITY OF THUNDER BAY CORROSION CONTROL PLAN The initial pipe loop and corrosion coupon trials conducted back in 1996 were good indicator studies that concluded that sodium hydroxide was the agent of choice. In addition the Bare Point Treatment Plant was designed to accommodate the addition of a pH control agent to the finished water if it became necessary. The infrastructure and control systems are in place at the facility. A formal desktop exercise was not attempted with the Thunder Bay system because historical data and experience showed that some form of chemical control would be necessary. However, the MOE publication Guidance Document for Preparing Corrosion Control Plans for Drinking Water Systems was utilized especially sections 3, 4 and 5. It was realized that analysis of Fig 3-1 “Theoretical Lead Solubility curve vs pH and DIC”, Fig3- 2 “Effects of DIC on Lead” and Fig 4-1 “Saturation pH for Calcium Carbonate Precipitation” would serve as a desktop exercise in determining starting point for sodium hydroxide addition. It was determined from the above mentioned guidance document graphs that Lake Superior treated water would require raising the pH between 9.0 and 9.6. At a DIC level of about 10 mg/L the solubility of lead would be at a minimum value. The guidance document graphs also suggest that the optimal pH for the prevention of calcium precipitation is 8.8. We have not observed calcium precipitation in any bench top tests at the optimal pH range ( J.Vukmanich, Lab notes May 2010). With the above noted comments in mind, bench scale tests were conducted in house at the City’s laboratory. Testing has revealed that for optimal pH adjustment, 7 to 12 mg/L of sodium hydroxide would need to be added to the finished water. A pH vs sodium hydroxide addition titration graph (Table 5.1) has been generated to assist operations staff with the addition. Additional Study – Since the previous study mentioned in this plan involving the MOE, McMaster University – City of Thunder Bay occurred nearly 18 years ago, The City of Thunder Bay will be conducting an additional study. Prior to the addition of sodium hydroxide to the distribution system entirely, residents in the Hodder Zone area of The City of Thunder Bay will be asked to volunteer in a two year sampling study. Residents with confirmed lead service connections in this zone will be identified and asked to have their private plumbing sampled twice per year for two years. The first round of sampling will commence between December 15, 2014 and April 15, 2015 (Winter). The second round of sampling will occur between June 15, 2015 and October 15, 2015 (Summer). Beginning in December 2015, sodium hydroxide will be injected to the Hodder Zone at the Hodder pumping Station. Once the chemical is distributed throughout Hodder Zone, sampling will begin at the same sample locations that were sampled prior to addition. Sampling will commence December 15, 2015 through April 15, 2016 for winter and June 15, 2016 through October 15, 2016 for summer. Parameters listed in Table 7.1 will be tested for all samples taken pre and post chemical addition. These results will be used in addition to the previous study results to determine if the addition of sodium hydroxide poses a risk to the safety of the drinking water. This two year localized study allows the City to assess the impact of raising the pH in the distribution system to a level that may compromise the effectiveness of disinfection. As listed in table 1.2.1 the average pH of raw water entering treatment is 7.80. Raising the pH to a point that effectively reduces corrosion (9.0-9.6) may have an adverse effect on disinfection. 22 | P a g e
CITY OF THUNDER BAY CORROSION CONTROL PLAN

5.1 pH vs. Sodium Hydroxide Results

                      pH                  millimoles NaOH              mg/L NaOH added
                      8.52                     0.06355                        2.542
                      8.97                      0.1271                        5.084
                      9.19                     0.19065                        7.626
                      9.39                      0.2542                       10.168
                      9.57                     0.31775                        12.71
                      9.67                      0.3813                       15.252
                      9.77                     0.44485                       17.794
                      9.87                      0.5084                       20.336
         Table 5.1 ( J.Vukmanich Chief Chemist Environment Division-Water Authority May 10, 2010)

5.2 pH vs. Sodium Hydroxide Addition

23 | P a g e
CITY OF THUNDER BAY CORROSION CONTROL PLAN
5.3 Secondary Impacts
As for secondary impacts, the addition of sodium hydroxide will increase the sodium level in Thunder Bay tap
water. With reference to the pH vs sodium hydroxide addition curve this increase would be in the range of 4 to
7 mg/L as sodium. The background level of sodium in the finished water after disinfection is about 3 mg/L;
therefore the total sodium concentration would not be greater than 10 mg/L. This is well below the health
standard of 20 mg/L as stated in the Ontario Drinking Water Objectives (1994).
6.0 PUBLIC NOTIFICATION AND STAKEHOLDER CONSULTATION
Prior to the introduction of sodium hydroxide to any part of the distribution system major stake holders and
the public will be notified through a media release.
6.1 Types of media to be contacted
The media release will be mailed major stake holders a minimum of one month prior to the introduction of
sodium hydroxide in order for the stakeholders to adjust any process requirements. A copy of the media release
will be published in the following areas:
• City of Thunder Bay website
• Thunder Bay Radio Stations
• Thunder Bay Television
• Local Newspapers
7.0 MONITORING CORROSION CONTROL EFFECTIVENESS
Corrosion Control utilizing Sodium Hydroxide for pH adjustment to optimize pH levels in premise piping will
require a number of ongoing initiatives. Once results from the study have been analyzed and if the addition of
sodium hydroxide to the entire distribution system is the outcome, Table 7.1 outlines the testing and sampling
frequency. All testing for the monitoring program will be performed in the Bare Point Water Treatment Plant
water test area by certified operators or at ALS Laboratory.
The lead sampling locations will be chosen according to the results as part of the regulatory lead sampling
program. A minimum of 10 residential and commercial sites will be chosen based on the worst case results
recorded providing the occupants are willing to participate in the program. The residential and commercial sites
will be sampled and tested on a monthly basis. Due to confidentiality issues Lead Monitoring Numbers (LM) will
24 | P a g eCITY OF THUNDER BAY CORROSION CONTROL PLAN
be developed for publishing purposes. The Environment Division Water Authority will maintain a data base with
corresponding addresses and will be available to the Ministry of Environment upon request.
7.1 Recommended Parameters and Locations for Post Chemical Implementation Monitoring
Distribution Residential Distribution System
Parameters Point of Entry and Non- System Dead Ends and Areas Parameters
Residential Taps of Concern
Lead x x x x
Alkalinity x x x x
PH* x x x x
Chlorine Residual* x x x x
Temperature* x x x x
Iron x x
Sodium x x
Turbidity x x
Colour x x
Microbiological
Parameters
x x x
(coliform,HPC)
* Collected as part of the existing monitoring program
8.0 CORROSION CONTROL PLAN IMPLEMENTATION
The Corrosion Control project was implemented beginning in 2010. Table 8.1 below shows a Gantt diagram
illustrating the major segments of the implementation program and the target dates for completion.
• The development of a public awareness campaign in conjunction with the Thunder Bay District Health
Unit.
• The development of an enhanced infrastructure renewal program.
• Two year localized phased study approach involving the Hodder Zone area with injection at the Hodder
Pumping Station
• The pH control implementation plan allows for the chemical addition of sodium hydroxide to adjust the
pH. If need be, the sodium hydroxide will be added to points in the process stream at the Bare Point
Water Treatment Plant (clearwell mixer or the clearwell exit and the distribution header). The
commissioning (slow and periodic addition) and the startup phases (continuous addition, controlled pH)
of the project will optimize the addition and control for unknown changes in the distribution system
25 | P a g eCITY OF THUNDER BAY CORROSION CONTROL PLAN
8.1 Corrosion Control Plan Implementation
2010 2011 2012 2013 2014 2015 2016
ID Task Name Start Finish
J F M A M J J A S O N D J F M A M J J A S O N D J F M A M J J A S O N D J F M A M J J A S O N D J F M A M J J A S O N D J F M A M J J A S O N D J F M A M J J A S O N D
1 Chemical Addition Design 18/01/2010 28/01/2010
2 Chemical Addition redesign 29/01/2010 11/02/2010
3 Mechanical construction 12/02/2010 25/03/2010
4 Instumentation design 25/01/2010 11/02/2010
5 Instrumentation Equipment Purchasing 12/02/2010 19/03/2010
6 Instrumentation construction 22/03/2010 18/05/2010
7 Community Lead Samplng 06/09/2010 ongoing
8 Lead Reduciton Zone Specialization Flushing Trials 15/06/2011 14/10/2011
9 By-Law Research and Development 01/09/2011 30/11/2011
10 Budget Preparation 01/11/2011 28/02/2012
11 Watermain Flushing 01/06/2011 28/10/2011
12 At the Tap Usage Lead Reduciton Strategies Dev't 01/07/2011 ongoing
13 Service lines/connections Replacement 01/04/2011 ongoing
14 Implementation of At the Tap Strategies 01/07/2011 ongoing
15 Water Quality Maintenance 30/04/2012 31/10/2012
16 Public Education Campaign 29/04/2013 ongoing
17 Evaluating the Success of the public Education and Lead Service Replacement ongoing ongoing
18 Addition of 3rd flushed private plumbing sample to Oreg 170 s 15.1 protocol 15/06/2014 15/10/2014
19 Localized phased study for Hodder Zone w/o addition sodium hydroxide 15/12/2014 15/10/2015
20 Localized phased study for Hodder Zone w addition sodium hydroxide 15/12/2015 15/10/2016
21 Documented Annual Review of CCP 15/12/2014 annually
Chemical Addition
OReg 170 s.15.1
Education
Review
Preparation
Service ReplacementYou can also read