SMALL DATA: Local Trip Generation Data and Developing a Better Model for the City of Austin, Texas - WGI
←
→
Page content transcription
If your browser does not render page correctly, please read the page content below

SMALL DATA:
Local Trip Generation Data and
Developing a Better Model
for the City of Austin, Texas

Dan Hennessey, PE, TE, PTOE
Director of Transportation Services
BIG RED DOG, a division of WGI
dan.hennessey@bigreddog.com

PRESENTED AT:                                  WINNER:
Institute of Transportation Engineers          2018 Technical Paper Of The Year
(ITE) Joint Western & Texas District           Texas Institute of Transportation
Meeting - Keystone, CO                         Engineers (TexITE)
June 27, 2018

   BIG RED DOG, a division of WGI | Texas Registered Engineering Firm F-15085 | BIGREDDOG.com
                  2021 E. 5th Street, Suite 200 | Austin, TX 78702 | 877.733.3642
ABSTRACT

                       Trip generation estimates for specific land uses are
                       traditionally gathered from data included in the most
                       current version of a handbook entitled Trip Generation
                       Manual, produced by the Institute of Transportation
                       Engineers (ITE). Data collected to develop these rates
                       have typically been collected at suburban, single-use,
                       freestanding sites. These defining characteristics limit
                       their applicability to development projects in urban
                       settings.

                       From a collection of planning studies and impact
                       analyses done in the last two years within the City of
                       Austin, BIG RED DOG Engineering examined existing
                       data to show that vehicle trip generation estimates to
                       and from new development have been overestimated
                       during the peak hours by more than 50 percent.

                       To remedy this overestimation, BIG RED DOG
                       Engineering developed a vehicle trip generation
                       model specific to the City that accounts for specific
                       characteristics of the development, availability of
                       non-auto modes, and the demographic profile of the
                       surrounding area. Aside from the traffic count data, the
                       BIG RED DOG team used readily available information
                       as variables for the model, both for calibration and
                       validation as well as for use in developing new forecasts.

                       The results of this analysis have implications for
                       engineers and planners that continue to design the
                       City for vehicles, thus creating a self-fulfilling prophecy
                       of vehicle congestion. As the City moves toward a
                       more multimodal vision while wrestling with their
                       responsibility to those in vehicles, the use of the
                       national rates create an undue burden on the engineers
                       and planners championing that multimodal vision.

SMALL DATA: Local Trip Generation Data and Developing a Better Model for the City of Austin, Texas
                                         BIG RED DOG, a division of WGI | BIGREDDOG.com | 2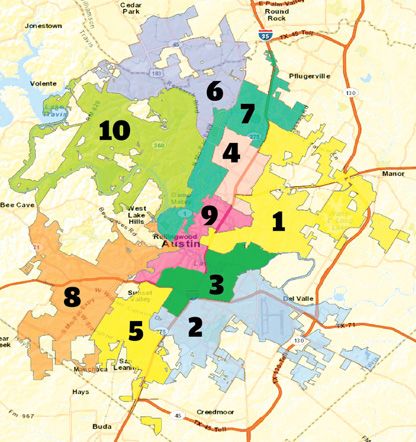
INTRODUCTION

As part of development applications               •   Diversity of uses within the
throughout the country, developers                    development
are often required to provide a                   •   Connectivity/walkability
transportation impact analysis (TIA),             •   Adjacent land uses
which requires the applicant to assess            •   Distance to non-auto modes
impacts of the proposed development               •   Size of development
on the surrounding transportation                 •   Demographic profile of the
network. Every jurisdiction has its                   surrounding area
own requirements, but many focus                  •   Transportation Demand Management
on vehicle capacity at intersections                  (TDM) tools
and on roadway segments. If a TIA
indicates that a project will cause               Data collected to develop the ITE
facilities to not meet their requirements,        rates have typically been collected at
jurisdictions can require applicants to           suburban, single-use, freestanding sites
add capacity through widened roads and            and reflect sites across the nation, as
intersections, new traffic signals, and           well as dates extending back to the
other improvements.                               1960s. With changing trends in travel
                                                  behavior, including a decrease in auto
A major part of this analysis is the              trips per person and declining vehicle
vehicle trip generation estimate that             ownership rates, many of these data
is developed for the project, typically           points are no longer applicable to the
based only on the proposed land use and           type of development under consideration
its intensity. Trip generation estimates          today. These defining characteristics
for specific land uses are traditionally          limit their applicability to development
gathered from data included in the most           projects in more unique environments,
current version of a handbook entitled            such as urban settings and/or projects
Trip Generation Manual, produced by the           with a mix of uses.
Institute of Transportation Engineers
(ITE).

New models have been developed in
the last decade to better account for
mixed-use and urban infill development
projects, accounting for additional
variables that influence vehicle trip
generation:

          SMALL DATA: Local Trip Generation Data and Developing a Better Model for the City of Austin, Texas
                                                   BIG RED DOG, a division of WGI | BIGREDDOG.com | 3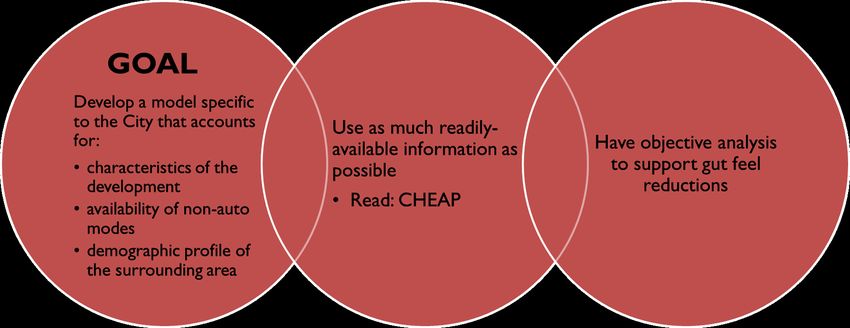
BACKGROUND /
                            PREVIOUS STUDIES

As urban infill and mixed-use development projects
have become more popular, standard trip generation
rates have not provided for the subtlety of the variables
mentioned above that affect vehicle trip generation.
Overestimating vehicle trip generation can lead to
excessively conservative traffic analysis and additional
capacity for vehicles that is neither warranted nor
consistent with a jurisdiction’s vision for their mobility
network. Not only does it increase the cost of the
development (which gets passed on to its tenants), it
can also color the community’s opinion of a potential
development and increase opposition.

Many transportation planners and traffic engineers
will use the standard ITE rates without questioning
their appropriateness. While this method is quick to
complete and objective in its assessment, it is also
often incorrect. ITE’s Trip Generation Handbook,
which provides guidance as to how to best use the
data included in Trip Generation Manual (as well as to
incorporate methodologies for mixed-use and urban
infill developments), states that local data should be
used to supplement the national data provided, should
it be available. Estimates generated through the data
included in Trip Generation Manual also only reflect one
variable: the density of the land use selected.

          SMALL DATA: Local Trip Generation Data and Developing a Better Model for the City of Austin, Texas
                                                   BIG RED DOG, a division of WGI | BIGREDDOG.com | 4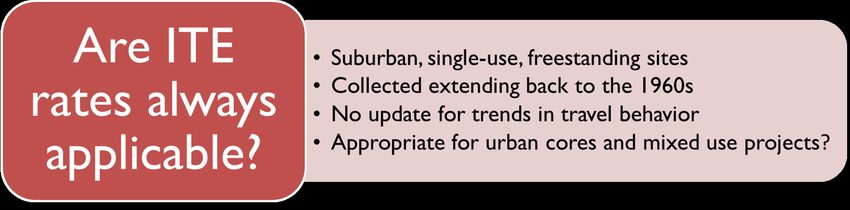
Particularly for urban infill and mixed-use development
projects, previous studies have shown that standard
ITE rates significantly overestimate both daily and
peak hour vehicle trip generation. Some studies have
shown that actual vehicle trip generation for urban
infill developments is overestimated by up to 70
percent. Other studies have indicated that mixed-use
developments located in suburban settings can have
a daily vehicle trip generation rate up to 30 percent
lower than what would be estimated using standard
rates; that number rises to 50 percent during the peak
periods.

Comparisons to ITE’s Trip Generation Manual (9th
Edition) for certain development projects within the
City of Austin were the original impetus for this review.
The standard rates in the manual combine all data from
a particular land use into a single category, and much of
the data were decades old.

Late in 2017, ITE released the 10th Edition of Trip
Generation Manual. This edition updated the data
set to remove data from before 1980; it also included
data collected at a range of geographic settings,
including Central Business Districts, midtown areas,
and residential developments near transit stations. For
certain land use categories, rates specific to geographic
settings (e.g. Center City Core, Dense Multi-Use Urban)
are provided in additional to the overall rate for several
land use categories. Data can also be sorted by the year
the data was collected to develop trip generation rates
through a web application.

For mixed-use developments, ITE’s Trip Generation
Handbook defers to the methodology established in
NCHRP Report 684: Enhancing Internal Trip Capture
for Mixed-Use Developments. The variables mentioned
in the introduction have typically been used to more
appropriately estimate vehicle trip generation for
mixed-use development, though they apply to the
surrounding areas of single-use urban infill sites as well.

           SMALL DATA: Local Trip Generation Data and Developing a Better Model for the City of Austin, Texas
                                                    BIG RED DOG, a division of WGI | BIGREDDOG.com | 5
For urban infill sites, the Handbook simply states the
data do not reflect vehicle trip generation at those
locations; it also acknowledges that development in
areas that are almost fully built out often does not
result in the number of vehicle trips that would be
generated in suburban or outlying locations.

Other models for vehicle trip generation have been
created, though they typically reflect national data
at mixed-use sites. One such methodology was
developed from a national study sponsored by the US
Environmental Protection Agency (EPA). Travel survey
data were gathered from 239 mixed-use developments
in six major metropolitan regions and correlated with
the characteristics of the sites and their surroundings.
Characteristics listed earlier were related statistically to
trip behavior observed at the study development sites,
which produced equations allowing better predictions
for external vehicle trip reduction as a function of the
mixed-use development characteristics. Validation at
27 developments reduced overestimation of vehicle
trips from two to twelve percent.

These equations have been used for urban,
suburban, and exurban mixed-use projects.
Some development projects in dense,
urban areas have shown reductions of 30
to 50 percent. Mixed-use development
projects in suburban areas more often
showed reductions between ten and twenty
percent. Single-use projects without transit
connections, or mixed-use projects without
complementary land uses, typically showed
very low reductions.

           SMALL DATA: Local Trip Generation Data and Developing a Better Model for the City of Austin, Texas
                                                    BIG RED DOG, a division of WGI | BIGREDDOG.com | 6
DATA COLLECTION
In lieu of using the national models to estimate vehicle
trip generation, BIG RED DOG Engineering staff
compiled vehicle trip generation counts from a series
of transportation planning studies and traffic impact
analyses done in the last two years within the City of
Austin.
A total of 31 sites were included in the analysis,
representing all ten City Council districts and ten
different land use categories. Sixteen of the sites were
collected for TIAs since 2016; an additional fifteen sites
were collected in early 2018 to complement that data
set by filling in gaps in geography and land uses. Data
from four additional sites were deemed incomplete or
inappropriate for the purposes of this analysis.
Nineteen of the projects had a residential component, while thirteen had a
commercial component. Three projects had a mix of uses, though two were retail
plazas with supporting uses. A number of variables were collected in addition to the
counts for model development; these are detailed later in this paper.
SMALL DATA: Local Trip Generation Data and Developing a Better Model for the City of Austin, Texas
BIG RED DOG, a division of WGI | BIGREDDOG.com | 7COMPARISON TO
ITE TRIP GENERATION
The results indicate that by using the vehicle traffic traveling to and from the
ITE data alone, vehicle trip generation developments by 22 percent during the
estimates are too high by 52 percent AM peak hour and 30 percent during the
during the AM peak hour and 50 PM peak hour. The average error per site
percent during the PM peak hour for was seventeen percent during the AM
the 31 locations. The average error per peak hour and 31 percent during the PM
prediction was 47 percent during the AM peak hour. Eleven of the 31 locations had
peak hour and 54 percent during the PM actual trip counts that were higher than
peak hour. Four of the 31 locations had predicted in the AM peak hour, and seven
actual trip counts that were higher than had a trip count that was higher than
predicted in the AM peak hour, and only predicted in the PM peak hour.
one had a trip count that was higher
than predicted in the PM peak hour. During the AM peak hour, 14 of the 31
locations had actual trip counts that
During the AM peak hour, 22 of the 31 were less than 80 percent of what would
locations had actual trip counts that have been predicted by the national
were less than 80 percent of what would data; six were less than 60 percent of
have been predicted by the national the predicted values. Seven of the 31
data; fourteen were less than 60 percent predictions were within ten percent
of the predicted values. For the PM of the actual value. For the PM peak
peak hour, 24 of the 31 counts were less hour, 17 of the 31 counts were less than
than 80 percent of predicted values, 80 percent of predicted values, and
and twelve were less than 60 percent. ten were less than 60 percent. Figure
Figure 1 and Figure 2 show predicted and 4 and Figure 5 on the following page
actual vehicle trip generation for each shows predicted and actual vehicle trip
of the 31 projects for the AM and PM generation for each of the 31 projects for
peak hours, respectively. Figure 3 shows the AM and PM peak hours, respectively.
the ratios of predicted to actual vehicle Figure 6 shows the ratios of predicted
trip generation for the AM and PM peak to actual vehicle trip generation for the
hours for each of the 31 projects. AM and PM peak hours for each of the
31 projects. Statistics comparing these
With the updated data in the 10th estimates for the 9th and 10th Editions of
Edition, the results indicate that using Trip Generation Manual are shown below
the ITE data alone would overestimate in Table 1.
SMALL DATA: Local Trip Generation Data and Developing a Better Model for the City of Austin, Texas
BIG RED DOG, a division of WGI | BIGREDDOG.com | 8Figure 1 - Predicted vs. Actual Trip Generation (ITE 9th Edition) - AM Peak Hour
Figure 2 - Predicted vs. Actual Trip Generation (ITE 9th Edition) - PM Peak Hour
SMALL DATA: Local Trip Generation Data and Developing a Better Model for the City of Austin, Texas
BIG RED DOG, a division of WGI | BIGREDDOG.com | 9Figure 3 - Predicted vs. Actual Trip Generation (ITE 9th Edition) - PM Peak Hour
Figure 4 - Predicted vs. Actual Trip Generation (ITE 10th Edition) - AM Peak Hour
SMALL DATA: Local Trip Generation Data and Developing a Better Model for the City of Austin, Texas
BIG RED DOG, a division of WGI | BIGREDDOG.com | 10Figure 5 - Predicted vs. Actual Trip Generation (ITE 10th Edition) - PM Peak Hour
Figure 6 - Predicted vs. Actual Trip Generation (ITE 10th Edition) - PM Peak Hour
SMALL DATA: Local Trip Generation Data and Developing a Better Model for the City of Austin, Texas
BIG RED DOG, a division of WGI | BIGREDDOG.com | 11Table 1 - Statistical Comparison of Actual Totals vs. Estimates Predicted by ITE’s Trip Generation Manual (9th, 10th Eds.)
ITE AM Peak PM Peak
Statistic
Edition Hour Hour
ITE Generated Estimates vs. Actual Vehicle Trip Generation Totals1 152% 150%
Average Overestimation Per Site2 47% 54%
9th
Sites with Higher Actual Vehicle Trip Generation Than Estimate 4 / 31 1 / 31
Edition
Sites with Actual Trip Generation Estimate Less Than 80% of ITE Generated Estimate 22 / 31 24 / 31
Sites with Actual Trip Generation Estimate Less Than 60% of ITE Generated Estimate 14 /31 12 / 31
ITE Generated Estimates vs. Actual Vehicle Trip Generation Totals1 122% 130%
Average Overestimation Per Site2 17% 31%
10th
Sites with Higher Actual Vehicle Trip Generation Than Estimate 11 / 31 7 / 31
Edition
Sites with Actual Trip Generation Estimate Less Than 80% of ITE Generated Estimate 14 / 31 17 / 31
Sites with Actual Trip Generation Estimate Less Than 60% of ITE Generated Estimate 6 / 31 10 / 31
Notes:
1. Observed trip generation total for all 31 sites divided by predicted trip generation for same sites
2. The inverse of the sum of observed trip generation totals divided by predicted trip generation totals minus 1
For residential projects, the national data As previously mentioned, the 10th Edition
underestimated traffic by 1.4 percent also provides vehicle trip generation rates
during the AM and overestimated traffic with specific geographic settings for
by 20 percent during the PM peak hour. certain land uses categories. For land uses
For commercial projects, the standard that had more detailed rates available
rates overestimated traffic by 44 and for those geographic settings (Center
34 percent during the AM and PM peak City Core or Dense Multi-Use Urban
hours, respectively. instead of General Urban/Suburban), the
results indicate that using the ITE rates
For the mixed-use projects, the underestimates vehicle traffic traveling
overestimation was 41 and 50 percent to and from new development by 11
during the AM and PM peak hours, percent during both the AM and PM peak
respectively. Even accounting for hours. These rates were only applicable
internalization estimates for these to four of the 31 sites included in the data
projects, overestimation of vehicle trip set.
generation was 23 and 36 percent during
the AM and PM peak hours, respectively.
SMALL DATA: Local Trip Generation Data and Developing a Better Model for the City of Austin, Texas
BIG RED DOG, a division of WGI | BIGREDDOG.com | 12MODEL
DEVELOPMENT
BIG RED DOG Engineering started this research effort
with a goal to determine if vehicle trip generation was
systemically overestimated within the City; with the
referenced evidence that that was indeed occurring,
the team set out to develop a vehicle trip generation
model specific to the City that accounts for specific
characteristics of the development, availability of
non-auto modes, and the demographic profile of the
surrounding area. Aside from the traffic count data, the
team used readily available information as variables for
the model, both for calibration and validation as well as
for use in developing new forecasts.
Typically during the scoping process for a TIA for the
City of Austin, the applicant and the City will agree
on a vehicle trip reduction percentage, which includes
internalization due to a mix of uses, as well as potential
utilization of alternative modes. This reduction is
occasionally based on an objective analysis method,
though more typically it is based on the gut feel of
City staff and engineers based on the diversity of the
land uses and the location of the project. The goal of
developing this model was to put objective analysis
behind those reductions.
SMALL DATA: Local Trip Generation Data and Developing a Better Model for the City of Austin, Texas
BIG RED DOG, a division of WGI | BIGREDDOG.com | 13In addition to the counts themselves, a number of additional
variables were recorded for potential use in a vehicle trip
generation model:
• Land use categories and respective intensities
• Zip code and City Council district
• Most-frequent transit service within ¼-mile radius of project
• Intersection density within ¼-mile radius
• Provision of parking and fees associated
• Walk Score, Bike Score, and Transit Score from walkscore.com
• MobilityScore from TransitScreen
• Size of project in acres
• Household size and average family size per zip code
• Percentage of households without vehicles per zip code
• Average vehicle ownership per household per zip code
• Drive alone commute percentage per zip code
Generally, these variables were intended to be representative
of the larger categories mentioned earlier in this paper while
also being easily accessible. These variables either mirror or are
a reflection of variables used in other vehicle trip generation
models.
Table 2 - Comparison of National, City of Austin, and Study Site Census and American Community Survey Data
City of Austin Average Study
Potential Variable National Rate Rate Range
Rate Size Rate
Household Size 2.58 2.37 2.45 1.44 – 3.67
Average Family Size 3.14 3.16 3.15 2.23 – 4.05
Households without Vehicles 9.0% 6.4% 6.6% 0.4% - 14.9%
Vehicles per Household 1.79 1.66 1.68 1.26 – 2.19
Drive Alone Commute Percentage 76.4% 73.7% 72.9% 60.9% – 81.8%
SMALL DATA: Local Trip Generation Data and Developing a Better Model for the City of Austin, Texas
BIG RED DOG, a division of WGI | BIGREDDOG.com | 14Based on the data from Walk Score and TransitScreen,
projects ranged from having “Excellent Transit” and
being a “Walker’s Paradise” to having “Minimal Transit”
and being “Very Car-Dependent.” Within the City of
Austin limits, it was difficult to find developments that
were rated as having the best possible transit service
and pedestrian accommodations. TransitScreen’s
MobilityScore is included as a measure of the availability
of transportation options and overall access from a
particular address. The score is intended to measure
ease of mobility, including the availability of carsharing
and bike sharing services as well as ride-hailing services.
The final five variables were all collected from United
States Census and American Community Survey data.
Data for the sites included in the study are shown in
Table 2. The selected sites are representative of the
City of Austin, which has smaller households, fewer
households without a vehicle, fewer vehicles per
household, and a lower drive alone commute percentage
than the national rates indicate.
SMALL DATA: Local Trip Generation Data and Developing a Better Model for the City of Austin, Texas
BIG RED DOG, a division of WGI | BIGREDDOG.com | 15MODEL
CALIBRATION
The baseline vehicle trip generation MobilityScore and had the greatest
estimates used in the City of Austin correlation with vehicle trip generation
model are developed from the ITE estimate accuracy. Transit frequency
standard rates and equations. The also had a high correlation with the
model then attempts to determine a Transit Score and held little explanatory
ratio to adjust for the characteristics of value. Household size and average family
vehicle trip generation within the City of size proved to be redundant variables.
Austin. The model does not distinguish Percentages of households without
between trips that might stay internal vehicles was a weaker explanatory
to the project or will be made by walking, variable than average vehicle ownership
bicycling, or taking transit; its goal is to and drive alone commute percentage.
simply provide a more accurate estimate Those two variables also had a high
of vehicle trip generation. coefficient of correlation. Average
vehicle ownership had additional weight
These ratios would be used to multiply in explaining the overestimate of vehicle
the vehicle trip generation estimates trips; as result, drive alone commute
derived from the 10th Edition of the Trip percentage was removed from the data
Generation Manual. Separate ratios set.
were developed for the AM and PM peak
hours; while the data showed similar As a result, the following variables were
patterns, they were often on different further examined for use in developing
scales. the vehicle trip generation ratios:
• Land use categories and respective
Several variables are similar and correlate intensities
heavily to one another. As a result, the • Intersection density within ¼-mile
following variables were eliminated: radius
• Zip code and City Council district • Provision of parking and fees
• Most-frequent transit service within associated
¼-mile radius of project • Walk Score
• Bike Score, Transit Score, and • Size of project in acres
MobilityScore • Household size per zip code
• Average family size per zip code • Average vehicle ownership per
• Percentage of households without household per zip code
vehicles per zip code
Only four of the sites included in the
Walk Score had high correlations data set charged for parking provided
with Bike Score, Transit Score, and on-site; observations also indicated that
SMALL DATA: Local Trip Generation Data and Developing a Better Model for the City of Austin, Texas
BIG RED DOG, a division of WGI | BIGREDDOG.com | 16parking (another potential driver for As a result of strong correlation
vehicle trip generation) was also widely statistics between the tested variables
available across these sites. Because of and the actual vehicle trip generation
the lack of diversity, provision of parking totals (as well as the overestimate), the
and its associated fees were removed following variables were used in the final
from the data set. calibration of the model to develop the
AM and PM peak hour ratios:
Intersection density is an important
variable in the estimation of vehicle trip • Land use categories and respective
generation for mixed-use developments. intensities
It is typically used to reflect the design • Walk Score
of a project, including connectivity and • Household size per zip code
walkability. Walk Score did a much better • Average vehicle ownership per
job of reflecting the true reduction household per zip code
of the vehicle trip generation than
intersection density. Because so few With estimates generated by the
projects included are truly mixed-use, equation produced by the calibration
it is likely that the data set decreased efforts above, the calibration statistics
the weight of this variable; with shown in Table 3 were much better as
additional data, particularly for larger compared to those same statistics using
mixed-use developments, it is likely that predictions from the one-variable ITE
intersection density (particularly internal data.
to the project) would be a greater
indicator for true vehicle trip generation.
Similarly, the size of the development did
not vary enough within this data set to
find a statistically significant correlation
with vehicle trip generation. Both
variables were removed from the data
set.
SMALL DATA: Local Trip Generation Data and Developing a Better Model for the City of Austin, Texas
BIG RED DOG, a division of WGI | BIGREDDOG.com | 17MODEL
VALIDATION
Five additional sites were selected to validate the
model. Actual vehicle trip generation data were
collected at these locations but were not included
in previous results or the model calibration. Using
the model created with the data at the 31 sites, the
average overestimation of vehicle trips decreases from
seventeen percent in the AM peak hour and 31 percent
in the PM peak hour using only the ITE data to nine
percent and five percent, respectively. All validation
statistics improved as well using the BIG RED DOG
Engineering model, as shown in Table 3.
Table 3 - Calibration / Validation Statistics of Using ITE (10th Edition) and BRD Trip Generation Models
AM Peak Hour PM Peak Hour
Validation Statistic
ITE Method BRD Method ITE Method BRD Method
Average Model Error % 14% 13% 24% 9%
Average Absolute Model Error % 34% 16% 33% 7%
Calibration
Root Mean Square Error % 49% 21% 57% 13%
R-Squared 0.89 0.97 0.80 0.95
Average Model Error % 21% 12% 29% 14%
Average Absolute Model Error % 32% 15% 39% 11%
Validation
Root Mean Square Error % 59% 24% 61% 14%
R-Squared 0.86 0.94 0.74 0.94
SMALL DATA: Local Trip Generation Data and Developing a Better Model for the City of Austin, Texas
BIG RED DOG, a division of WGI | BIGREDDOG.com | 18POTENTIAL ISSUES
While we believe that use of this model Lastly, simplified versions of many
does a better job of predicting peak hour variables were used for this study. As
vehicle trip generation than solely using mentioned in the “Model Calibration”
data from Trip Generation Manual, we section, the data set may have
also acknowledge a number of areas in eliminated some variables that would
which the model could be improved. otherwise influence vehicle trip
generation. The model developed for
While 31 data points felt significant this effort simply looked at different
enough to establish a clear pattern correlative effects on vehicle trip
with a diverse set of land uses and generation that seemed consistent with
geographies, additional data would help the principles used in more advanced
to further calibrate (and validate) the vehicle trip generation models. While
model. Counts for each site occurred on this model improves on the data
one day only, adding to the variability of provided by ITE’s Trip Generation Manual,
the observed data. additional advances are almost certainly
possible with a larger data set for
The included land uses represent a small calibration.
subset of the available choices in ITE’s
Trip Generation Manual; additional data
to support the patterns found with the
predominantly residential and office
locations would lend more credence to
the model for use with other land uses.
Because this was an internally-funded
research project, some locations were
chosen because they would be easier
to count vehicle trips; for the purposes
of this effort, developments with fewer
access points were obvious candidates
for the supplemental data collection to
reduce costs. While limited connectivity
could be an indicator of additional
vehicle dependency, more connected
locations could be added to the data set
to further support the results found at
the 31 selected locations.
SMALL DATA: Local Trip Generation Data and Developing a Better Model for the City of Austin, Texas
BIG RED DOG, a division of WGI | BIGREDDOG.com | 19FOLLOW-UP
ANALYSIS
In addition to supplementary calibration and validation,
more detailed information could be gleaned from this
type of analysis with additional data. Person-trip
estimates, which have begun to become available in
the 10th Edition of Trip Generation Manual, could in
the same manner be locally calibrated and validated.
Person-trip estimates could add significant context to
the evaluation of the development as well. Person-trip
data collection is also much more labor intensive due to
the need for intercept surveys to complete counts for
each of the different modes.
As an example, how does the evaluation of a project
change if each vehicle carries three to four people?
What if many of the vehicles at an intersection are
transit vehicles, carrying 50 passengers per vehicle?
Perhaps the vehicle trip generation estimated from ITE
data is fairly accurate, but the mode split for the project
could be evenly split among non-private automobile
modes.
With additional travel options available, mode choice
is no longer limited to private automobiles, walking,
bicycling, and/or taking transit. Transportation network
companies (TNCs), shared resources (both car and
bicycle), and dockless operators (bicycles, electric
bicycles, and electric scooters), are providing more
options particularly for shorter trips.
This model could also be combined with additional
data to develop estimates for vehicle-miles traveled
(VMT) for any given development project. Projects
could be evaluated by total VMT, by VMT per capita,
or by VMT per trip. Two developments may generate
similar numbers of vehicle trips; should they be treated
SMALL DATA: Local Trip Generation Data and Developing a Better Model for the City of Austin, Texas
BIG RED DOG, a division of WGI | BIGREDDOG.com | 20similarly if one has an average trip length of two miles
and another has an average trip length of ten miles?
Those are judgments for individual jurisdictions to
make, but the data is available for those evaluations to
be made.
As more jurisdictions look toward TDM methods to
manage vehicle traffic (rather than attempting to add
supply to vehicle capacity), understanding the baseline
level of vehicle trip generation is important if TDM plans
and programs are to be judged for performance, rather
than for implementation. As an example, if the City of
Austin required each of the sites to reduce vehicle trips
to and from their sites during both peak periods by 15
percent tomorrow, 13 of the 31 sites would be compliant
without having to change anything if trip generation
estimates were compared to ITE rates.
Among the City’s foremost issues right now is housing
affordability; the overestimation of vehicle traffic has
consequences for rents and home ownerships prices
as well. With the City undergoing an update to its land
development code and associated standards, this
has wide-ranging implications for the future of land
development and transportation planning.
SMALL DATA: Local Trip Generation Data and Developing a Better Model for the City of Austin, Texas
BIG RED DOG, a division of WGI | BIGREDDOG.com | 21CONCLUSION
As the City moves toward a more multimodal vision
while wrestling with their responsibility to those in
vehicles, the use of the national data create an undue
burden on City staff championing that multimodal
vision. Estimates derived from these data have caused
engineers and planners to continue to build the City
for vehicles, thus creating a self-fulfilling prophecy
of vehicle congestion. While ITE’s 10th Edition of the
Trip Generation Manual lowers this error, the national
data still do not reflect actual vehicle trip generation
measured throughout the City of Austin.
Using a combination of variables in addition to the land
use and its intensity, BIG RED DOG Engineering has
developed a model to lower average error from 17-31
percent to 5-9 percent. The data for the additional
variables are readily available and consistent with
the types of variables examined in previous studies.
Additional data would help to further calibrate the
model and provide more information regarding the trip
generating characteristics of a potential development,
but a very clear pattern has been observed with the
data collected.
Lastly, the total cost for the data included in this study
through a third-party vendor was just under $10,000;
fewer than 100 hours of staff time were needed to
process the data, build the database for both the
counts, ITE estimates, and the potential variables,
calibrate and validate the model, and document the
results within this paper. Only the traffic counts require
significant cost and time to gather; while this model is
a simplified version of some that have come before it, a
version of this could be replicated for most jurisdictions
within the United States.
SMALL DATA: Local Trip Generation Data and Developing a Better Model for the City of Austin, Texas
BIG RED DOG, a division of WGI | BIGREDDOG.com | 22REFERENCES
Bochner, B. S., K. Hooper, B. Sperry, and R. Dunphy. 2011. Enhancing Internal Trip Capture Estimation for
Mixed-Use Developments. NCHRP Report 684. Washington, DC.
Clifton, K.; Currans, K.; Muhs, C. 2015. Adjusting ITE’s Trip Generation Handbook for urban context. Journal
of Transport and Land Use, Volume 8, No. 1, 5-29.
Currans, K. 2017. Issues in Urban Trip Generation. Portland State University Dissertations and Theses. Paper
3778.
De Gruyter, C., Rose, G., & Currie, G. 2014. Methodology for evaluating quality of travel plans for new
developments. Transportation Research Record: Journal of the Transportation Research Board,
2417, 46–57.
De Gruyter, C., Rose, G., & Currie, G. 2015. Understanding travel plan effectiveness for new residential
developments. Transportation Research Record: Journal of the Transportation Research Board,
2537, 126–136.
District Department of Transportation. 2015. Trip Generation and Data Analysis Study. Research Report.
Washington, D.C.: District Department of Transportation.
Ewing, R., Greenwald, M., Zhang, M., Walters, J., Feldman, M., Cervero, R., Frank, L., and Thomas, J. 2011.
Traffic generated by mixed-use developments: six-region study using consistent built environmental
measures. Journal of Urban Planning and Development 137(3): 248–261.
Ewing, R., Tian, G., Lyons, T., Stinger, P., Weinberger, R., Kaufman, B., and Shivley, K. 2017. Trip and Parking
Generation at Transit-Oriented Developments. Research Report NITC-RR-767.
Ewing, R., Deanna, M., and Li, S. 1996. Land Use Impacts on Trip Generation Rates. Transportation Research
Record: Journal of the Transportation Research Board, 1518, 1-6.
Fehr & Peers. 2015. SF TDM Framework for Growth: Summary of Survey Results. Research Report. San
Francisco, CA: San Francisco Planning Department, San Francisco Municipal Transportation Agency.
Hennessey, D., and Bingham, A. 2016. Rough Proportionality and the City of Austin. Austin Bar Association
2016 Land Development Seminar, Austin, TX.
ITE, 2012. Trip Generation Manual, Ninth Edition. Institute of Transportation Engineers, Washington, D.C.
ITE, 2017. Trip Generation Manual, Tenth Edition. Institute of Transportation Engineers, Washington, D.C
Millard-Ball, A. 2015. Phantom trips: Overestimating the traffic impacts of new development. Journal of
Transport and Land Use, Volume 8, No. 1, 31-49.
San Diego Association of Governments (SANDAG). 2002. Brief Guide of Vehicular Traffic Generation Rates
for the San Diego Region.
SANDAG. 2010. Trip Generation for Smart Growth: Planning Tools for the San Diego Region. San Diego,
Calif.
Schneider, R., Shafizadeh, K., and Handy, S. 2015. Method to adjust Institute of Transportation Engineers
vehicle trip-generation estimates in smart-growth areas. Journal of Transport and Land Use,
Volume 8, No. 1, 69-83.
Shafizadeh, K., Lee, R., Niemeier, D., Parker, T., and Handy, S. 2012. Evaluation of Operation and Accuracy
of Available Smart Growth Trip Generation Methodologies for Use in California. Transportation
Research Record: Journal of the Transportation Research Board. 2307. 120-131.
Walters, G., R. Ewing, and W. Schroeer. 2000. Adjusting computer modeling tools to capture effects of
smart growth: Or “poking at the project like a lab rat.” Transportation Research Record 1722, 17–26.
Walters, J., Bochner, B., & Ewing, R. 2013. Getting trip generation right: Eliminating the bias against mixed
use development. American Planning Association Planning Advisory Service Memo.
SMALL DATA: Local Trip Generation Data and Developing a Better Model for the City of Austin, Texas
BIG RED DOG, a division of WGI | BIGREDDOG.com | 23Questions?
Contact Dan Hennessey, PE, TE, PTOE
Director of Transportation Services
BIG RED DOG, a division of WGI
(512) 669-5560
dan.hennessey@bigreddog.com
About BIG RED DOG, a division of WGI
BIG RED DOG (BRD) is a Texas-based engineering firm that
specializes in Civil, MEP, Structural, Traffic, and Transportation
Engineering for real estate, infrastructure, and natural resource
development on behalf of public and private clients.
Our company values are straightforward and well-known by our
clients, peers, and industry: passion, service, quality, accountability,
opportunity, and fun – and we constantly affirm and live up to them.
BIG RED DOG has been named an Inc. 5000 fastest-growing private
firm in America by Inc. Magazine, Fast 50 growth company by the
Austin Business Journal, and is a recipient of the Zweig Group’s Hot
Firm award and Best Firms To Work For award in 2018. BIG RED DOG
has offices in Austin, Dallas, Houston, San Antonio, and Sugar Land,
Texas.
As of January 1, 2019, BRD is a division
of WGI (Wantman Group, Inc.), a
forward-thinking, national design
firm in the public and private infrastructure markets. The fastest-
growing Florida-headquartered firm and the fastest-growing firm
in Texas will now operate as a single entity, creating exhilarating
future opportunities. WGI, like BRD, looks ahead to design advanced
infrastructure with an appreciation for autonomy, smart &
connected communities, intelligent structures, and much more.
For more information about BIG RED DOG, please visit
BIGREDDOG.com.
For more information about WGI, please visit
WGInc.com.You can also read