THE LADM-BASED 3D UNDERGROUND UTILITY MAPPING: CASE STUDY IN SINGAPORE - ISPRS ...
←
→
Page content transcription
If your browser does not render page correctly, please read the page content below
The International Archives of the Photogrammetry, Remote Sensing and Spatial Information Sciences, Volume XLII-4/W15, 2019
                                   14th 3D GeoInfo Conference, 24–27 September 2019, Singapore

      THE LADM-BASED 3D UNDERGROUND UTILITY MAPPING: CASE STUDY IN
                              SINGAPORE

                              Jingya YAN1 ∗, Siow Wei JAW1,4,5 , Kean Huat SOON2 , Gerhard SCHROTTER3
                       1
                    ETH Zurich, Future Cities Laboratory, Singapore-ETH Centre - Jingya.yan@arch.ethz.ch
                            2
                              Singapore Land Authority, Singapore SOON Kean Huat@sla.gov.sg
                  3
                    Geomatik + Vermessung Stadt Zurich, Zurich, Switzerland Gerhard.Schrotter@zuerich.ch
                4
                  Geoscience & Digital Earth Centre (INSTeG), Research Institute for Sustainable Environment,
                                  Universiti Teknologi Malaysia, Malaysia; swjaw@utm.my
     5
       Department of Geoinformation, Faculty of Built Environment and Surveying, Universiti Teknologi Malaysia, Malaysia

KEY WORDS: Underground Utility, 3D Data Model, Land Administration Domain Model (LADM), Ground Penetrating Radar
(GPR), Utility Cadastre

ABSTRACT:

A digital twin can be defined as a realistic representation of something physical. To improve decision making, a reliable digital
twin of the underground is required. Utilities represent a significant portion of physical assets existing underground. Most of
these utilities are situated in the relatively shallow layers of the underground, up to a few meters below the surface. The reliable
information on subsurface utilities has clear benefits all throughout the life cycle of state land, resulting in efficient decision-making
processes, cost savings, and additional revenues for land administration professionals. However, the lack of a reliable map of
subsurface utilities lead to ill-informed decisions, costly information gathering, and missed business potential. This paper will share
a case study of the 3D underground utility mapping workflow from data capture to usage in Singapore. The new data is collected
by the Pegasus: Stream, a mobile mapping platform which captures above and underground data using the photo, laser and ground
penetrating radar technology. Based on the Land Administration Domain Model (LADM) 3D underground utility data model, the
new collected data is used with the existing utility and cadastral data for land administration. This study case expects to explore the
reasonable workflow of 3D underground utility mapping to provide reliable information for land administration.

                       1. INTRODUCTION                                   in Singapore. This study includes four application domains, (i)
                                                                         land acquisition and purchase, (ii) planning and coordination,
Over the years, in order to meet the many and growing needs              (iii) land transfer and sale, and (iv) land leasing. Before the
of urban development, a lot of underground spaces have been              return of land to Singapore Land Authority (SLA), the owner
used for the public infrastructures, such as utility lines, rail lines   needs to declare everything beneath the ground including util-
and roads. Complex underground infrastructure and inaccurate             ity services. The existing setup within the underground will
underground information complicates the development of un-               affect future developers design and impact on developing costs
derground space, the ownership of underground objects is not             directly. Currently, the existing data sources are a hardcopy
clear for example; the interdependency of above ground and un-           of the utility network, 2D CAD and 2D geospatial informa-
derground has not presented directly, another example. Having            tion. Without depth information, it is difficult to known whether
said that, some countries and institutions have implemented or           the data represents the current situation, the possibly different
at least conceptualized the 3D mapping of underground utility            as-built state, or just the as-designed state. Furthermore, the
network and their management in relation to cadastral system.            geometric accuracy and the completeness of the area often un-
The City of Zurich for instance has an own utility cadaster plat-        known. Obviously, there is an urgent demand of 3D geospatial
form since 1999 and has set up a governance framework with               information of underground utility and space to evaluate un-
the corresponding utility providers. UK, Qubec and Rotterdam             derground environment and support reallocation, land sales and
begin to register underground objects for land administration.           the other applications. It is necessary to register the utility seg-
                                                                         ments as the legal objects in the land administration system,
Singapore is a city state that experiencing land scarcity, where         which helps to identify the ownership of underground utility.
there is a need to optimize land resources for economic and
social development. The use of underground spaces in Singa-
                                                                         A reliable 3D digital map of utility networks is crucial for urban
pore is increasingly evolving multi-layered overlapping devel-
                                                                         planners to understand the impactful aspects of the underground
opment for transportation, utility infrastructure and storage fa-
                                                                         space. A consolidated underground utility database is backbone
cilities. To support the use of these underground spaces, a
                                                                         to connect data acquisition and usage. The aims of this paper
Singapores Underground Masterplan will unveil in the year
                                                                         are to design and implement a 3D utility data model for land ad-
2019. A good spatial understanding of underground informa-
                                                                         ministration based on large scale underground utility mapping
tion is undoubtedly a key driver of smart planning and resilient
                                                                         in Singapore. Our previous work (Yan et al., 2019) provides a
use of the underground spaces. In order to understand the de-
                                                                         workflow of data governance includes data capture, processing,
mands of underground utility data users, a workshop was organ-
                                                                         integration, storage and using. This work provides a case study
ized to learn the work process and needs of land administration
                                                                         of 3D utility mapping workflow from data capture to data mod-
   ∗ Corresponding   author                                              elling. It includes two main tasks:

                                                   This contribution has been peer-reviewed.
                      https://doi.org/10.5194/isprs-archives-XLII-4-W15-117-2019 | © Authors 2019. CC BY 4.0 License.                    117
The International Archives of the Photogrammetry, Remote Sensing and Spatial Information Sciences, Volume XLII-4/W15, 2019
                                      14th 3D GeoInfo Conference, 24–27 September 2019, Singapore

  • The conceptual design of LADM-based 3D underground
    utility data model. In order to connect 3D modelling of
    underground utility to land administration, some of the at-
    tributes and values of this data model are inherited from
    Singapore cadastral data model and LADM (ISO 19152).
    The LADM is a link to build a relationship between the
    geometric information of utility network and land admin-
    istration management. Some objects and attributes of this
    data model will inherit LADM and Singapore cadastral
    data model. Meanwhile, the geometric and spatial defini-
    tion are inherited from spatial schema data model.

  • Based on the 3D underground utility data model, a con-
    solidated underground utility database will be developed.
    In this database, the underground utility data will be in-
    tegrated with cadastral data. The underground utility data
    includes two parts: one is the existing data in the database
    of the government agency, which is as-build data in the                 Figure 1. The Pegasus:Stream during its deployment in
    2D form; the other is the newly collected data by Ground                                     Singapore.
    Penetrating Radar (GPR).
                                                                        Overall weight                     228 kg (500 lbs)
                                                                        Max. acquisition speed             15 kph (9mph)
Section 2 shows the case study of using the Pegasus: Stream,            Power consumption                  72W
a mobile mapping platform which captures above and under-                                                  Survey wheel and/or GPS
                                                                        Positioning
ground data using the photo, laser and ground penetrating radar                                            or Total Station
technology in Singapore. Section 3 introduces the design of 3D          Scan Rate per Channel
                                                                                                           87 scans/sec
underground utility data model for land administration. Based           (@512 samples/scan)
on the results of data capture by Pegasus and the data model, a         Scan Interval                      17 scans/m @ 200 MHz
                                                                                                           33 scans/m @ 600 MHz
study case is implemented to visualize the land administration          Antenna Footprint                  Width 1.84m
information of underground utilities.                                   Number of Channel                  38
                                                                        Antenna Central Frequencies        200 MHz (34 channels)
                                                                                                           600 MHz (4 channels)
       2. LARGE SCALE UNDERGROUND UTILITY                               Antenna Spacing                    6cm
          MAPPING: CASE STUDY IN SINGAPORE                                                                 Horizontal (HH) and
                                                                        Antenna Polarization               Vertical (VV)
2.1     Mobile based 3D Ground Penetrating Radar
                                                                            Table 1. Technical specifications of the Stream EM GPR.

The Pegasus: Stream mobile mapping platform was deployed              The Stream EM GPR uses on impulse radar GPR technology. It
at the nine selected study sites in Singapore (Figure 1). This        features a large number of ground-coupled antennae, with dual
mobile mapping platform is first time deployed in South East          frequencies (200 MHz and 600MHz). Its 40 separate antennae
Asia. It aims to assess the feasibility of the large volume of        transmit and receive in two distinct polarizations (HH and VV),
data capture by this platform to improve the quality of under-        allowing it to cover wide road surfaces and provide optimum
ground utility survey in provide reliable underground utility         detection for main and junction pipes at the same time. With
data. Eventually, this can contribute to sustainable city plan-       such unique design and high numbers of antenna on board, it is
ning and underground land administration. This mobile map-            expected to increase data quality and reliability of pipe detec-
ping platform combines a Stream EM GPR and Leica Pegasus              tion.
Two photo and laser scanner. The Pegasus:Stream allows the
capturing of large volume underground data and imagery and            2.2    Study Sites and Case Study Primary Results
point clouds of the above ground features. All the data cap-
tured by the Pegasus: Stream is geo-referenced using a combin-        Nine study areas were selected in different areas of Singapore.
ation of on-board sensors that include a GNSS receiver, an Iner-      The selection includes a “virgin” practice area (near the fu-
tial Measurement Unit (IMU), and a Distance Measurement In-           ture Canberra MRT station), relatively new residential estates
strument (DMI). The technical specifications of the Stream:EM         (Punggol and Sengkang), relatively old residential estates (Ang
GPR are shown in Table 1.                                             Mo Kio and Toa Payoh), parts of the central business district
                                                                      (Raffles Boulevard and Marina Boulevard), an industrial estate
In operation, this platform is towed behind a vehicle moving at       (Woodlands Spectrum), and the University Town campus of the
a speed of not more than 15km/h. This means it can theoret-           National University of Singapore. With the selection of differ-
ically cover and capture data of over tens of hectares per day.       ent areas, it was attempted to investigate different subsurface
The potential of large-area data capture without interruption of      contexts, e.g. different soil conditions, different utility layouts,
traffic flows can reduce cost and time for mapping significantly.     and changes due to the progression of the subsurface over time.
Despite this, and due to the slow speed of movement and lack of       Figure 2 shows the distribution of the nine selected study areas.
safety features on the platform itself, an auxiliary police escort-
ing service was engaged for safety purposes. A special purpose        The scanning for the nine selected study areas was conducted in
license was acquired from LTA to allow the platform on the            the span of six days with around eight hours of work each day.
roads of the selected case study areas only.                          This includes the time used to mount and unmount the platform

                                                 This contribution has been peer-reviewed.
                    https://doi.org/10.5194/isprs-archives-XLII-4-W15-117-2019 | © Authors 2019. CC BY 4.0 License.                   118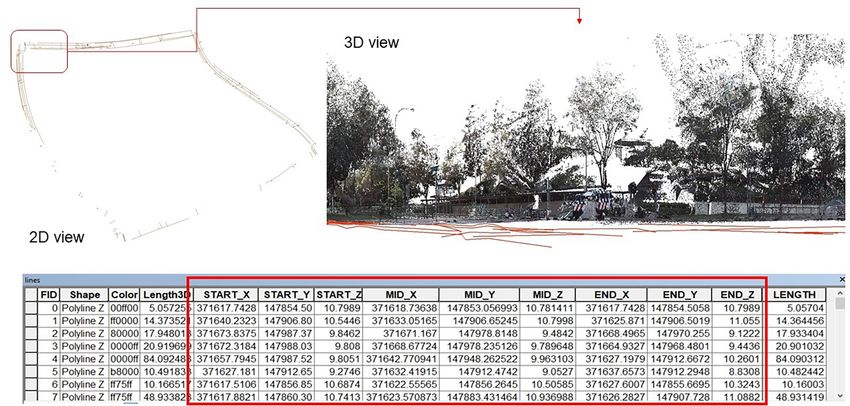
The International Archives of the Photogrammetry, Remote Sensing and Spatial Information Sciences, Volume XLII-4/W15, 2019
14th 3D GeoInfo Conference, 24–27 September 2019, Singapore
ported to CAD and GIS format for further 3D modelling and
visualization.
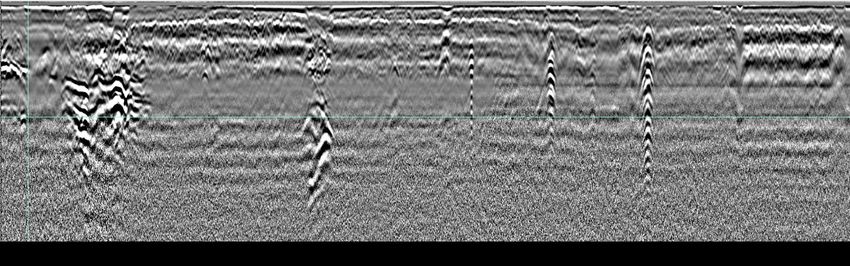
(a) Bad quality radargram
Figure 2. Map of case study areas for Pegasus:Stream.
from its transporting vehicle and the return trip to transport the
platform from its storage location. For a single scan, the Stream (b) Better quality radargram
EM can cover a swath of 1.75m in width. In Singapore, the
lane width is about 3.2m or wider. Therefore, two scan track Figure 4. GPR signal are highly dependent on soil condition
are typically required to cover a single lane. Over the course of during signal transmission.
six days, a total of 700GB underground data and 450GB above
ground data were collected. A CAD drawing containing all captured data is shown in Fig-
ure 5. The use of a mobile mapping platform offers an enorm-
In this paper, we reported the most representable case study res- ous potential for fast subsurface data acquisition with minimal
ults at Toa Payoh. The main scanning route in Toa Payoh is a bi- disruption to traffic. The case study in Tao Payoh, demon-
directional loop around the selected area in between Lor 4 Toa strates that data captured using 3D mobile GPR can be used
Payoh, Lor 3 Toa Payoh, Lor 2 Toa Payoh, and Toa Payoh Cent- as a complement to existing records, especially for the mapping
ral (Figure 3). The total length for one loop is about 1.8km. The at old estate where those utilities were buried long ago and the
scanning started and ended at the loading site. All roads consist utility records are incomplete or outdated. GPR seems to be
of 4 lanes (2 lanes for each carriageway). The scanning at Toa paramount importance for mapping the underground utilities.
Payoh proved to be challenging due to local traffic conditions However, there are others current technology that overcome the
and took a longer time to complete as compared to new resid- shortcoming of GPR available on the market, such as laser scan-
ential estates like Punggol or Sengkang. The total time need for ning or gyroscopic mapping. No single detection technique can
the scanning at Toa Payoh is 5-6 hours while the scanning at detect the entire type of utilities in every location. Hence, GPR
Punggol or Sengkang is about 3.5 hours only. is not the only solutions for underground utility mapping, using
more technologies increases the detection capability, coverage,
efficiency and accuracy.
Figure 5. Example of output in CAD format for extracted
utilities (yellow lines) and captured point clouds.
Figure 3. Toa Payoh scanning route.
3. 3D UNDERGROUND UTILITY DATA MODEL
All acquired data were pre-processed to enhance the quality of
the radargram before further interpretation. Then, a GPR spe- Our previous work presents the conceptual design of 3D un-
cialist interpreted and analysed the radargram (so-called B scan) derground utility data model (Yan et al., 2019), which includes
to detect and extract subsurface utilities of the scanned area. geometric information of utilities, data accurate management
The quality of the captured data is essential to determine the and land administration of underground utilities. This section
interpretation results (Figure 4). If the data quality is not good, introduces the logical design that focuses on the geometric in-
it may lead to misinterpretation. After that, the data was ex- formation and land administration of underground utilities.
This contribution has been peer-reviewed.
https://doi.org/10.5194/isprs-archives-XLII-4-W15-117-2019 | © Authors 2019. CC BY 4.0 License. 119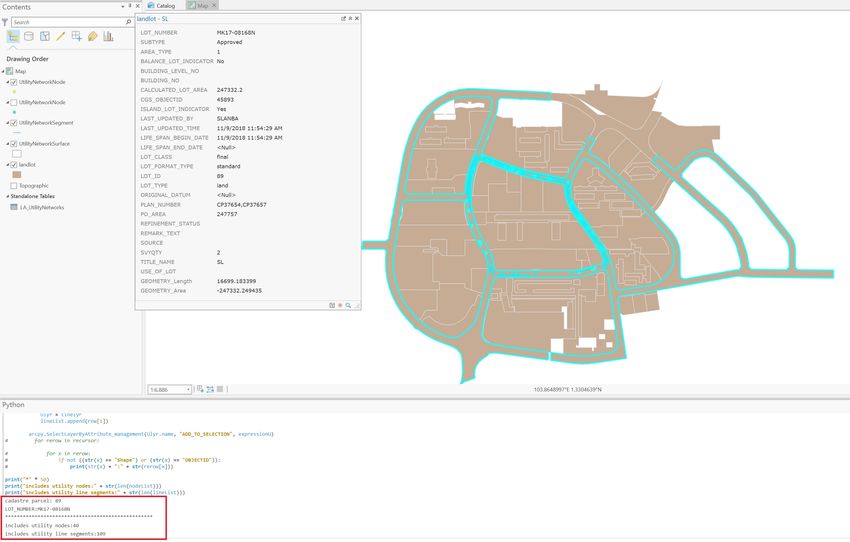
The International Archives of the Photogrammetry, Remote Sensing and Spatial Information Sciences, Volume XLII-4/W15, 2019
14th 3D GeoInfo Conference, 24–27 September 2019, Singapore
3.1 Logical Design of Data Model support ownership management of utilities and land adminis-
tration management.
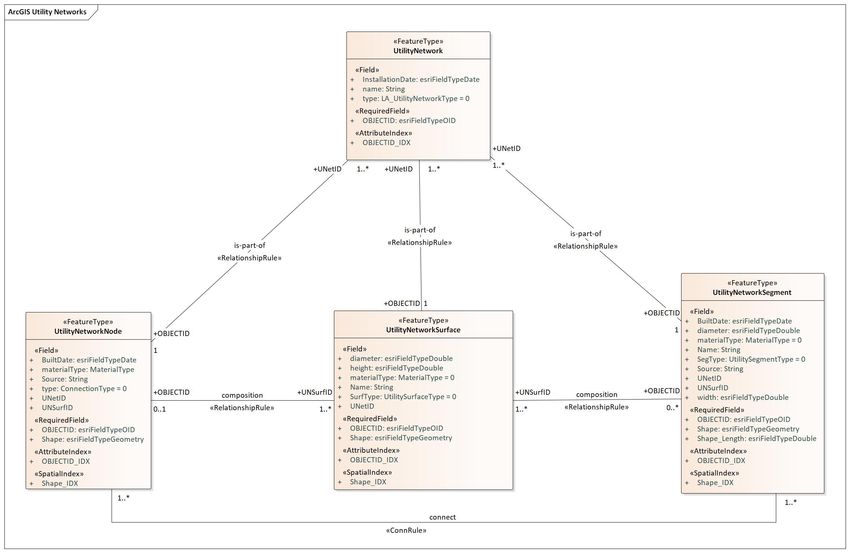
Based on the multilevel structure of utility network that is
defined in our previous work (Yan et al., 2019), the utility net-
work package should describe the geometric and spatial inform-
ation of utility networks. Figure 8 shows the logical design of
utility network package. The class Utility Network describes
the attributes of the whole network at the top level, includes in-
stallation date and the type of utility network (e.g. water and
gas). The class Utility Network Node, Utility Network Segment
and Utility Network Surface are components of utility network.
The class Utility Network Node and Utility Network Segment
describe 2D geometric information and the other attributes of
line segments and connect nodes of utility network. If the data
has 3D information, the nodes and line segments are connected
to the class Utility Network Surface. The class Utility Network
Surface aims to describe the 3D objects of utility network, such
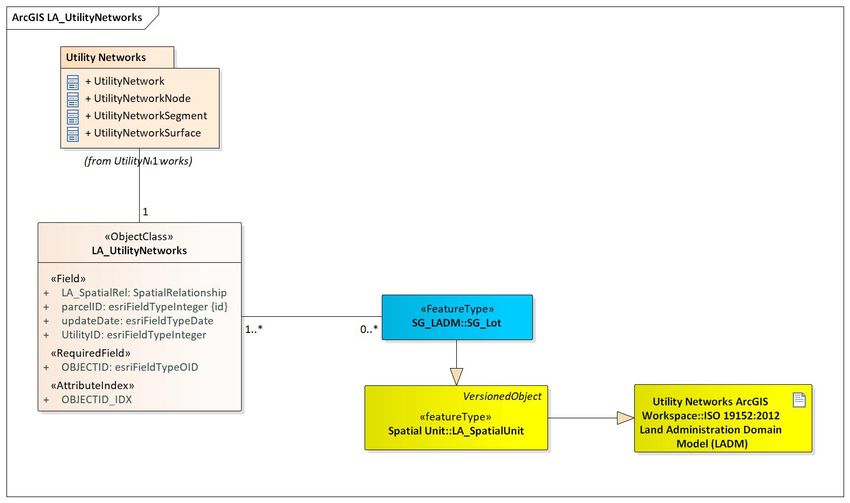
Figure 7. The connection of utility networks and land
as duct and manhole.
administration.
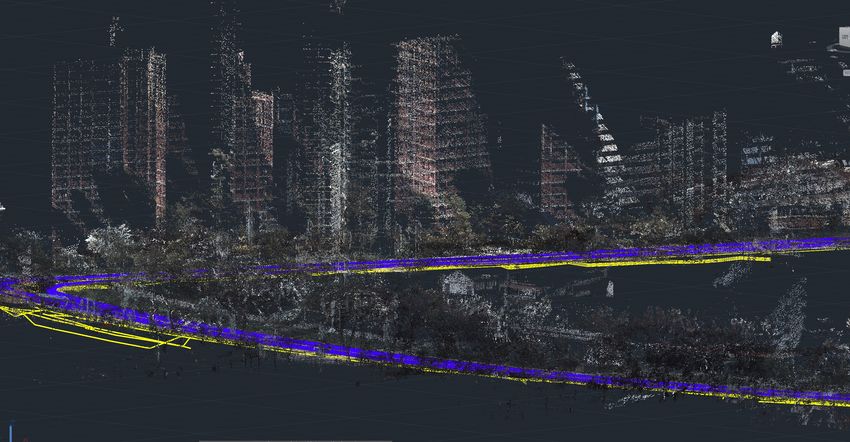
3.2 Study Case
3.2.1 Data Source: This study case uses three groups of
datasets:
• The existing 2D utility data from GeoSpace includes water
supply, sewerage, drainage, telecommunication and power
grid networks.
• The 2D cadaster data from SLA. Figure 8 shows the exist-
ing utility and cadastral data in Toa Payoh.
• The new collected data using GPR, an above and un-
Figure 6. The logical data model of utility networks.
derground mobile mapping platform that combines laser,
photogrammetry and ground penetrating radar technology.
The class LA UtilityNetworks plays a connection role between The data were post-processed in order to obtain digital 3d
the LADM and utility networks. The LADM is an important models of both the environment above ground environ-
legal framework to define and integrate concepts and termin- ment and underground utilities in different format. After
ology of Land Administration for 3D representations (Inter- data processing, the GPR data needs to export to CAD
national Standards Organization, 2012). As an international format or GIS format with x, y, z value as points and lines
standard, the LADM provides a flexible conceptual schema for 3D data modelling and visualization. Figure 9 shows
from three main aspects: organizations, rights and spatial in the result of GPR in GIS format in 2D view and 3D view
formations. The integration of 2D and 3D information in with point cloud data that were collected by the Pegasus:
the LADM can provide solutions for 3D Cadastre. However, Stream.
LADM still lacks of information about underground utility ser-
vices. To complement this, the 3D underground utility data
model is developed to integrate underground objects with at-
tributes from Singapore LADM, a Singapore-based LADM
model customized specific for local use. Based on LADM,
SLA began to develop a Singapore cadastral data model in
2014. It addresses the survey data from field to core data-
base. Associated administrative and spatial data are included
where it provides the complete picture of the cadastral data-
base. The Singapore profile inherit LADM objects, attributes
and relationships where possible, and implement new items
where necessary. In the 3D underground utility data model, the
class LA UtilityNetworks connects to Utility Networks pack-
age. Meanwhile, this class connect to Singapore cadastral data
model to get related land administrative information. As an im-
portant role in the land administration, cadastral parcel should
be connected to the underground utility networks(Pouliot, Gir-
ard, 2016, Dner et al., 2011). Hence, the main objective of this Figure 8. The existing utility and cadaster data of Toa Payoh
class is to connect cadastral parcels and utilities through spatial (Data source: Singapore Land Authority).
relationships, such as contain, cross and touch. This class could
This contribution has been peer-reviewed.
https://doi.org/10.5194/isprs-archives-XLII-4-W15-117-2019 | © Authors 2019. CC BY 4.0 License. 120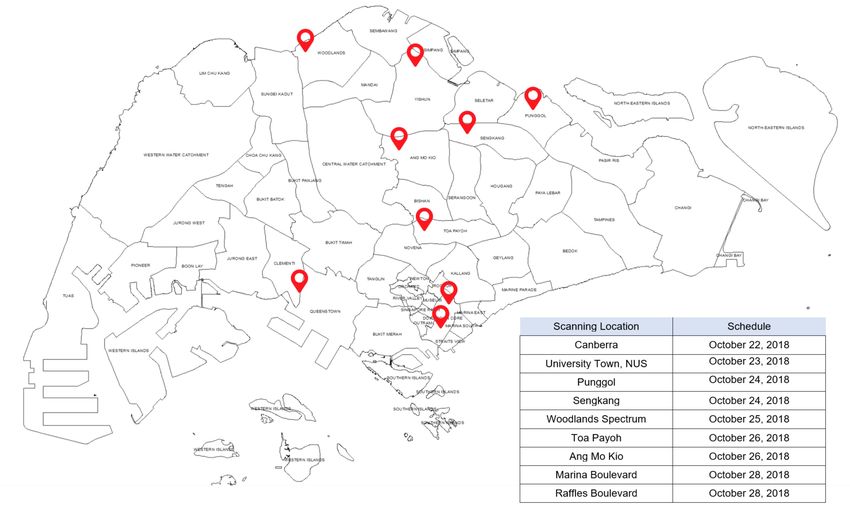
The International Archives of the Photogrammetry, Remote Sensing and Spatial Information Sciences, Volume XLII-4/W15, 2019
                                   14th 3D GeoInfo Conference, 24–27 September 2019, Singapore

                                                                       is modelled in 3D. Second, the new collected data should be
                                                                       loaded into the new underground utility database. The points
                                                                       and line segments of GPR data are stored in the feature layers
                                                                       UtilityNetworkNode and UtilityNetworkSegment. The 3D data
                                                                       is stored in the UtilityNetworkSurface.

                                                                       According to the underground utility database, the relationship
                                                                       of land parcel and underground utilities can be queried. Figure
                                                                       11 shows an example of querying and visualization of cadastral
                                                                       information of land parcel and the underground utilities that are
                                                                       located within the land parcel in 2D. This example is realized by
               Figure 9. Results from data capture.                    ArcPy. The simple statistic information is shown in the red box
                                                                       of Figure 11, which means the cadastral parcel 89 includes 40
                                                                       utility nodes and 109 utility line segments in total. The detail
3.2.2 Implementation: The data model is designed by En-                information of cadastral parcel 89 is shown in a pop window
terprise Architect 14 using Unified Modeling Language (UML).           and all the objects are selected in the map.
The utility database is developed based on ArcGIS pro 2.1.
Hence, the UML data model is exported as XML document and
imported to ArcGIS as File Geodatabase. Figure 11 shows the
database by tree structure that includes three feature layers and
three tables. This work has two steps to integrate the existing

                                                                          Figure 11. Visualization of underground utilities with land
                                                                                      parcel and cadastral information.

                                                                                            4. CONCLUSION

                                                                       This study case aims to test the workflow of 3D underground
                                                                       utility mapping from data capture to data usage for land ad-
                                                                       ministration. During this process, the main contributions are
       Figure 10. Underground utility database structure.              providing the reliable underground utility data and connect it
                                                                       to land administration. The use of a mobile 3D GPR plat-
utility data and new collected data. First, in order to improve        form offers enormous potential for fast subsurface data collec-
the attributes of new collected data, this experiment needs to         tion for the roads of large areas, with minimal disruption to
identify new collected data from the existing utility database,        traffic. From the captured data, it can be observed that sub-
which is based on spatial matching of the extracted features           surface utilities installed in newer areas typically appear to be
with other data. In order to match features, an operator overlaid      better organized and planned. Most of the utilities are installed
the extracted features with the other data. Based on measures of       under the road reserve. The space under carriageways of Toa
spatial similarity (overlap, proximity, and visual similarity), the    Payoh is occupied by many different utilities in often complex
operator decided whether features could be positively matched.         arrangements. Meanwhile, a 3D underground utility data model
But the 2D GIS data of existing utilities imposed the following        is designed and developed as a consolidated database. During
limitations: i) The lack of elevation only allows for horizontal       the integration of the new collected data and the existing util-
comparison, i.e. comparison of x and y coordinates. In cases           ity data, this work attempts to explore methods for integration
of horizontally overlapping utilities, this complicated matching       of existing utility data and newly captured data. This showcase
and identification; ii) Identification is to take place based on ho-   presents the connection between underground utility and land
rizontal overlap and proximity only. However, in many cases,           administration based on a 3D underground utility data model.
the existing data did not match well with the utilities identified
during data capture. This is likely due to a lack of accuracy.         This case can be concluded that a combination of GPR and ex-
Additionally, it was observed that the above ground colourized         isting data alone is not sufficient to improve the accuracy of
point cloud data is not sufficiently detailed or suitable to con-      information on existing subsurface utilities. How to use the ex-
firm manhole locations, let alone identify the type of utility that    isting data? How to integrate the existing and new collected
is located underneath. Roughly, about 26% new collected data           data? For the next step, resources are required to build a com-
can be identified from the existing utility database. After iden-      prehensive 3D subsurface utility database, but also to develop
tification of the required information, the new collected data         a feasible approach to integrate existing and newly collected

                                                This contribution has been peer-reviewed.
                   https://doi.org/10.5194/isprs-archives-XLII-4-W15-117-2019 | © Authors 2019. CC BY 4.0 License.                  121
The International Archives of the Photogrammetry, Remote Sensing and Spatial Information Sciences, Volume XLII-4/W15, 2019
                                   14th 3D GeoInfo Conference, 24–27 September 2019, Singapore

data. Moreover, the 3D underground utility data model con-
nects underground utilities to cadastral parcel, which could help
to identify the ownership of underground utility in land admin-
istration. However, the cadastral data is 2D in Singapore, which
might not accurate to identify the spatial relationship of under-
ground utilities and land parcel in vertical space. In the future,
we will collaborate with selected agencies to evaluate and im-
prove the 3D utility data model. Their recommendations could
help to extend data model include other underground infrastruc-
tures and develop the platform of underground space manage-
ment to support various applications in Singapore.

                 ACKNOWLEDGEMENTS

This publication has been realized as part of the project “Digital
Underground: 3D Mapping of Utility Networks” at the Future
Cities Laboratory, established by ETH-Zurich and Singapores
National Research Foundation (NRF), and operating under the
auspices of the Singapore-ETH Centre.

                        REFERENCES

Dner, F., Thompson, R., Stoter, J., Lemmen, C., Ploeger, H.,
Oosterom, P. v., Zlatanova, S., 2011. Solutions for 4D cadastre
with a case study on utility networks. International Journal
of Geographical Information Science, 25(7), 1173–1189. ht-
tps://doi.org/10.1080/13658816.2010.520272.

International Standards Organization, 2012. ISO 19152: Geo-
graphic information Land Administration Domain Model
(LADM).

Pouliot, J., Girard, P., 2016. 3d Cadastre: With or Without Sub-
surface Utility Network? International Federation of Surveyors
(FIG), Athens, Greece. OCLC: 831214525.

Yan, J., Jaw, S. W., Soon, K. H., Wieser, A., Schrot-
ter, G., 2019. Towards a 3D Data Model of Un-
derground Utilities for Land Administration. ht-
tps://www.preprints.org/manuscript/201904.0223/v1.

                                                This contribution has been peer-reviewed.
                   https://doi.org/10.5194/isprs-archives-XLII-4-W15-117-2019 | © Authors 2019. CC BY 4.0 License.          122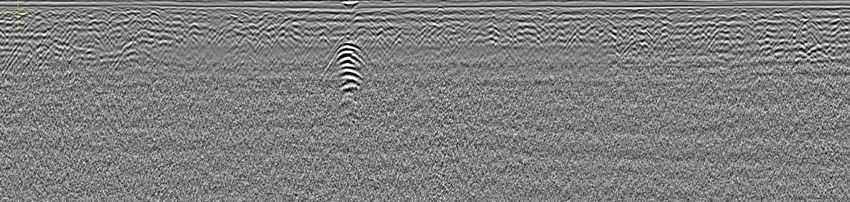
You can also read