Interim Results Presentation August 2019 - Henry Boot PLC
←
→
Page content transcription
If your browser does not render page correctly, please read the page content below
Interim Results Presentation August 2019
Agenda

                    Investment Proposition     page 1
                    Operational Highlights     page 2
                    Financial Review           page 3
                    Land Promotion             page 10
                    Property Investment        page 15
                    & Development
                    Construction               page 18
                    Investing for the Future   page 20
                    Outlook Summary            page 21
                    Appendices                 page 22
                    The Henry Boot Way         page 30

Interim Results Presentation
August 2019
                                                         Respect | Integrity | Loyalty | Delivery | Adaptability | Collaboration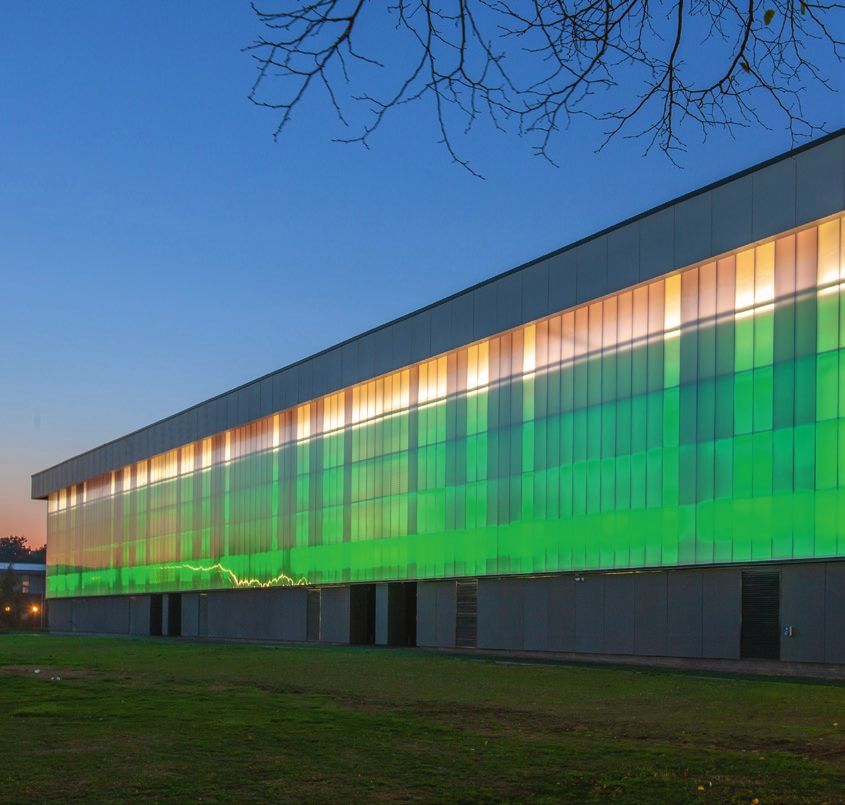
Investment
               Proposition
                     Strong financial track record over the long term.

                     Long established with an efficient capital structure.

                     Robust Group structure through diversity of operations.

                     Low gearing allowing opportunistic land and
                     property acquisitions.

                     Incremental shareholder dividends and NAV growth
                     through retained earnings.

                     Land portfolio held at cost with no recognition
                     of planning gain on 15,427 plots.
                     £1.6bn pipeline of property development opportunities.

Interim Results Presentation
August 2019
                                                                             Respect | Integrity | Loyalty | Delivery | Adaptability | Collaboration   page 1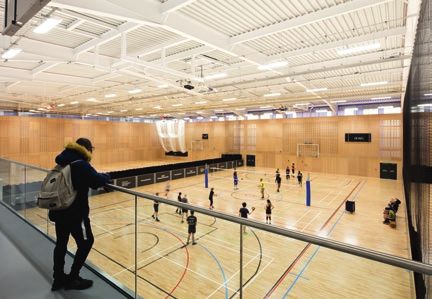
Operational
Highlights                                                          Interim Dividend
                                                                    to 3.7p
                                                                                                      NAV
                                                                                                      233p per share

 Good start to 2019 with a very resilient
 result, given current uncertainties affecting
 the UK economy.                                        16% 2.6%
 Strategic land portfolio of 14,077 acres,15,427
 units permissioned, 10,570 units in planning                       2,148                              GDV Pipeline
 process. 15 land disposals for 2,148 plots.                        Plot disposals

                                                        13% £1.6bn
 £333m Aberdeen scheme achieved
 practical completion on 2nd August,
 in line with expectation and on budget.

 GDV of current development schemes
 in delivery over £850m, with over £480m
 delivered since 2017.
                                                                    14,077 Acres                       95%
                                                                                                       construction
 Estimated GDV of opportunity pipeline                                                                 activity secured
 circa £1.6bn.

 68 unit sales by Stonebridge Homes.

 95% of annual construction activity secured,
 71% of 2020.
                                                        2% 12%
 Interim Results Presentation
 August 2019
                                                   Respect | Integrity | Loyalty | Delivery | Adaptability | Collaboration   page 2
Turnover Trading Profit
Financial
2019 £189.0m 2019 £24.4m
2018 £196.2m 2018 £24.8m
Highlights 2017
2016 £107.3m
£195.4m 2017
2016
£24.6m
£21.6m
2015 £79.2m 2015 £11.8m
Turnover remains strong at £189m, Profit Before Tax EPS
supported by Aberdeen project. 2019 £24.1m 2019 14.2p
Trading profit underpinned by strong 2018 £26.2m 2018 15.7p
land sales. 2017 £22.6m 2017 13.1p
PBT at £24m reflects a good start 2016 £20.8m 2016 11.9p
to the year. 2015 £14.0m 2015 7.8p
EPS 14.2p supports our 3 times
dividend cover policy.
Full Year Dividend Per Share NAV Per Share
Interim dividend of 3.7p, up 16%.
2019 3.7p 2019 233p
Net debt £50m, 16% gearing. 2018 3.2p 5.8p 9.0p 2018 217p
2017 2.8p 5.20p 8.0p 2017 184p
2016 2.5p 4.50p 7.0p 2016 171p
HY
2015 2.3p 3.80p 6.1p FY 2015 160p
Interim Results Presentation
August 2019
Respect | Integrity | Loyalty | Delivery | Adaptability | Collaboration page 3Financial
Segmental Revenue 8 %
Land Promotion
Land Promotion revenues higher due to increased
number of plot disposals.
HY 2019 HY 2018
Higher activity levels in Construction as Barnsley £38.7m £35.7m
town centre phase 2 commences. Additional works
11
undertaken by Road Link for Highways England to
design two new roundabouts.
%
Property Investment and Development revenue down,
but offset by Stonebridge house sales. Construction
HY 2019 HY 2018
£54.1m £48.9m
14 %
Property Investment and Development
HY 2019 HY 2018
£96.2m £111.6m
Interim Results Presentation
August 2019
Respect | Integrity | Loyalty | Delivery | Adaptability | Collaboration page 4Financial
Segmental PBT
26 1
Land Promotion returns
maintained from disposing
of 2,148 plots, up from % %
32
1,904 in 2018, but at a lower
blended gross profit per
plot sold as more planning
promotion sites sold.
% Property Investment
and Development
Land Promotion
Construction
As expected, Property
Investment and Development
returns lower, as new
sites start to conclude
infrastructure phase.
Construction returns higher
due to better margins and
an increased level of activity.
HY 2019 £5.4m HY 2018 £4.1m HY 2019 £6.4m HY 2018 £8.6m HY 2019 £15.3m HY 2018 £15.5m
Interim Results Presentation
August 2019
Respect | Integrity | Loyalty | Delivery | Adaptability | Collaboration page 5Financial 2019 2018
Balance Sheet Half Year
(£m)
Full Year
(£m)
Intangible assets 4.9 5.1
Property, Plant and Equipment 28.6 26.2
Investment Properties 79.1 121.0
Investment in joint ventures 6.8 6.7
Trade and other receivables 8.6 11.9
Deferred tax assets 3.7 3.4
2019 2018
Half Year Full Year Fixed Assets 131.7 174.3
(£m) (£m)
Inventories 170.2
155.0
Contract Assets 50.7 42.8
Group occupied (Investment) property 7.9 7.9
Trade and other receivables 71.4 60.2
Equipment held for hire 10.3 14.1
Cash and cash equivalents 8.0 10.8
Right of use assets 6.6 –
Assets classified as held for sale 43.5 –
Vehicles and office equipment 3.8 4.2
Current Assets 343.8 268.8
Property, Plant and Equipment Total 28.6 26.2
Borrowings (58.3) (29.2)
Completed investment property 74.6 117.6 Retirement benefit obligations (18.3) (16.7)
Investment property under construction 4.5 3.4 Other liabilities (88.1) (94.9)
Investment Properties Total 79.1 121.0 Total Liabilities (164.7) (140.8)
Developments in progress 39.1 24.6 Shareholder equity 308.5 299.2
House builder land and work in progress 27.6 22.5 Minority interests 2.3 3.1
Land held for development or sale 56.6 58.8
Options to purchase land 14.2 16.5 Total Equity 310.8 302.3
Planning promotion agreements 32.7 32.6
Net debt (50.3) (18.6)
Gearing (debt/equity) 16% 6%
Inventories Total 170.2 155.0
NAV per share 233p 227p
Interim Results Presentation
August 2019
Respect | Integrity | Loyalty | Delivery | Adaptability | Collaboration page 6Financial Pensions
Initial triennial valuation results deficit £19m. Recovery
plan contributions £3.25m rising to £3.75m over 5 years.
Regulator becoming increasingly formulaic and driving
reduction in risk and therefore asset returns.
IAS 19 deficit at 30/06/19 £18.3m, asset performance
+8.8% in period, however discount rate now 2.2%
(31/12/18 2.8%) effectively increasing liabilities by £19m.
Gross assets of £185m.
Long term investment return (since 03/2010) 7.8%,
breakeven return 3.8% (trending downwards).
90%
80%
70%
Cumulative return
60%
50%
40%
30%
20%
10%
0%
-10%
Dec 2010
Jun 2011
Dec 2011
Jun 2012
Dec 2012
Jun 2013
Dec 2013
Jun 2014
Dec 2014
Jun 2015
Dec 2015
Jun 2016
Dec 2016
Jun 2017
Dec 2017
Jun 2018
Dec 2018
Jun 2019
Scheme Breakeven return
Interim Results Presentation
August 2019
Respect | Integrity | Loyalty | Delivery | Adaptability | Collaboration page 7Financial
Cash Generation &
Movement in Net Debt Operating
Profit
Depreciation,
Amortisation
& Impairment
Inventories
Non-cash adjustment for depreciation, amortisation
of plant and Road Link investment £3.1m.
£24.7m £3.1m £15.3m
Inventories increased as we invested in house building
land and WIP and property development opportunities. Net Net Tax
Payables/ Interest
Receivables increased as a result of land sale debtors Receivables Expense
and the levels of forward funded pre-sold property
development, mainly at Aberdeen and Markham Vale.
£0.4m net interest expense reflects low interest rates
and prudent gearing. £26.6m £0.4m £3.9m
Tax paid of £3.9m.
Net
Net
Capital
Net Cash
Dividends £9.4m. Dividends Outflow Outflow
Net Capital outflow £4.1m as we invest in plant
hire assets.
Resulting in net cash outflow of £31.9m and increase
in net debt to £50.3m.
£9.4m £4.1m £31.9m
Interim Results Presentation
August 2019
Respect | Integrity | Loyalty | Delivery | Adaptability | Collaboration page 8Financial
2019 Guidance
Revenue Construction
Segment could be up circa 10% as Barnsley
Phase 2 commences.
Land
As always, is a function of site mix, currently
expected to be down 20% due to increased
agency disposals.
Property
We could see a 15–20% decrease as Aberdeen
concludes in August. Offset by around a 10%
uplift in Stonebridge activity.
PBT The Board’s expectations for the full year
remain unchanged but are reliant on satisfactory
completion of development projects and, as ever,
conclusion of key strategic land disposals.
Cash Continued investment in land and property circa
£30m+ asset disposals £45m+ expect net funds
at year end.
Interim Results Presentation
August 2019
Respect | Integrity | Loyalty | Delivery | Adaptability | Collaboration page 9Land
Promotion
Profit £15.3m (2018: £15.5m), 15 deals
completed and 2,148 plots sold in period.
Strategic land holdings of over 14,077 acres.
Investment totalling circa £104m.
Sites with planning permission for 15,427 units.
Planning consent won over the year 1,086
(HY 2018: 436).
Planning submitted and in progress on 23 schemes,
circa 10,570 units.
Continuing to acquire new schemes to replenish
land bank. Board approval granted for 19 new sites
in the year, over 6,490 plots and 500 net acres.
Interim Results Presentation
August 2019
Respect | Integrity | Loyalty | Delivery | Adaptability | Collaboration page 10Land Promotion
Inventory
Gross profit of £128m from 11,262 plots over 4.5 years
at an average of £11.3k per plot.
Land Bank
Owned Acres Agency/Optioned Acres Total
Jun19 1,412 Jun19 12,665 14,077
Dec18 1,562 Dec18 12,763 14,325
Dec17 1,608 Dec17 11,665 13,273
Dec16 1,749 Dec16 10,139 11,888
Dec15 1,804 Dec15 9,257 11,061
Average cost per acre
Owned £38k Agency/Optioned £4k Total £8k
Plots Of Which Permissioned Plots Sold in Period Gross Profit Per Plot Sold £000’s Profit Before Tax
Jun19 25,997 Jun19 15,427 Jun19 2,148 Jun19 £7.4 Jun19 £15.3m
Dec18 28,418 Dec18 16,489 Dec18 3,573 Dec18 £9.4 Dec18 £28.5m
Dec17 26,511 Dec17 18,529 Dec17 2,169 Dec17 £13.0 Dec17 £23.1m
Dec16 26,869 Dec16 16,417 Dec16 1,609 Dec16 £14.7 Dec16 £17.7m
Dec15 26,811 Dec15 12,043 Dec15 1,763 Dec15 £15.0 Dec15 £19.1m
Interim Results Presentation
August 2019
Respect | Integrity | Loyalty | Delivery | Adaptability | Collaboration page 11Land Promotion
Average Returns
2,792
Plots Sold Average Gross Profit Per Plot £000
1,484 30
1,500
25
1,025
23
1,186 1,144
1,000 19 19
15 15 13
963 800 15 16 13
781
664
500 11 9
8 8 7
423
7 7 5
0 0
2015 2016 2017 2018 HY 2019 2015 2016 2017 2018 HY 2019
Option/Agency Owned Option/Agency Owned Total
Interim Results Presentation
August 2019
Respect | Integrity | Loyalty | Delivery | Adaptability | Collaboration page 12Land Promotion
Inventory
30 June 2019 Interim
Company Land Interests Company Land Control
(Acres) (Acres)
Region Acres Acres
South West 2,784 Agency 10,031
South East 1,792 Optioned 2,634
South Midlands 3,840 Purchase 1,412
North Midlands 3,250 14,077
North West 368
North East 756
Scotland 1,287
14,077
Interim Results Presentation
August 2019
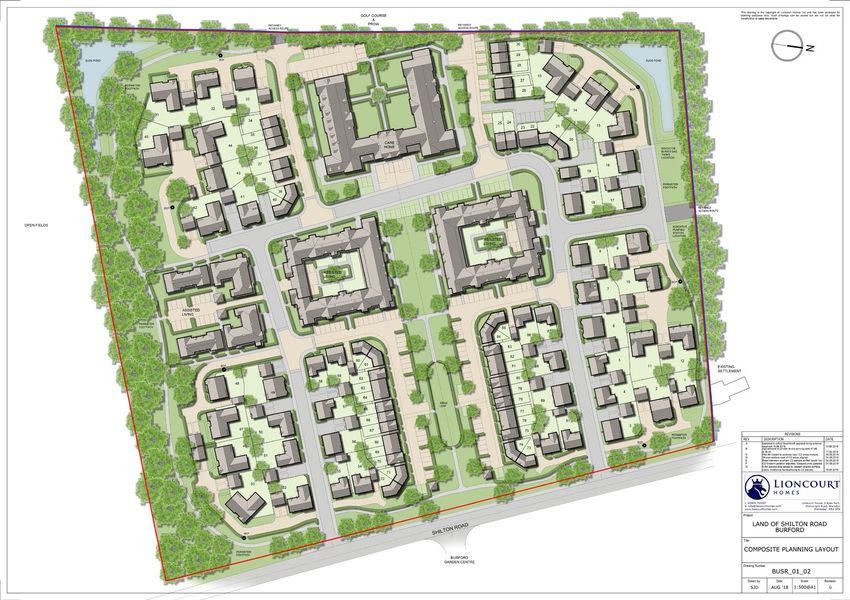
Respect | Integrity | Loyalty | Delivery | Adaptability | Collaboration page 13Land West of
Shilton Road
Burford
Land Promotion Current Site
The medieval settlement of Burford is located about 18
miles west of Oxford in the Cotswolds. In 2014 HLM
secured a Planning Promotion Agreement in relation to
17 acres south west of Shilton Road, and commenced
it’s planning promotion with a public exhibition.
As a result of the exhibition; landowner requests; and
discussions with the planning authority, rather than
pursue a pure residential scheme for circa 150
dwellings, we pursued an outline application for:
91 residential plots
64-bed Retirement Complex
90-bed Care Home.
Planning was granted on appeal in 2017 and HLM
subsequently sold the residential element of the site
to Lioncourt Homes, and have contracted to sell the
Retirement complex to another party later this year.
Interim Results Presentation
August 2019
Respect | Integrity | Loyalty | Delivery | Adaptability | Collaboration page 14Property
Investment &
Development
Investment property portfolio of £79m following transfer
of £44m to assets held for sale expected to be disposed
of in H2, mainly retail and mixed use.
Target hurdle rate of 12%–15%. Lower returns when
pre-let and pre-funded, higher value where we take
more risk.
GDV of schemes in progress over £850m, over 90%
pre-let, pre-sold and pre-funded. £483m delivered
since 2017. Circa £1.6bn of opportunities progressing.
Increased levels of due diligence slowing commercial
property development commencement. Possibly due
to EU negotiations as people wait to see the result.
Stonebridge Homes achieved 68 unit sales (2018: 53)
targeting 1,000 p.a. over a ten year period.
Interim Results Presentation
August 2019
Respect | Integrity | Loyalty | Delivery | Adaptability | Collaboration page 15Project
5 Years
2017 2018 2019 2020 2021
Delivery
Aberdeen £334m £2m
Aberdeen £60m
Aberdeen, Bridge of Don £25m
Bath £5m
Contracted Delivery Birmingham, Cornwall House £25m
of Projects Bournemouth £15m
Between 2017–2021 Bristol £10m
Chesterfield £3m
Mixed use Chippenham £8m
Epsom £32m £5m
Leisure
Leicester, Melton Road £11m
Retail Leicester, Belgrave Road £10m
Luton £27m
Industrial & Offices
Manchester, Invicta £6m
Residential Manchester, St Ann's Square £11m
Markham Vale £50m £22m
Monmouth £2m
Delivered
Nottingham, Thane Road £20m
To deliver
Skipton £16m
Southend on Sea £10m £30m
Sunderland £8m £36m
Thorne £5m
Walsall £19m
York £28m £15m
Total delivered/to deliver £483m £367m
Interim Results Presentation
August 2019
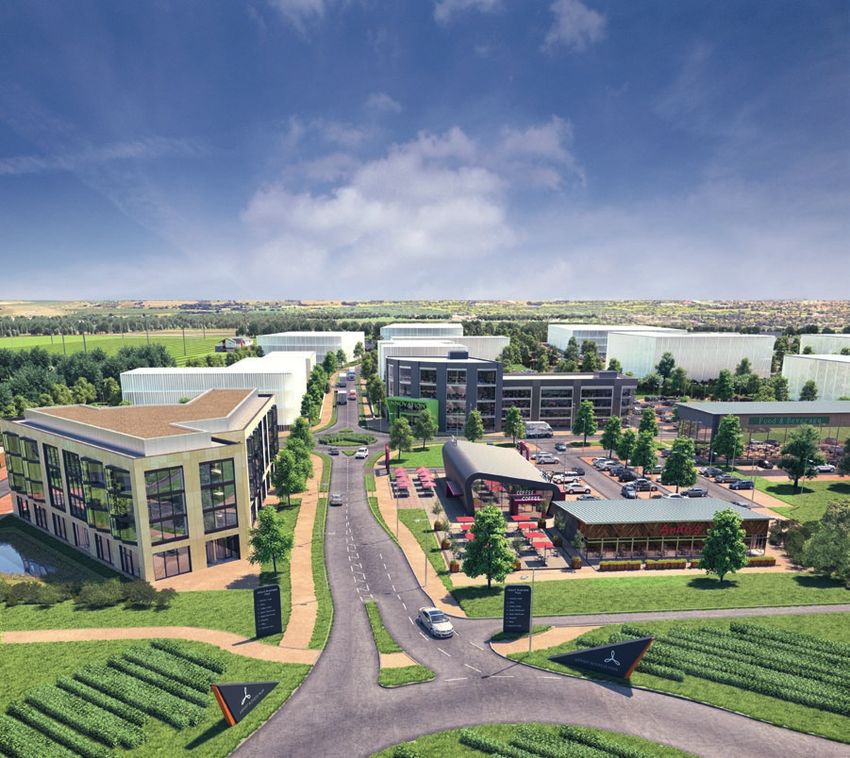
Respect | Integrity | Loyalty | Delivery | Adaptability | Collaboration page 16Airport
Business
Park
Southend
Property Investment
& Development
Joint venture with Southend-on-Sea Borough
Council, Airport Business Park extends to some
50 acres and will deliver over 1 million sq ft of
commercial business space. We were selected
as joint venture partner by Southend Borough
Council following a competitive OJEU process.
Planning consent for the scheme has been
obtained, and the first phase of infrastructure
together with the relocation of the rugby club
will be completed by the end of 2019.
We have secured Ipeco as the first occupier
for the site. Ipeco are a world leader in the
manufacture of crew seats for the aviation
industry who are investing in a new 125,000
sq ft headquarters facility on the scheme, with
construction expected to commence in early
summer 2019.
Interim Results Presentation
August 2019
Respect | Integrity | Loyalty | Delivery | Adaptability | Collaboration page 17Construction
Division consists of Construction,
Plant Hire and Road Link (A69).
11
External turnover up 11% at £54.1m.
%
Trading profit ahead at £5.2m. Workloads
good but taking longer to get on site,
due to sorting out planning conditions.
Road Link margin down due to
design works for two roundabouts
on a management fee margin for
External Turnover
Highways England. 7 years remain
on concession. Very solid underpin
of segment returns.
95% of 2019 construction activity
secured. 71% secured for 2020.
Now actively tendering larger
contract sums £10m–£15m+.
Plant market toughened in 2019,
7% return on sales (2018: 9%)
3% 7% 42%
Supported by profits on disposal.
Majority stake acquired in Starfish
Commercial, giving us access to Construction Plant Road Link
social and affordable housing market.
Cost negligible requires working capital. Return on Sales in H1 2019
Interim Results Presentation
August 2019
Respect | Integrity | Loyalty | Delivery | Adaptability | Collaboration page 18The Beacon
University of Hull
Construction Completed
The new £8m sports arena, The Beacon, is part of
the University of Hull’s £16m scheme to create a
world-class sports centre.
The Beacon is an innovatively designed 12-court
international standard sports hall that makes full use
of natural lighting, with seating for 700 spectators.
The project also includes remodelling the existing
Grade II listed sports centre into a state-of-the-art
fitness gym with studios, together creating a world
class hub to benefit students and the community.
Interim Results Presentation
August 2019
Respect | Integrity | Loyalty | Delivery | Adaptability | Collaboration page 19Investing
for the Future
Strategic Land Property Construction
New site Board approvals Stonebridge Homes HY 2019 workload tendered
residential land portfolio
£129m
Commercial/Retail
HY 2019 6,490 plots HY 2019 939 plots 84%
2018 13,268 plots 2018 868 plots
2017 10,791 plots 2017 880 plots
2016 6,603 plots 2016 679 plots
Appraised returns of approvals Recent HBD Board approvals
working towards planning £154m tendered
HY 2019 £84m 300 unit PRS scheme in Manchester
2018 £144m 90,000 sq ft Industrial/Employment
scheme in Bournemouth
2017 £107m £2m
235,000 sq ft Industrial/Employment Housing
1%
2016 £83m scheme in Cirencester
114,000 sq ft Office Scheme, £6m £8m
Contracts exchanged for Island site, Manchester Custodial £4m Industrial
5%
4% Education
2020–2023 completion 53,000 sq ft Residential scheme, 3%
Cornwall House, Birmingham £4m
Cash £47m, gross profit £26m Health
3%
Interim Presentation
August 2019
Respect | Integrity | Loyalty | Delivery | Adaptability | Collaboration page 20Outlook
Summary
Continued higher capital allocation to land and
property development.
Strategic land performing well with outline permission
on over 50 sites working towards disposal.
Housebuilding market continues to be buoyant
– good for land trading and Stonebridge Homes.
Strong development pipeline, especially industrials
and distribution, to be delivered over the next 5
years and beyond.
Strong construction order book with consistent
returns expectation.
Group currently trading well, but mindful of
continued global political and economic uncertainty.
No change to expectations for 2019, however as ever we
remain reliant upon a number of deals getting across the line.
Interim Presentation
August 2019
Respect | Integrity | Loyalty | Delivery | Adaptability | Collaboration page 21Appendices
Group Structure – Segment Composition
Group Structure – Board of Directors
Group Structure – Senior Management
Corporate Social Responsibility
Shareholding as at 29th July 2019
Five-year Track Record of Strong Growth
Henry Boot PLC Share Price vs Benchmark Indices
The Henry Boot Way
Interim Presentation
August 2019
Respect | Integrity | Loyalty | Delivery | Adaptability | Collaboration page 22Group
Structure
Henry Boot PLC, established over 130 years ago, is one of the
UK’s leading and long-standing property investment and development,
land promotion and construction companies. Based in Sheffield,
with regional offices throughout the UK, the Group is comprised
of three segments.
Land Promotion
Hallam Land Management Limited is the strategic land and planning
promotion arm of the Henry Boot Group. The company has been
acquiring, promoting, developing and trading in land since 1990.
Property Investment & Development
Henry Boot Developments Limited is a major established leading force
in the UK with its considerable experience and reputation in all sectors
of property development. Stonebridge Homes is a jointly owned company
engaged in residential development and serviced office space.
Construction
Henry Boot Construction Limited specialises in servicing both public and private
clients in all construction and civil engineering sectors with strong partnering
relationships in education, healthcare and custodial services, delivering new build
and refurbishment works. Banner Plant Limited offers a wide range of construction
equipment and services for sale and hire. Road Link (A69) Limited, a 30-year
contract with Highways England to operate and maintain the A69 trunk road
between Carlisle and Newcastle upon Tyne, with seven years remaining.
Interim Presentation
August 2019
Respect | Integrity | Loyalty | Delivery | Adaptability | Collaboration page 23Group
Structure (from left to right)
Peter Mawson Jamie Boot Tim Roberts to take up role of CEO
Senior Independent Non-executive Director Chairman from 1st January 2020.
and Chairman of the Nomination Committee John Sutcliffe John Sutcliffe to retire from Board
Darren Littlewood Chief Executive Officer on 21st May 2020.
Group Finance Director James Sykes
Joanne Lake Non-executive Director
Non-executive Director, Deputy Chairman Amy Oakley
and Chairman of the Audit & Risk Committee Company Secretary
Gerald Jennings
Board of Directors Non-executive Director and Chairman of the
Remuneration Committee
Interim Presentation
August 2019
Respect | Integrity | Loyalty | Delivery | Adaptability | Collaboration page 24Group
Structure
Senior Management
Land Property Construction
Promotion Investment &
Development
Nick Duckworth Edward Hutchinson Darren Stubbs Simon Carr Giles Boot Trevor Walker
Hallam Land Henry Boot Stonebridge Henry Boot Banner Road Link (A69)
Management Limited Developments Limited Homes Limited Construction Limited Plant Limited Limited
Interim Presentation
August 2019
Respect | Integrity | Loyalty | Delivery | Adaptability | Collaboration page 25Corporate
Social Responsibility
People Community Health & Safety Environment
Our people are vital to We continue to contribute Henry Boot PLC continues to We recognise that we have a
the delivery of our strategic to the social and economic focus on health and safety as responsibility and an obligation
priorities. impacts to the communities our primary business priority. to reduce the direct impact of
in which we operate. all our business operations on
Engagement with our We remain committed to the natural environment, both
employees and employee We offer support to a wide providing a safe and healthy now and in the future.
satisfaction are crucial to range of charities and working environment for our
continued improvement organisations of all sizes, employees, stakeholders Reducing our emissions is
and success across all by working to provide them and contractors. one way in which we hope
our businesses. with donations that are of to achieve this.
most benefit to them. We operate all our business
We have established policies activities on the principle that Our aim is to create more
for recruitment, learning and We support an annual Charity good management of health sustainable ways of undertaking
the development of our of the Year which is elected by and safety is fundamental in our business operations to
employees. our employees. In 2018 our creating a safe and healthy conserve energy, save money
Charity of the Year was working environment and and deliver efficiency.
As our businesses continue Dementia UK and a total contributes to improving our
to develop and grow, we of over £30,000 was donated. business performance.
understand that by retaining
and inspiring effective and Our Accident Frequency Rate
committed employees, we performance remains strong
can continue to deliver with an overall score (including
excellence to all. subcontractors) of 0.05 per
100,000 hours.
Interim Presentation
August 2019
Respect | Integrity | Loyalty | Delivery | Adaptability | Collaboration page 26Shareholders
37.1m, 28%
Main Institutional Shareholders
9.4m
Canaccord Genuity Group Inc.
5.5m
Fidelity Management & Research
4.2m
Polar Capital Holdings
3.4m
Standard Life Aberdeen
63.8m, 48% 133m shares in issue 3.2m
Henry Boot Founding Family BlackRock Inc.
(across 91 holdings)
2.8m
Schroders
2.5m
Dimensional Fund Advisors
2.2m
Hargreaves Lansdown PLC
2.1m
Miton Group PLC
2.1m
Legal & General Group
29.8m, 22% 1.8m, 2%
Other Shareholdings Employees/Directors
Interim Presentation
August 2019
Respect | Integrity | Loyalty | Delivery | Adaptability | Collaboration page 27Strong
Growth
Five-year Dividends Per Net Asset Value
Ordinary Share Net Assets per Share ROCE Profit Before Tax Net Debt Turnover
Track Record
2014–2018 2014 5.6p 2014 £200.5m 2014 152p 2014 11.4% 2014 £28.3m 2014 £36.4m 2014 £147.2m
2015 6.1p 2015 £221.5m 2015 168p 2015 12.2% 2015 £32.4m 2015 £38.9m 2015 £176.2m
2016 7.0p 2016 £233.6m 2016 177p 2016 14.4% 2016 £39.5m 2016 £32.9m 2016 £306.8m
2017 8.0p 2017 £270.0m 2017 203p 2017 18.6% 2017 £55.4m 2017 £29.0m 2017 £408.5m
2018 9.0p 2018 £302.3m 2018 227p 2018 14.9% 2018 £48.6m 2018 £18.4m 2018 £397.1m
Interim Presentation
August 2019
Respect | Integrity | Loyalty | Delivery | Adaptability | Collaboration page 28Share 320
Price
300
Henry Boot PLC Share Price
vs Benchmark Indices
280
260
240
Henry Boot PLC 220
FTSE 250
FTSE 100 200
FTSE All Shares
FTSE All Share/Construction & Materials – SEC
180
Aug Aug Sep Sep Oct Oct Nov Nov Dec Dec Jan Jan Jan Feb Feb Mar Mar Apr Apr May May Jun Jun Jul Jul Jul Aug
2018 2019
Interim Presentation
August 2019
Respect | Integrity | Loyalty | Delivery | Adaptability | Collaboration page 29The Our Values
Henry Boot Way Respect Integrity
Purpose, Vision and Values n We treat everyone in n We operate with the
the way they wish to utmost professionalism.
Henry Boot PLC, has been in business for over 130 years and our financial results be treated.
and performance have always been, and will continue to be, dependent on our people. n We champion ethical
We often use the phrase, ‘The Henry Boot Way’, to explain how we work and to n We strive to always working.
describe what’s expected of us and others. meet our commitments
and obligations.
Our Purpose Our Vision
To empower and develop our people to Our people, partners and communities
create long-term value and sustainable continue to trust our reputation, respect
growth for our stakeholders.* our expertise and value us for our Loyalty Delivery
forward-thinking approach.
n We are committed to n We are relentless in
giving back to our delivering for our
communities. customer.
n We value the longevity of n We deliver our best
our relationships with our quality work for every-
people and our partners. one, no matter what.
Adaptability Collaboration
n We are open to n We set clear mutual
opportunities to do expectations and strive
things differently. to achieve them.
n We are resilient, n We work in partnership
have staying power. to make things happen.
*Our stakeholders are our shareholders, employees, pensioners, customers and suppliers.
More broadly, we recognise our duties to the environment and the communities in which we operate.
Interim Presentation
August 2019
Respect | Integrity | Loyalty | Delivery | Adaptability | Collaboration page 30This presentation contains forward-looking statements.
Although the Group believes that the estimates and assumptions
on which such statements are based are reasonable, they are
inherently uncertain and involve a number of risks and uncertainties
that are beyond the Group’s control. The Group does not make
any representation or warranty that the results anticipated by such
forward-looking statements will be achieved, and this presentation
should not be relied upon as a guide to future performance.
Henry Boot PLC, Company No:160996. Registered in England and Wales.
Registered Office – Banner Cross Hall, Ecclesall Road South, Sheffield S11 9PD
Henry Boot PLC
Interim Presentation
August 2019You can also read