At home in Tewkesbury Borough A housing strategy for our borough 2017-2021 Appendix 1a: Our Local Evidence - Increasing Housing Supply
←
→
Page content transcription
If your browser does not render page correctly, please read the page content below
At home in Tewkesbury Borough
A housing strategy for our borough 2017-2021

Appendix 1a: Our Local Evidence – Increasing
Housing Supply

                                               1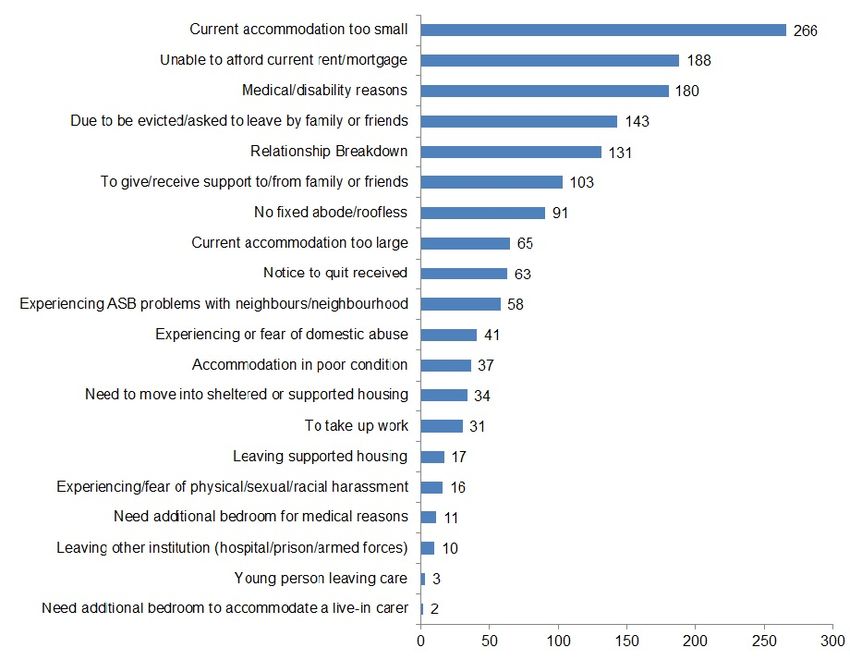
This page is intentionally left blank

                                                       2
Housing Strategy 2017-2021 Appendix 1a
Contents
List of charts and tables Page 4
1 Introduction Page 5
2 Population and households Page 6
3 Planning for Development Page 10
3.1 Affordable Housing Objectively Assessed Need Page 10
3.2 Planning Policy Page 10
3.3 Delivery against Local Plan Policy Page 11
3.4 Construction Page 11
3.4.1 Self-Build and Custom-Build Page 11
3.4.2 Flood resilience Page 12
3.4.3 Alternative construction methods Page 13
4 Incomes, house prices and home ownership Page 14
4.1 Ability to purchase a home in Tewkesbury Borough Page 15
4.2 Accessing the housing market Page 15
4.3 Starter Homes Page 16
4.4 Planning obligations: changes to government policy Page 16
5 Right to Buy Page 17
5.1 Voluntary Right to Buy Page 17
6 Housing Register (choice based lettings scheme) Page 18
7 Profile of new accommodation Page 22
3
Housing Strategy 2017-2021 Appendix 1aList of Charts and Tables
Chart 1: Tewkesbury Borough age profile: how the age profile has changed and Page 6
may change 1991 - 2010 - 2033
Chart 2: How the mix of households has changed and is projected to change Page 9
Chart 3: Households by housing tenure and house size, 2011 Page 7
Chart 4: Main reason for applying to Homeseeker Page 18
Chart 5: Main reason for applying, top issues, by age group Page 19
Chart 6: Number of households registered by bedroom need and banding Page 20
Chart 7: Lets in Tewkesbury, by band, October 2009 to August 2016 Page 21
Chart 8: Profile of new accommodation required in Tewkesbury (lower scenario) Page 22
Table 1: Mix of household sizes required to 2033 Page 8
Table 2: July 2016 housing register data as percentage of need Page 8
Table 3: Number of completions and number of households registered for social Page 9
housing
Table 4: Size of additional units required to meet housing need (general needs) in Page 9
Tewkesbury Borough-excluding households suitable for shared housing
Table 5: Median income and house prices 2005 and 2015, along with the ratios Page 14
for 2015
Table 6: Home ownership sales under the help to buy agent, by Parish, Page 16
Tewkesbury Borough April 2012-March 2016
Table 7: Sales of Severn Vale Housing Society residential dwellings under Right to Page 17
Buy from 1998/99 to July 2016
Table 8: Households registered by bedroom need and banding as a percentage of Page 20
all applicants
Table 9: Bedroom need and current house type Page 21
4
Housing Strategy 2017-2021 Appendix 1a1 Introduction
This document outlines the evidence gathered by Tewkesbury Borough Council showing the
housing and homelessness context in which the council is working.
We have used this evidence to identify 4 priorities for housing and homelessness along with key
objectives for the next 5 years.
The strategy will link with the priorities outlined in the Council Plan 2016-2020, set out the
council’s priorities and objectives for housing, and appropriate activities that will help us to meet
our statutory housing duty under the Housing Act 1996.
Housing is a priority in the Tewkesbury Borough Council Corporate Plan because:
“We recognise how important it is for residents to be able to access good quality housing and
housing related services that make a real difference to their lives.
“Not only is housing important for the health and well-being of residents it is also an important part
of building and maintaining strong communities and supporting the economic prosperity of the
borough.”
Tewkesbury Borough Council recognises that access to quality affordable housing underpins the
success of our area and all of the overarching council priorities.
5
Housing Strategy 2017-2021 Appendix 1a2 Population and households
Information from “What Homes Where 2013”, a toolkit1 to help local authorities assess their
housing needs shows us some of the key population issues. Our borough population is roughly
85,800; assuming current population trends continue, the ONS projections2 for the next 25 years
suggest that the population in Tewkesbury Borough will reach 93,400 by 2025 and 100,400 by
2037. The district’s growth rates are higher than those predicted for Gloucestershire and
England in the short, medium and long term.
Chart 1: Tewkesbury Borough age profile: how the age profile has changed and may change
1991 - 2010 - 2033
2033
10,351
2010
80+ 4,673
2,593 1991
23,750
60-79 17,598
13,021
22,837
40-59 23,429
18,836
18,416
20-39 17,404
18,842
18,866
0-19 17,752
17,429
0 5000 10000 15000 20000 25000 30000
Source: What Homes Where 2013
As shown above the dominating feature of the projected trend is a sharp increase in the number
of older people aged 60 and over, particularly those aged 80+. Projections for children and
young people indicate slower growth, while the working-age population is expected to show little
change in the long term.
Population changes will present an increasing challenge for the borough in relation to additional
pressure on health and social care and the need for more specialist accommodation. There is
also evidence that a number of homes in both the social/affordable rented sector and market
sector are currently under-occupied, particularly in rural areas.
There continues to be an increase in one person households with this household type projected
to overtake all others by 2033. Couples on their own and small families increases at a relatively
1 What Homes Where, 2013 http://www.howmanyhomes.org/
2 2012-Based Sub-national Population Projections, Office for National Statistics
6
Housing Strategy 2017-2021 Appendix 1asteady rate but larger family growth remains small. Other households include couples with adult
children living at home, friends living in a property and so on, are predicted to decline:
Chart 2: How the mix of households has changed and is projected to change
2560
Other
3358 2033
households
4985
2006
Larger 6123
1991
families with 6108
child/children 5646
Small
3853
families
3004
with one
2301
child
Couples 14680
on their 11219
own 8809
One 16706
person 10374
household 6715
0 2000 4000 6000 8000 10000 12000 14000 16000 18000
Source: What Homes Where 2013
The Census 2011 shows 35,126 households in Tewkesbury Borough. It informs us of the tenure
that households state they are living in along with number of bedrooms, see Chart 3 below.
Chart 3: Households by housing tenure and house size, 2011
Source: ONS, Census 2011
7
Housing Strategy 2017-2021 Appendix 1aBased on population and household changes, the What Homes Where toolkit also advises on
suitable house sizes. For Tewkesbury Borough the main need is for smaller family housing:
Table 1: Mix of household sizes required to 2033
House size 1 bed 2 bed 2/3 bed 3 bed 3/4 bed 4/5+ bed
As % of all homes 3.12% 14.14% 27.59% 23.31% 17.64% 14.19%
Source: What Homes Where 2013
The extent of housing growth across Tewkesbury Borough has been beneficial for our
households in need and the affordable housing dwelling stock in Tewkesbury Borough has been
gradually increasing; however as an overall percentage of total dwelling stock there are just
11.8% of social housing stock homes. This number has increased by only 0.1% since 20103.
The majority of the borough’s housing stock (88.2%) therefore is privately owned (outright,
mortgaged and private rented) and is generally in good condition. However homes in our
borough are larger, more expensive properties. Affordable housing needs registers,
Homeseeker Plus and Help to Buy South, as at July 2016 inform us of the needs of households
currently seeking to rent or buy an affordable home in Tewkesbury Borough, see Table 2. The
actual need/demand is for smaller properties:
Table 2: July 2016 housing register data as percentage of need
House type 1 bed 2 bed 3 bed 4 bed 5+ bed
As % of all Homeseeker Plus Tewkesbury
52.45% 32.88% 10.25% 3.90% 0.52%
Borough need
As % of all Help to Buy South Tewkesbury
12.20% 53.90% 32.20% 1.69% 0.00%
Borough need
Total 64.65% 86.78% 42.45% 5.60% 0.52%
Source: Tewkesbury Borough Council datasets
The Homeseeker Plus rented housing register has seen no turn around in need/demand for
social rented housing. Since the commencement of choice based lettings in October 2009 and
despite new build affordable rented homes (as shown in Table 3 overleaf), housing need in
Tewkesbury Borough sees little shrinkage.
3ONS Dataset: Housing summary measures: summary measures data, Table 14, October 2016
http://www.ons.gov.uk/peoplepopulationandcommunity/housing/datasets/housingsummarymeasuressummarymeasures
data
8
Housing Strategy 2017-2021 Appendix 1aTable 3: Number of completions and number of households registered for social housing
Year End 2010 2011 2012 2013 2014 2015 2016 Total
Homeseeker snapshot
1498 1702 1877 2405 2010 1662 1928
as at 1st April*
Open Market 261 271 277 322 360 428 390 2309
Affordable Housing
34 48 33 93 86 122 159 575
rented
Affordable Housing home
3 12 8 46 70 23 70 232
ownership
Total of all new build** 298 331 318 461 516 573 619 3116
Percentage of which is
12% 18% 13% 30% 30% 25% 37% 26%
Affordable Housing
*Source: DCLG Local Authority Housing Statistics
**Source: Tewkesbury Borough Council Annual Monitoring Reports
The total number of Homeseeker Plus applicants fluctuates all year round but the snapshot in the
table depicts an accurate picture of the number of households in need based on issues occurring,
such as the commencement of initiatives of the Localism Act 2011 and Welfare Reform Act 2012.
The need for smaller homes is further demonstrated by the Strategic Housing Market Assessment
Final 20144 (SHMA) as below:
Table 4: Size of additional units required to meet housing need (general needs) in Tewkesbury
Borough-excluding households suitable for shared housing
4Strategic Housing Market Assessment Final 2014
https://drive.google.com/file/d/0B4KyFQA43JaOZTR5S2RGR21sUDA/view
9
Housing Strategy 2017-2021 Appendix 1a3 Planning for Development
3.1 Affordable Housing Objectively Assessed Need
The Objectively Assessed Housing Need (OAN) for Tewkesbury Borough 2011-2031 is 9,983
dwellings. Of this, 5,514 is already delivered or committed in this period. There is therefore
4,469 housing left to deliver in the period 2016-2031.
The OAN determines an annual requirement of 495 homes per year with 2,475 homes over first 5
year period (starting 2016/17). Tewkesbury Borough saw 2,469 delivered over the previous 5
year period (2011-2016).
Our net affordable housing need based on the Strategic Housing Market Assessment (SHMA) is
126 affordable homes per year (from 2015 SHMA base date). This means that over the next 5
year period from 2016/17, delivery must be 630 affordable homes. 25% of total housing need of
5 year period is for affordable housing.
From Table 3 on the previous page we can see that from 2010 to 2015, gross delivery of new
affordable homes was 578 dwellings; net delivery in that period being 404 dwellings. This
equates to 67 new affordable homes per year in that period; significantly below the requirement of
126. Therefore the Tewkesbury Borough Council Plan 2016-2020 target is 150 affordable homes
per year so that we can ensure that we meet the net requirement. Reasons to build above the
net requirement include:
Where developments are not policy compliant due to viability and therefore a lesser
number of homes are built.
Tewkesbury Borough Council housing services team must consider the introduction of
new government initiatives and policies such as removing planning obligations for small
sites (10 dwellings or less), Starter Homes and so on.
The losses of rented homes through the Right to Buy5
The losses of shared ownership dwellings through household’s staircasing to 100%
ownership.
We are seeking to be as ambitious as possible as a Local Planning Authority and Local Housing
Authority to meet the needs of our community now and in the future.
3.2 Planning Policy
Tewkesbury Borough Council Saved Local Plan 2006-2011 requirement for Affordable Housing
through planning obligations stated 30%, of which rented 68% and shared ownership 32%.
The emerging Gloucester, Cheltenham & Tewkesbury Joint Core Strategy (JCS) requirement is
40%; there is no tenure split suggested at this level as it will be detailed in the new Tewkesbury
Borough Plan.
5 Right to Buy https://righttobuy.gov.uk/. Also see Section 5 of this document.
10
Housing Strategy 2017-2021 Appendix 1a3.3 Delivery against Local Plan Policy
Five yearly analyses of the Council’s new-build affordable housing completions shows that:
In the period 2001-2006 (5 years prior to the Local Plan 2006-11), affordable housing
delivery was 23% of all new build housing in the borough.
In the Local Plan 2006-2011 period, delivery was 25% of all new build housing in the
borough.
From 2011-2016 where we have has saved affordable housing policies and the JCS
emerging policy, delivery was 29% of all new build housing in the borough.
3.4 Construction
3.4.1 Self-Build and Custom-Build
Paragraphs 50 and 159 of the National Planning Policy Framework, 20126 and related planning
practice guidance make it clear that local planning authorities need to identify local demand for
people who want to build their own homes and make provision for it in their local plans. Failure to
do this may lead to plans being found unsound, as highlighted in the letter from the Minister for
Housing and Planning to all English Local Authorities on 5 March 2015.
Self-build is where the individual partly or wholly controls the design, funding, planning and
building of a home. This can involve building part or all of a home oneself or alternatively hiring a
contractor to do the same. Self-builders can work as individuals or as a group. Self-build can offer
an alternative to traditional home ownership and an opportunity to own a sustainable and high
quality designed home.
Custom Build Homes describe that custom-build it can be “purchasing a fully serviced plot from a
custom build developer and working with either the site architect, or your own, to design a home
that’s truly yours. It’s all about choice, flexibility and putting you in control.”7
The Self Build and Custom Housebuilding Act 20158 places a duty on local authorities to maintain
a register of people who have expressed an interest in self-build and custom build projects and to
have regard to the demand on their local Register when exercising their planning and other
relevant functions.
Tewkesbury Borough Council’s register9 as at November 2016 had 21 entries for self-build or
custom-build housing within the borough:
7 of the 21 entries are interested in considering potential ‘collective’ or ‘serviced plots on a
larger development’ as an option.
17 of the 21 entries are interested in building detached homes, with 2 of these specifically
planning to build bungalows.
6 National Planning Policy Framework, march 2012
https://www.gov.uk/government/uploads/system/uploads/attachment_data/file/6077/2116950.pdf
7 Custom Build Homes http://custombuildhomes.co.uk/what-is-custom-build/
8 The Self Build and Custom Housebuilding Act 2015
http://www.legislation.gov.uk/ukpga/2015/17/contents/enacted/data.htm
9 Self-Build Register: Tewkesbury Borough Council http://www.tewkesbury.gov.uk/index.aspx?articleid=3051
11
Housing Strategy 2017-2021 Appendix 1a 10 of the 21 entries are interested in building 4 or 5 bedroomed homes, 6 interested in 3
or 4 bedroomed and only 3 interested in 2 bedrooms, 1 in 2 or 3 and 1 in a home of any
size.
16 of the 21 entries are interested in building a home with a Garage and Garden.
3 of the 21 entries are not looking for a plot; 2 owning their own land and 1 has an option
on land.
There are several approaches the council could consider in meeting this need for example,
including but not exclusively:
Allocating suitable housing sites in the Tewkesbury Borough Plan where private
homebuilding is encouraged or preferred;
Selling either our own or encouraging the County Council to sell land.
Buying land ourselves for this purpose, working through the proposed Borough Council
development company to provide serviced plots
Adopting policies in the Tewkesbury Borough Plan that ask for a mix of different types of
housing on larger sites, with self-build and custom house building listed as suitable
development Councils want to see coming forward;
Adopting policies which ask for a percentage of self-build and custom housebuilding plots
to be provided when larger housing projects come forward.
Prepare and adopt Supplementary Planning Guidance/Documents on self-build as the
Tewkesbury Borough Plan may take a long time to go through all of its processes.
To continue to understand the need/demand and affordability of Self-Build and Custom-Build
housing, the council will include this as part of a newly commissioned Strategic Housing Market
Assessment.
3.4.2 Flood resilience
During our consultation period it was brought to our attention that the borough needs to have an
awareness of the potential improvements to new housing developments in terms of flood
resilience. Flood resilience measures can be incorporated in construction where appropriate, for
example reflecting Environment Agency flood zones.
Whilst planning permission requires zero effect in terms of flooding, the cost, both emotional and
financial, of being flooded would be far less if measures are taken at the start of the development
process. There are a variety of possible measures that can be taken at the construction stage
and also post-flooding ‘resilient repair’. For example, Two Castles Housing Association in Carlisle
have constructed homes that have built in flood defence measures; the details can be found here
http://www.ukfloodbarriers.co.uk/2016-the-changing-face-of-uk-flood-defence
The Tewkesbury Property Support Network10 is a project set up to provide support, solutions and
low-cost measures for communities at risk of flooding. “The project’s aim supports the long-term
goal of enabling individuals and communities to take more ownership for the management of their
flood risk and to recover more quickly as a result.” The project’s flood repairable project leaflet
provides information about resilient repair11.
10Tewkesbury Property Support Network website https://floodrepairable.wordpress.com/
11Tewkesbury Property Support Network, flood repairable project leaflet
https://floodrepairable.files.wordpress.com/2016/01/flood-repairable-project-leaflet.pdf
12
Housing Strategy 2017-2021 Appendix 1aTewkesbury Borough Council continues to support communities through the employment of a
Tewkesbury Borough Flood Project Support Officer that reports regularly to the Flood Risk
Management Group.
3.4.3 Alternative construction methods
The need to increase the supply of new homes and the high demand has meant that house
builders have not been able to keep up; with manufactures unable to supply to sheer amount of
bricks for example pushes such prices too high. This, along with labourer wages, that according
to the EAC12 rose in London to £240 per day in 2013 means that traditional construction methods
are dwindling and alternatives are reaching new heights.
Alternative construction methods are not new, yet the mass-builders have largely retained
traditional methods. Tewkesbury Borough Council is currently working with Severn Vale Housing
Society, as our stock transfer housing association provider, to seek alternative, modular and off-
site construction of new homes on council-owned land. The aim is to speed up the delivery of
homes in a much more sustainable, productive, efficient, and environmentally-friendly manner for
our communities. .
12 EAC website http://www.building.co.uk/
13
Housing Strategy 2017-2021 Appendix 1a4 Incomes, house prices and home ownership
The growth in income levels has not kept pace with the increases in property values meaning that
many people are priced out of owner occupation the borough.
Table 5 shows the disparity between incomes and house prices. Median house prices and
median incomes are shown from the year 2005 to show the change from pre-economic downturn.
Table 5: Median income and house prices 2005 and 2015, along with the ratios for 201513
2005 2015 2005 Median 2015 Median 2015
Median Median House Gross Annual Gross Annual Income:House
District House Price Price Salary Salary Price ratio
Cheltenham £175,000 £225,000 £20,917 £24,051 9.36
Cotswold £242,000 £319,000 £18,560* £19,131** 15.42**
Forest of Dean £160,000 £182,975 £18,920 £20,682 8.85
Gloucester £132,000 £165,000 £17,206 £20,779 7.94
Stroud £180,000 £225,000 £19,378 £23,282 9.66
Tewkesbury £167,500 £225,000 £19,485 £23,524 9.56
Gloucestershire £176,083 £223,663 £15,984 £21,908 10.21
South West> £180,368 £224,181 £12,283 £18,272 12.27
England>> £168,428 £238,406 £17,071 £20,847 11.44
*Cotswold data for 2006 as 2005 not available
**Cotswold data for 2014 as 2015 is not available.
>Several Local Authorities’ data missing
>> Several Local Authorities’ data missing
The ONS state that “Average house price statistics themselves do not give a full picture of the
affordability of privately owned housing, because these figures do not take into account average
earnings which in part dictate how much people can afford to pay to buy their own home. Looking
at the ratio of median house prices to median annual salary sheds light on the relative affordability
of owner occupied housing across the local authorities of England...”
Housing in Tewkesbury borough is relatively expensive as against national and regional averages
with the east of the borough14 having the highest values given its proximity to the AONB.
Isbourne ward has the highest average house price of £490,996 with detached properties fetching
over £600,000. The disparity between incomes and house prices in the Borough continues to
escalate.
In their essay, Unfinished Business: The ownership agenda, thirty years on15, ResPublica state
that more people are private renting their homes than ever before:
“…thirty years ago 61% of the UK’s households owned their own home…The main shift in the
ownership of the UK’s housing stock is around rented accommodation, with the number of
households renting from private landlords doubling in thirty years. In 1985 30% of households
rented from public landlords, and 9% from private landlords. Today the emphasis has changed,
with 22% renting from private landlords and 9% from public.”
13 ONS Dataset: Housing summary measures: summary measures data Release date: 7 October 2016,
http://www.ons.gov.uk/peoplepopulationandcommunity/housing/datasets/housingsummarymeasuressummarymeasures
data
14 Tewkesbury Area Map http://tewkesbury.gov.uk/CHttpHandler.ashx?id=2912&p=0
15 ResPublica Essay published October 2015 http://www.respublica.org.uk/our-work/publications/unfinished-business-
the-ownership-agenda-thirty-years-on/
14
Housing Strategy 2017-2021 Appendix 1a4.1 Ability to purchase a home in Tewkesbury Borough
Mortgage lenders must limit the proportion of mortgages at loan to income multiples of 4.5 and
above to no more than 15% of their new mortgages. Given this restriction on mortgages,
Tewkesbury Borough’s income to house price ratio, may make it difficult for first time buyers to
get on the property market. This may result in the out migration of young people in the lower
income brackets or alternatively encourage people to commute into Tewkesbury Borough for
work, while living in areas where housing is cheaper outside of the borough.
In the June 2014 Financial Stability Report16, the Bank of England announced measures to cut
the risk of a damaging house price bubble emerging by limiting the number of high-risk
mortgages; the proportion of mortgages at loan to income multiples of 4.5x and above to no more
than 15% of their new mortgages.
The impact therefore in Tewkesbury Borough will be continued difficulties for (young) local people
to purchase a home in the areas and the likelihood they’ll be forced to bordering authority areas in
search of more affordable housing to buy, private rented or increased demand on shared
ownership and other intermediate housing products.
4.2 Accessing the housing market
With a small private rental market in Tewkesbury Borough, the demand for home ownership has
been growing since 2012 when Help to Buy South17 became our area’s help to buy agent.
As at April 2012 just 52 households were registered for home ownership schemes; these include
shared ownership and shared ownership resales, rental schemes, and developer schemes (such
as help to buy equity loan). As at November 2016, 359 households are currently registered.
It is to be noted that under the help to buy equity loan scheme and previous mortgage guarantee
scheme, households register at the time of application. Therefore we will never see the true
picture of demand.
In the 4 year period April 2012 to March 2016, there were a total of 23,656 house sales (existing
dwellings and new-build) in Tewkesbury Borough. Of these:
4,139 (17.5%) were new-build housing18.
Just 438 (10.5%) of this new-build development were supported through a
government scheme or as affordable housing, that is help to buy equity loan and
shared ownership.
Less than 1% of all existing dwelling sales19 were shared ownership re-sales.
A total of 451 home ownership sales were logged in this time period under the help to buy agent.
Table 6 overleaf shows the sales by schemes and by Tewkesbury Borough parish.
16 Financial Stability Report, 2014, Bank of England
http://www.bankofengland.co.uk/publications/Pages/fsr/2014/fsr35.aspx
17 Help to Buy South http://www.helptobuysouth.co.uk/
18 ONS: Number of residential property sales for national and subnational geographies (newly built dwellings) – HPSSA
Dataset 7 table 2a https://www.ons.gov.uk/peoplepopulationandcommunity/housing/datasets/numberofresid
entialpropertysalesfornationalandsubnationalgeographiesnewlybuiltdwellingsquarterlyrollingyearhpssadataset07
19 ONS: Number of residential property sales for national and subnational geographies (existing dwellings) – HPSSA
Dataset 8 table 2a
https://www.ons.gov.uk/peoplepopulationandcommunity/housing/datasets/numberofresidentialpropertysalesfornationala
ndsubnationalgeographiesexistingdwellingsquarterlyrollingyearhpssadataset08
15
Housing Strategy 2017-2021 Appendix 1aTable 6: Home ownership sales under the help to buy agent, by Parish, Tewkesbury Borough
April 2012-March 2016
Parish Help to Buy Shared Shared Ownership Total
Equity Loan Ownership Resale
Alderton 0 4 0 4
Badgeworth 0 24 0 24
Bishop's Cleeve 70 79 8 157
Brockworth 68 56 0 124
Longford 68 10 0 78
Norton 0 4 0 4
Stoke Orchard 24 11 5 40
Winchcombe 0 20 0 20
Total 230 208 13 451
It is evident that government supported schemes and affordable housing home ownership are
extremely popular and needed but with these options being less than 12% of all sales in the
borough the opportunities for younger people to get on the housing ladder are limited.
Many young people may not be accessing all the options available to them due to lack of
understanding of the range open to them. Tewkesbury Borough Council believes that it can do
more to encourage local people to register for home ownership schemes.
4.3 Starter Homes
The government manifesto to provide more homes and more homes for sale for young people
has meant their Starter Homes initiative being brought in via the Housing and Planning Act 2016.
A vision of ‘discounting’ new homes by up to 20% has been out for consultation and at the time
writing the sector is waiting for the decision as to how this product will work in reality.
Home ownership is the government’s driver in housing at present believing more homes will be
built, particularly Starter Homes, in the near future. If Starter Homes are to be considered
Affordable Housing in the future, this will affect the council’s current position of what we can
provide on-site on new developments particularly impacting the rented element. The affects will
need to be fully assessed as part of the SHMA alongside other home ownership products.
4.4 Planning obligations: changes to government policy
The government continues to reduce planning obligations on developers to incentivise
development of new homes through a policy of no affordable housing contributions on sites of 10
or less dwellings or less than 1000sqm unless in a designated area (for Tewkesbury Borough this
is AONB only).
For a rural local authority where much development comes through on small sites this will result
in less Affordable Housing for Tewkesbury Borough. Housing services must work with planning
and development management colleagues to ensure that both the JCS and Tewkesbury Borough
Plan policies maximise affordable housing delivery.
The impact can be quite significant as we currently estimate that just under 12% of our Affordable
Housing stock is in our most rural parishes.
16
Housing Strategy 2017-2021 Appendix 1a5 Right to Buy
Although Right to Buy (RTB) applications fluctuate year on year in Tewkesbury Borough Council,
the loss of housing stock puts pressure on our affordable housing supply no matter how many are
bought. The removal of a rented home in Tewkesbury Borough impacts greatly on our ability to
house those in housing need.
Since the transfer of the council housing stock to Severn Vale Housing Society in 1998, there
have been 300 RTB sales (see Table 7).
Table 7: Sales of Severn Vale Housing Society residential dwellings under Right to Buy from
1998/99 to July 2016
Year End N.o. properties sold Year End N.o. properties sold
2017 (to July 2016) 6 2007 3
2016 2 2006 7
2015 5 2005 11
2014 9 2004 23
2013 1 2003 32
2012 4 2002 32
2011 1 2001 32
2010 1 2000 67
2009 0 1999 68
2008 2
Source: Severn Vale Housing Society dataset
According to ResPublica, the Right to Buy has increased the number of private landlords: “The
Right to Buy programme will undoubtedly have increased home ownership in the short term, but
the long term housing landscape is more a story of replacing public landlords with private
landlords, rather than with home owners.” A ResPublica Essay, Unfinished Business: The
ownership agenda, thirty years on, 201520
5.1 Voluntary Right to Buy
In 2015, the government announced the extension of the Right to Buy to housing association
tenants. The Voluntary Right to Buy (VRTB) is still being planned out along with housing
associations and the National Housing Federation to ensure it scheme works effectively for
housing associations and their tenants. In additional, the Autumn Statement 201621 stated that
the pilot scheme will be extended:
“The government will fund a large-scale regional pilot of the Right to Buy for housing association
tenants. Over 3,000 tenants will be able to buy their own home with Right to Buy discounts under
the pilot.”
Housing associations are currently producing their sales policies in which they will details the
principles for selling a rented home to an eligible tenant. Eligibility is yet to be determined by
government. Tewkesbury Borough will need to be up to speed eligibility and understand each the
sales policies that each housing association with stock in the borough are operating.
20 ResPublica Essay, Unfinished Business: The ownership agenda, thirty years on, 2015
http://www.respublica.org.uk/wp-content/uploads/2015/10/Unfinished-Business-1.pdf
21 Autumn Statement 2016 https://www.gov.uk/government/publications/autumn-statement-2016-documents/autumn-
statement-2016
17
Housing Strategy 2017-2021 Appendix 1a6 Housing Register (choice based lettings)
As at July 2016 there were 1,925 households registered for housing in Tewkesbury Borough on
the Council’s choice based lettings system, which is now known as Homeseeker Plus.
Households are able to tick a box or state the reason why they have applied to Tewkesbury
Borough Council for housing. The majority of applicants stated their accommodation is too small.
‘Other’ (438) allows applicants to write in their circumstances but this is difficult to analyse. The
reason typically fits into one of the tick box categories:
Chart 4: Main reason for applying to Homeseeker
Source: Gloucestershire Homeseeker dataset July 2016
Chart 5 overleaf details the main reasons by age group. In summary:
66% of applicants are aged 25 to 59 living in accommodation that is too small for their needs
or unable to afford their current property as the 2 most significant issues.
For young people aged under 25 the majority have been asked to leave their
accommodation.
For older people aged 60+ the main reason is medical or disability reasons require them to
move.
18
Housing Strategy 2017-2021 Appendix 1aChart 5: Main reason for applying, top issues, by age group
250
214
200
146
150
113
101
91
100 78
72
63 63
48
50 40 38
27 27 21 26
20 16 17
4 0 11 2 6 12 1 10
0
Aged 16 to 24 Aged 25 to 59 Aged 60+
Accommodation in poor condition Accommodation too large
Accommodation too small Eviction/NTQ/Asked to leave
Medical / disability reasons No fixed abode / roofless
Relationship Breakdown To give/receive support to/from family or friends
Unable to afford current rent / mortgage
Source: Gloucestershire Homeseeker dataset July 2016
A third of all households registered in July 2016 were in 1-bed need in Bronze banding. Overall nearly 62% of the housing register applicants are in
Bronze with little or no housing need. In addition Table 8 overleaf shows the bedroom need and banding as a percentage of the housing register.
19
Housing Strategy 2017-2021 Appendix 1aChart 6: Number of households registered by bedroom need and banding
Bedroom need by banding
600
500
400
300
200
100
0 1 2 3 4 5 6
Bronze 635 431 108 16 0 0
Silver 296 157 74 50 4 0
Gold 47 38 18 8 4 2
Emergency 35 2 0 0 0 0
Bedroom Need
Source: Gloucestershire Homeseeker dataset July 2016
Table 8: Households registered by bedroom need and banding as a percentage of all
applicants
Band Bronze Silver Gold Emergency Total
1-bed 33.16% 15.23% 2.39% 1.82% 52.60%
2-bed 22.30% 8.21% 2.13% 0.10% 32.74%
3-bed 5.56% 3.79% 0.94% 0.00% 10.29%
4-bed 0.83% 2.60% 0.00% 0.00% 3.85%
5-bed 0.00% 0.21% 0.21% 0.00% 0.42%
6-bed 0.00% 0.00% 0.10% 0.00% 0.10%
Total 61.85% 30.04% 6.19% 1.92%
Source: Gloucestershire Homeseeker dataset July 2016
There have been 4,069 lets in Tewkesbury Borough from October 2009 to August 2016.
Chart 7 shows the distribution across each of the bandings. When compared to the
20
Housing Strategy 2017-2021 Appendix 1apercentage of applicants by band in Table 8 on the previous page, there is a good spread of
homes let across the bandings in Tewkesbury Borough Council.
Chart 7: Lets in Tewkesbury, by band, October 2009 to August 2016
2000
1564 (38.4%)
1500 1272 (31.3%)
1035 (25.4%)
1000
500
198 (4.9%)
0
Bronze Silver Gold Emergency
Source: Gloucestershire Homeseeker dataset July 2016
It is also useful to understand those households seeking a larger home, smaller home or
same size home. Table 9 shows how many households currently registered have a
calculated bedroom need that means their move would be like-for-like in terms of number of
bedrooms, whether they’d be up-sizing to a larger property or downsizing to a smaller
property.
In terms of whether a household is seeking a larger or smaller home or they require a like-
for-like move, Table 9 below shows the bedroom need by house type required. In summary:
51% of households are in need of a ‘like for like move’ i.e. a 2-bed for a 2-bed. The
majority of which, 50% are 1-bed need:
o 214 (21%) of households in 1-bed need are seeking a home of their own (as they
state they are living in a shared house or with friends/parents/relatives).
o 19% of households in 2-bed need are seeking a like for like move; this may simply
mean they live in a flat and are seeking a house with garden for example.
23% require a larger home (are up-sizing); 11 households are in need of a 5 or 6 bed
home.
26% downsizing - the majority (61.8%) of which are in 1-bed need.
Table 9: Bedroom need and current house type
Bedroom Need ‘Like for like’ move Up-sizing Down-sizing
1-Bed 493 214 311
2-Bed 367 100 161
3-Bed 108 61 28
4-Bed 13 60 3
5-Bed 0 9 0
6-Bed 0 2 0
Total 981 (51%) 446 (23%) 503 (26%)
Source: Gloucestershire Homeseeker dataset July 2016
21
Housing Strategy 2017-2021 Appendix 1a7 Profile of new accommodation
The SHMA 2014 informs us that Tewkesbury Borough requires a minimum of all new build
housing to be 27% affordable housing. The assessment provides us with evidence of the
affordable housing tenures and house types that the council should be negotiating on new
developments to 2031:
Chart 8: Profile of new accommodation required in Tewkesbury (lower scenario)
Over the last 8 years the affordable housing split overall in Tewkesbury Borough has been
64% social and affordable rented housing to 36% shared ownership on completed eligible
sites. The percentage varies on a site by site basis depending on the constraints of the
development such as the location of the site and local demand and specific housing need,
i.e. bungalows and wheelchair accessible homes, and viability where a site may require an
increase in homes for sale in order to achieve a policy compliant overall percentage of
affordable homes.
The Council’s housing services team continues to negotiate a suitable percentage of rent
and home ownership across appropriate house types and will continue with a flexible
approach to achieving policy compliant developments to meet the housing needs of our
borough. This is likely to mean that while the SHMA analysis guides our negotiations we
must stray from these figures on occasions and when appropriate to create the best possible
development for local people and taking into account the particular needs of our
communities.
22
Housing Strategy 2017-2021 Appendix 1aYou can also read