Biology Summer Independent Learning - New College ...
←
→
Page content transcription
If your browser does not render page correctly, please read the page content below
Biology Summer Independent Learning

There are 2 things we are expecting of you from your SIL. Teachers will be checking
that this has been completed in the first week back in September.
Core Content
   1. Complete the questions, and mark (mark scheme at the back of the paper)
   2. Test yourself on the content for 7.4 populations in ecosystems, in preparation
      for an assessment on your return to college

Highly recommended content will assist you in future topics covered in Y13

                                    Page 1 of 39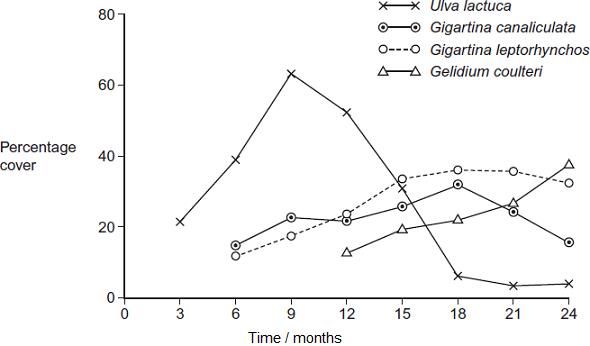
Learning Outcomes – 7.4 Populations in ecosystems (A-level only)
Learning Outcome
Populations of different species form a community. A community and
the non-living components of its environment together form an
ecosystem. Ecosystems can range in size from the very small to the
very large. Within a habitat, a species occupies a niche governed by
adaptation to both abiotic and biotic conditions.
An ecosystem supports a certain size of population of a species, called
the carrying capacity. This population size can vary as a result of:
the effect of abiotic factors
interactions between organisms: interspecific and intraspecific
competition and predation.
The size of a population can be estimated using:
randomly placed quadrats, or quadrats along a belt transect, for
slow-moving or non-motile organisms
the mark-release-recapture method for motile organisms. The
assumptions made when using the mark-release-recapture method.
Ecosystems are dynamic systems.
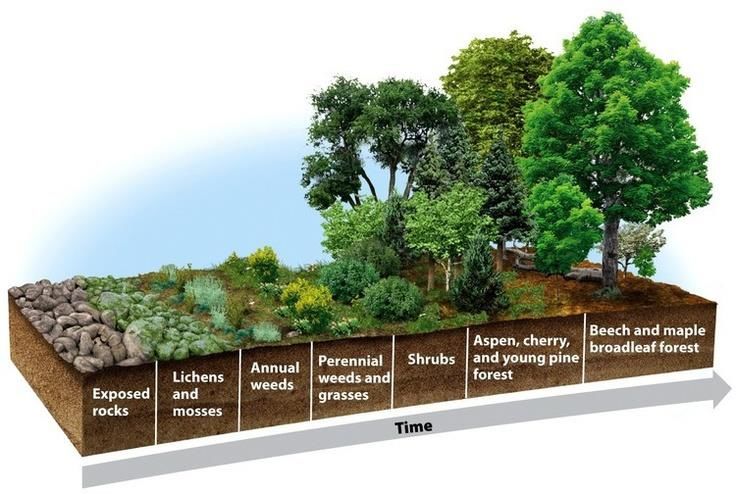
Succession
Primary succession, from colonisation by pioneer species to climax
community.
At each stage in succession, certain species may be recognised which
change the environment so that it becomes more suitable for other
species with different adaptations.
The new species may change the environment in such a way that it
becomes less suitable for the previous species.
Changes that organisms produce in their abiotic environment can result
in a less hostile environment and change biodiversity.
Conservation of habitats frequently involves management of succession
Students should be able to:
show understanding of the need to manage the conflict between
human needs and conservation in order to maintain the
sustainability of natural resources
evaluate evidence and data concerning issues relating to the
conservation of species and habitats and consider conflicting
evidence
use given data to calculate the size of a population estimated
using the mark-release-recapture method.
Required practical 12: Investigation into the effect of a named
environmental factor on the distribution of a given species.
Page 2 of 39If you need a recap before starting the questions, the following videos may be of help:
https://www.youtube.com/watch?v=daH5_hwJY8o&list=PL0Mjub5NT756kVDMLLq1Pbh_vXg1rtGTl&index=
5
https://www.youtube.com/watch?v=J35QIX7b9sc&list=PL0Mjub5NT756kVDMLLq1Pbh_vXg1rtGTl&index=2
https://www.youtube.com/watch?v=y84tAo-IeLE&list=PL0Mjub5NT756kVDMLLq1Pbh_vXg1rtGTl&index=3
https://www.youtube.com/watch?v=_f6_f_7CJpA&list=PL0Mjub5NT756kVDMLLq1Pbh_vXg1rtGTl&index=4
Questions – Mark Scheme at the end of the document
Q1.
(a) What term is used to describe populations of different species living in the same habitat?
___________________________________________________________________
(1)
(b) Different species occupy different ecological niches.
Explain the advantage of species occupying different niches.
___________________________________________________________________
___________________________________________________________________
(1)
Page 3 of 39Scientists recorded the number of water beetle species in 30 lakes. In each lake, they measured
the pH of the water and recorded whether there were any fish present.
The graph shows their results.
(c) A student concluded that a decrease in acidity caused an increase in the number of water
beetle species.
Evaluate this conclusion.
___________________________________________________________________
___________________________________________________________________
___________________________________________________________________
___________________________________________________________________
___________________________________________________________________
___________________________________________________________________
(3)
Page 4 of 39(d) Explain how the presence of fish in a lake could cause an increase in the number of water
beetle species.
___________________________________________________________________
___________________________________________________________________
(1)
(Total 6 marks)
Q2.
The organic material in household waste can be used to make compost for use as a fertiliser.
Scientists investigated changes during one process used to make this compost. The method
involved placing the waste in large containers for 150 days. At regular intervals the containers
were rotated. The scientists measured the temperature of samples of waste during the
investigation.
Figure 1 shows the results they obtained. The vertical bars show standard deviations.
Figure 1
(a) Explain how microorganisms contributed to the increase in temperature during processing
of organic waste.
___________________________________________________________________
___________________________________________________________________
___________________________________________________________________
___________________________________________________________________
(2)
Page 5 of 39(b) Explain the advantage of showing the data using standard deviations rather than ranges.
___________________________________________________________________
___________________________________________________________________
___________________________________________________________________
___________________________________________________________________
(2)
(c) Suggest two advantages of rotating the containers during the process.
1. _________________________________________________________________
___________________________________________________________________
2. _________________________________________________________________
___________________________________________________________________
(2)
(d) The scientists took a sample of the waste at the start of the process. They then took
samples every 30 days. In each sample, they determined the numbers of particular types
of bacteria.
Figure 2 shows the changes in the number of three types of bacteria during the process.
Figure 2
Page 6 of 39The scientists concluded that the results in Figure 1 and Figure 2 are evidence for a form
of succession during the process.
Use the information to suggest how they reached this conclusion.
___________________________________________________________________
___________________________________________________________________
___________________________________________________________________
___________________________________________________________________
___________________________________________________________________
___________________________________________________________________
___________________________________________________________________
___________________________________________________________________
(3)
(Total 9 marks)
Page 7 of 39Q3.
Algae are photosynthesising organisms. Some grow on rocky shores. Scientists investigated the
abundance of different species of algae at two sites, A and B, on a rocky shore. Site A was on
the upper shore and site B was on the lower shore. The diagram shows the location of sites A
and B on the rocky shore.
Table 1 shows some of the results the scientists obtained.
Table 1
Site A Site B
Upper shore Lower shore
Species of algae Gigartina leptorhynchos Gigartina spinosa
with percentage
Gigartina canaliculata Rhodoglossum affine
cover more than
1% Gelidium coulteri Laurencia pacifica
Rhodoglossum affine Gastroclonium coulteri
Centroceros clavulatum
Gigartina canaliculata
Corallina vancouveriensis
(a) The scientists recorded data from 40 large rocks at each site.
Describe one method that the scientists could have used to ensure that the large rocks
were chosen without bias.
___________________________________________________________________
___________________________________________________________________
___________________________________________________________________
___________________________________________________________________
(2)
Page 8 of 39(b) The scientists used percentage cover rather than frequency to record the abundance of
algae present
Suggest why.
___________________________________________________________________
___________________________________________________________________
(1)
(c) Apart from availability of water, describe and explain how two abiotic factors may have
caused differences in the species of algae growing at sites A and B.
Factor 1 ____________________________________________________________
Explanation _________________________________________________________
___________________________________________________________________
Factor 2 ____________________________________________________________
Explanation _________________________________________________________
___________________________________________________________________
(2)
(d) Use the information provided in Table 1 to explain why the diversity of consumers will be
greater at site B.
___________________________________________________________________
___________________________________________________________________
___________________________________________________________________
___________________________________________________________________
(2)
(e) The scientists also investigated the algae eaten by two consumers found on the rocky
shore, the sea slug and the shore crab. The scientists carried out their investigation in a
laboratory.
• They put each consumer into a separate tank through which aerated seawater
flowed slowly.
• Each tank contained 5 grams of one species of alga.
• After 50 hours, they measured the mass of the alga remaining in each tank.
• They repeated this procedure several times using a different sea slug and a different
shore crab each time.
The scientists then calculated the mean mass of each species of alga eaten by the
consumers. They used a statistical test to determine the P value.
Table 2 shows some of the results they obtained.
Page 9 of 39Table 2
Mean mass eaten / g
Species of alga P value
Sea slug Shore crab
Laurencia pacifica 4.42 0.22 0.05
Microcystis pyrifera 0.19 0.14 >0.05
Cystoseira
0.17 0.04(iii) Suggest what conclusions the scientists could have made from this investigation
when using the probability values in Table 2.
______________________________________________________________
______________________________________________________________
______________________________________________________________
______________________________________________________________
______________________________________________________________
______________________________________________________________
(3)
(Total 15 marks)
Q4.
The graph shows how gross productivity and biomass in an area changed with time in the
succession from bare soil to mature woodland.
(a) (i) Suggest appropriate units for gross productivity.
______________________________________________________________
(1)
(ii) Explain the decrease in gross productivity as the woodland matures.
______________________________________________________________
______________________________________________________________
______________________________________________________________
______________________________________________________________
______________________________________________________________
(2)
Page 11 of 39(b) Use your knowledge of succession to explain the increase in biomass during the first 20
years.
___________________________________________________________________
___________________________________________________________________
___________________________________________________________________
___________________________________________________________________
___________________________________________________________________
___________________________________________________________________
(3)
(c) Use the information in the graph and your knowledge of net productivity to explain why
biomass shows little increase after 100 years.
___________________________________________________________________
___________________________________________________________________
___________________________________________________________________
___________________________________________________________________
___________________________________________________________________
(2)
(d) Suggest one reason for conserving woodlands.
___________________________________________________________________
___________________________________________________________________
___________________________________________________________________
(1)
(Total 9 marks)
Page 12 of 39Q5.
Ecologists used a method called proportional sampling to estimate the population size of an
animal species. This method is based on assumptions. Two of the assumptions are given below.
1. They know the size of the area, A, where the animal population lives.
2. The animals are uniformly distributed in this area.
To carry out the method, the ecologists:
• chose a region of known size, R, inside area A
• counted the number of animals in region R. They called this number S
• assumed that the number, S, would be in proportion to the size of the total population, P,
in area A.
(a) Proportional sampling can be used to estimate the population size of a species that is
uniformly distributed.
(i) What is a species?
______________________________________________________________
______________________________________________________________
______________________________________________________________
(1)
(ii) What is meant by uniformly distributed?
______________________________________________________________
______________________________________________________________
______________________________________________________________
(1)
(b) Use the letters A, R and S to write an equation showing how proportional sampling is used
to estimate the total size of a population, P. Show your working.
P = ____________________
(2)
Page 13 of 39(c) Population size can be estimated using proportional sampling or mark-release-recapture.
(i) How do the assumptions made in proportional sampling differ from those made in
mark-release-recapture?
______________________________________________________________
______________________________________________________________
______________________________________________________________
______________________________________________________________
______________________________________________________________
(2)
(ii) Give one assumption about the animals caught that is made in both methods.
______________________________________________________________
______________________________________________________________
______________________________________________________________
(1)
(Total 7 marks)
Q6.
Tigers inhabit forests where they feed mainly on large prey animals. Over the past fifty years,
there has been extensive deforestation in many areas where tigers are found.
The graph shows the relationship between the prey biomass of an area and the tiger population
that the area can support.
Page 14 of 39(i) What is meant by the ecological term population?
___________________________________________________________________
___________________________________________________________________
(1)
(ii) Use the graph to explain how deforestation might cause a reduction in the number of
tigers in an area.
___________________________________________________________________
___________________________________________________________________
___________________________________________________________________
___________________________________________________________________
___________________________________________________________________
___________________________________________________________________
(3)
(Total 4 marks)
Q7.
Algae are photosynthesising organisms. Some algae grow on rocky shores. A scientist
investigated succession involving different species of algae. He placed concrete blocks on a
rocky shore. At regular intervals over 2 years, he recorded the percentage cover of algal species
on the blocks. His results are shown in the graph.
Page 15 of 39(a) Name the pioneer species.
___________________________________________________________________
(1)
(b) (i) The scientist used percentage cover rather than frequency to record the abundance
of algae present. Suggest why.
______________________________________________________________
______________________________________________________________
______________________________________________________________
(1)
(ii) Some scientists reviewing this investigation were concerned about the validity of
the results because of the use of concrete blocks.
Suggest one reason why these scientists were concerned about using concrete
blocks for the growth of algae.
______________________________________________________________
______________________________________________________________
(1)
(c) Use the results of this investigation to describe and explain the process of succession.
___________________________________________________________________
___________________________________________________________________
___________________________________________________________________
___________________________________________________________________
___________________________________________________________________
___________________________________________________________________
___________________________________________________________________
___________________________________________________________________
(4)
(Total 7 marks)
Page 16 of 39Q8.
(a) Explain what is meant by
(i) succession;
______________________________________________________________
______________________________________________________________
______________________________________________________________
______________________________________________________________
(2)
(ii) a climax community.
______________________________________________________________
______________________________________________________________
(1)
Heather plants are small shrubs. Heather plants are the dominant species in the climax
community of some moorlands. The structure and shape of a heather plant changes as it ages.
This results in changes in the species composition of the community. A large area of moorland
was burnt leaving bare ground. The table shows four stages of succession in this area.
Mean Other plant
Time after Appearance of
percentage species
burning / years heather plant
cover of heather present
4 10 Many
12 90 Few
19 75 Several
24 30 Many
Page 17 of 39(b) Explain why the number of other plant species decreases between 4 and 12 years after
burning.
___________________________________________________________________
___________________________________________________________________
___________________________________________________________________
___________________________________________________________________
(2)
(c) The rate at which a heather plant produced new biomass was measured in g per kg of
heather plant per year. This rate decreased as the plant aged. Use the information in the
table to explain why.
___________________________________________________________________
___________________________________________________________________
___________________________________________________________________
___________________________________________________________________
___________________________________________________________________
(3)
(Total 8 marks)
Page 18 of 39Q9.
In a sand dune succession the pioneer community (A) colonises bare sand. This community is
replaced over time by other communities (B and C) until a climax community of woodland (D) is
formed.
(a) The communities A to D are composed of different species. Explain how the change in
species composition occurs in a succession.
___________________________________________________________________
___________________________________________________________________
___________________________________________________________________
___________________________________________________________________
(3)
(b) Which community, A to D, is the most stable? Explain what makes this the most stable
community.
___________________________________________________________________
___________________________________________________________________
___________________________________________________________________
___________________________________________________________________
(2)
(c) Many species in the pioneer community are xerophytes. Suggest and explain how having
sunken stomata is an advantage to these plants.
Page 19 of 39___________________________________________________________________
___________________________________________________________________
___________________________________________________________________
___________________________________________________________________
(3)
(d) Explain why it would be more appropriate to use a transect rather than random quadrats
when investigating this succession.
___________________________________________________________________
___________________________________________________________________
(1)
(Total 9 marks)
Q10.
Lemmings are small mammals which live in the Arctic. Their main predator is the stoat, a small
carnivorous mammal, which feeds almost entirely on lemmings. The graph shows the changes in
the numbers of lemmings and stoats from 1988 to 2000.
(a) Describe and explain the changes which occur in the lemming and stoat populations.
___________________________________________________________________
___________________________________________________________________
___________________________________________________________________
___________________________________________________________________
___________________________________________________________________
(6)
Page 20 of 39(b) Lemmings often live in isolated populations. From time to time some lemmings move and
join other populations. Explain how this movement is important in maintaining genetic
variability in lemming populations which have large fluctuations in size.
___________________________________________________________________
___________________________________________________________________
___________________________________________________________________
___________________________________________________________________
(2)
(c) James Bay is a large ocean bay in northern Canada. It was formed by the melting of
glaciers. One species of lemming inhabits the eastern side of James Bay and another
species of lemming inhabits the western side. Before the glaciers melted there was only
one species of lemming present. Explain how two species of lemming evolved from the
original species.
___________________________________________________________________
___________________________________________________________________
___________________________________________________________________
___________________________________________________________________
___________________________________________________________________
___________________________________________________________________
___________________________________________________________________
(4)
(Total 12 marks)
Page 21 of 39Q11.
Climatic factors, such as temperature and rainfall, vary greatly over short distances across
mountain ranges. In an investigation, populations of the plant, Achillea lanulosa, were sampled
from several sites on a transect across a mountain range. At each sampling site, seeds were
collected at random. Each batch of seeds was germinated and grown to maturity under the
same experimental conditions.
The diagram shows
• a profile indicating the position and altitude of the sampling sites
• the mean height of mature plants grown from each sample of seeds
• the standard deviation of heights of the mature plants grown from each sample of seeds.
(a) (i) Give one limitation of using a line transect to collect these data.
______________________________________________________________
______________________________________________________________
(1)
Page 22 of 39(ii) Suggest how plants should be chosen at each sampling site to avoid bias and to be
representative.
______________________________________________________________
______________________________________________________________
______________________________________________________________
______________________________________________________________
(2)
(b) (i) What information does the bar representing standard deviation give about the plants
in a sample?
______________________________________________________________
______________________________________________________________
(1)
(ii) Describe what the results show about the variation of the height of the plants in
relation to altitude.
______________________________________________________________
______________________________________________________________
______________________________________________________________
______________________________________________________________
(2)
(iii) There was a significant difference between the mean heights of the plants grown
from seeds taken from sites A and D. Describe the evidence from the information
given which shows that this is likely to be due to genetic differences between the
two populations.
______________________________________________________________
______________________________________________________________
(1)
(Total 7 marks)
Page 23 of 39Q12.
A student investigated an area of moorland where succession was occurring. She used quadrats
to measure the percentage cover of plant species, bare ground and surface water every 10
metres along a transect. She also recorded the depth of soil at each quadrat. Her results are
shown in the table.
Percentage cover in each quadrat A to E
A B C D E
Bog moss 55 40 10 – –
Bell heather – – – 15 10
Sundew 10 5 – – –
Ling – – – 15 20
Bilberry – – – 15 25
Heath grass – – 30 10 5
Soft rush – 30 20 5 5
Sheep’s fescue – – 25 35 30
Bare ground 20 15 10 5 5
Surface water 15 10 5 – –
Soil depth / cm 3.2 4.7 8.2 11.5 14.8
– Indicates zero percentage cover.
(a) Explain how these data suggest that succession has occurred from points A to E along the
transect.
___________________________________________________________________
___________________________________________________________________
___________________________________________________________________
___________________________________________________________________
___________________________________________________________________
___________________________________________________________________
(3)
Page 24 of 39(b) The diversity of animal species is higher at E than A. Explain why.
___________________________________________________________________
___________________________________________________________________
___________________________________________________________________
___________________________________________________________________
___________________________________________________________________
(2)
(c) The student used the mark-release-recapture technique to estimate the size of the
population of sand lizards on an area of moorland. She collected 17 lizards and marked
them before releasing them back into the same area. Later, she collected 20 lizards, 10 of
which were marked.
(i) Give two conditions for results from mark-release-recapture investigations to be
valid.
1. ____________________________________________________________
______________________________________________________________
2. ____________________________________________________________
______________________________________________________________
(2)
(ii) Calculate the number of sand lizards on this area of moorland. Show your working.
Answer = ____________________
(2)
(Total 9 marks)
Page 25 of 39Q13.
Biologists studied the process of succession in an area of wasteland over a period of ten years.
They calculated the index of diversity of the area every year. After three years, the index of
diversity was 1.6. After ten years, it had risen to 4.3.
(a) What information concerning the organisms present in the area is suggested by the
increase in the index of diversity?
___________________________________________________________________
___________________________________________________________________
___________________________________________________________________
___________________________________________________________________
(2)
(b) The increase in the index of diversity is one indication that a biological succession is taking
place in the area. Describe those features of a succession that would bring about an
increase in the index of diversity.
___________________________________________________________________
___________________________________________________________________
___________________________________________________________________
___________________________________________________________________
___________________________________________________________________
___________________________________________________________________
___________________________________________________________________
(3)
(Total 5 marks)
Page 26 of 39Highly recommended content
Required practical 9 - Respiration
Watch the YouTube clip and answer the following questions:
https://www.youtube.com/watch?v=1YUONb7_CLs&list=PL0Mjub5NT75746Ok9jijVZoNXjrEzU53G&index=1
4&t=0s
1. State the independent variable in the investigation
2. State the dependent variable in the investigation
3. State 2 control variables and explain how they are kept constant
4. What is the purpose of the oil?
5. Why does the fluid move?
Page 27 of 39Unit 5 – Nutrient Cycles
Watch the following video.
https://www.youtube.com/watch?v=_H5phG_Ae6M
Write an essay or create a concept map illustrating the importance of nitrogen in Biology.
Unit 5 – Productivity
Research and make a poster on how farmers can maximise productivity and the yield of crops.
Page 28 of 39Mark schemes
Q1.
(a) Community;
1
(b) (Less) competition for food/resource;
Ignore: competition for niche/habitat.
Accept: space/named resource.
Reject: intraspecific competition.
1
(c) 1. Correlation but does not mean a causal effect;
Ignore: positive/ negative (correlation).
2. Other abiotic/biotic/named factor involved;
Accept: due to presence/absence of fish.
Reject: ‘other factors’ unless further qualified.
3. Variation in numbers of beetles species at
same/similar particular pH;
Accept: same number of beetles at different pHs.
Accept: ‘scattered results’ / ‘anomalies’ / ‘spread of results’.
4. Large sample;
Max 3
(d) Fish feed on predator/consumer of water beetle;
Accept: beetles feed on fish/faeces.
1
[6]
Q2.
(a) 1. Respiration/metabolism/ammonification;
2. (Releases/produces) heat;
Reject: ‘produces energy’.
2
(b) 1. SD is spread of data around the mean;
Accept: variation around the mean.
Accept: range is difference between highest and lowest
values/extremes or range includes anomalies/outliers.
2. (SD) reduces effect of anomalies/ outliers;
Reject: (SD) removes anomalies/outliers.
3. (SD) can be used to determine if (difference in results is)
significant/not significant/due to chance /not due to chance;
Ignore: reliability/accuracy/validity.
2 max
Page 29 of 39(c) 1. Distributes heat / prevents ‘hot’ spots;
2. Distributes microorganisms;
3. More enzyme-substrate complexes;
4. Increases rate of decomposition;
Accept: increases nitrification/ammonification or ‘breaks
down waste faster’.
5. Aeration/provides oxygen;
2 max
(d) 1. Microorganisms change the abiotic
conditions/temperature/organic waste /provide
nutrients;
Must refer to microorganisms or bacteria/named bacteria
causing the change.
Ignore: change the environment.
2. Less hostile conditions;
3. Decline in Cocci and increase in rods;
Accept: ‘decrease in cocci, others are going up’.
Accept: decrease in cocci and increase in either rod type or
increase in both types.
4. Gram positive outcompete / better competitors;
Accept: rods outcompete (cocci) / better competitors.
3 max
[9]
Q3.
(a) 1. (Use) coordinates / number the rocks/sites/squares;
Ignore: references to grid, tape measures, metre rulers etc.
2. Method of generating/finding random numbers e.g.
calculator/computer/random number generator/random
numbers table;
Accept: numbers out of a hat / use of dice.
2
(b) Difficult/too many to count / individual organisms not
identifiable / too small to identify/count / grows in clumps;
Ignore: easier/quicker/representative/ more accurate,
unless qualified.
1
Page 30 of 39(c) Any suitable factor with valid explanation = 1 mark
1. Wave action - firmer grip on rock is necessary (at either
site);
2. Wind/air movement/less humid - more evaporation at site A
/ more (physical) damage;
3. Light – (linked to) photosynthesis (at either site);
4. Temperature – (linked to)
photosynthesis/respiration/enzymes/ evaporation (at either
site);
5. pH – (linked to) enzymes/proteins;
Note: other common factors include salt (salinity) linked to
water potential / named nutrient e.g. nitrate linked to
protein/DNA.
Ignore: carbon
dioxide/oxygen/pollution/rainfall/food/nutrients.
Reject: biotic factors e.g. predation.
2 max
(d) 1. Greater variety of food / more food sources;
Ignore: more food.
2. More/variety of habitats/niches;
Ignore: homes/shelters.
Accept: different habitats.
2
(e) (i) 1. (So they were) hungry/not full;
Accept: description of hunger e.g. appetite / ‘empty
stomach’/’so they eat’.
2. (Allows) comparison;
2
(ii) 1. Alga without consumer/named
consumer/animal;
Accept: repeat experiment without consumer.
Accept: in separate tank / in tank where not eaten.
2. (Find change in mass) in dark;
3. For 50 hours;
Accept: ‘same time as in experiment’.
Accept: For lower time period then scaled up to 50.
3
Page 31 of 39(iii) 1. For Laurencia pacifica and Cystoseira
osmondacea (difference in results) significant
/reject null hypothesis / not due to chance / less
than 5%/0.05 probability due to chance;
Accept: for Laurencia pacifica ‘less than 1%/0.01
probability’.
2. For Egregia leavigata and Microcystis pyrifera no
significant (difference in results)/accept null
hypothesis / is due to chance/more than 5%/0.05
probability due to chance;
Accept: ‘insignificant’ for ‘no significant difference’.
3. (Difference in results) for Laurencia pacifica is the
most significant;
Note: reference to probabilities on their own is not
sufficient.
1, 2 and 3. Accept: abbreviations for all species.
3
[15]
Q4.
(a) (i) Unit of energy / mass, per area, per year.
1
(ii) 1. Less light / more shading / more competition for light;
Neutral: references to animals
2. Reduced photosynthesis.
Accept: no photosynthesis
2
(b) 1. Pioneer species;
2. Change in abiotic conditions / less hostile / more habitats / niches;
Accept: named abiotic change or example of change e.g.
formation of soil / humus / organic matter / increase in
nutrients
Neutral: reference to change in environment unqualified
Neutral: more hospitable / habitable / homes / shelters
3. Increase in number / amount / diversity of species / plants / animals.
Accept: other / new species (colonise)
3
(c) 1. Net productivity = gross productivity minus respiratory loss;
2. Decrease in gross productivity / photosynthesis / increase in
respiration.
2
Page 32 of 39(d) 1. Conserving / protecting habitats / niches;
2. Conserving / protecting (endangered) species / maintains / increases
(bio) diversity;
3. Reduces global warming / greenhouse effect / climate change /
remove / take up carbon dioxide;
4. Source of medicines / chemicals / wood;
5. Reduces erosion / eutrophication.
Accept: tourism / aesthetics / named recreational activity
1 max
[9]
Q5.
(a) (i) (Organisms that) can breed together / interbreed and produce fertile
offspring;
Need both aspects. Reject ‘inbreed’
Reject viable offspring
1
(ii) Same number (of organisms) in each region / (organisms) equally
spread;
Allow other ways of expressing ‘region’ or ‘equally spread’,
eg not clumped together, same number per unit area
1
(b)
2 marks for correct answer
1 mark for having A on top of equation (recognises that
total population related to total area)
Note:
P = A × S / R or
P=A/R×S
are also correct.
Allow 1 mark for
2
(c) (i) In mark–release-recapture (technique)
Accept converse by considering assumptions of
proportional sampling
Page 33 of 391. No assumption that organisms are uniformly distributed;
2. Size of total area / size of sampled region not required;
Marking point 1 or marking point 2 do not have to start with
the same technique
In this case, allow difference by implication i.e. do not
penalise if the two techniques are not compared
2
(ii) Animals are from / all part of the same population;
1
[7]
Q6.
(i) Population is the total number of organisms / individuals of a
species / tigers in an area (at a given time);
1
(ii) (Deforestation involves) habitat destruction / destruction of niches;
Some prey animals move out or die / fewer suitable prey for tiger /
less food for tiger; Reduces tiger population if prey biomass
falls below 600 (tonnes per km2);
3
[4]
Q7.
(a) Ulva lactuca;
Reject: Ulva on its own
Accept: lactuca on its own
Accept: Incorrect spelling
1
(b) (i) Difficult / too many / too many to count / individual organisms not
identifiable / too small to identify / grows in clumps;
Neutral: easier / quicker / representative / more accurate,
unless qualified
1
(ii) Any described feature of concrete eg texture / flat / composition
chemicals / nutrients etc;
Neutral: not natural / man made / are different, without
further qualification
1
Page 34 of 39(c) 1. Pioneer species / Ulva increases then decreases;
1 and 4. Growth / reproduces = increases. Dies = decrease
2. Principle of a species changing the conditions / a species makes the
conditions less hostile;
2. Accept description of change in conditions eg
soil / humus forms, nutrients increased
3. New / named species better competitor / previous / named / pioneer
species outcompeted;
Pioneer species grows, dies and forms humus = 2 marks
G. coulteri / Gelidium outcompetes other / named species
= 2 marks
4. G. coulteri / Gelidium increases and other / named species decreases;
4
[7]
Q8.
(a) (i) change in community over time;
either due to change environmental / abiotic factors / change is due to
species present;
2
(ii) stable community / no further succession / final community;
1
(b) (increased) interspecific competition;
for light / nutrients / named nutrient / water;
2
(c) fewer leaves / lower surface area / shading of leaves so less photosynthesis to
produce new biomass / glucose / growth; competition with other species for
nitrates / named nutrients so reduced synthesis of protein or named compound;
ratio of leaves to woody parts and roots decreases so higher respiration relative to
photosynthesis;
3
[8]
Page 35 of 39Q9.
(a) species present change the habitat / named change;
other species able to colonise;
new species better competitors;
3
(b) D - as more species present;
more complex food webs;
or
change in one species will have little effect on others;
as alternative food sources;
2 max
(c) sand drains easily / low water retention;
(sunken stomata) reduce transpiration;
as pocket pf saturated air trapped near stomatal pore;
this reduces diffusion / water potential gradient;
3 max
(d) series of changes over a distance / gradient of environmental
factor / named environmental factor / cline present / ensures
sampling of each community;
1
[9]
Q10.
(a) 1 4 year cycles;
2 predator / stoat peaks after prey / lemming;
3 lemmings increase due to low numbers of stoats / available food;
4 more food for stoats so numbers increase;
5 increased predation reduces number of lemmings;
6 number of stoats decreases due to lack of food / starvation;
6
(b) smaller populations have fewer different alleles / more homozygosity / less
heterozygosity / smaller gene pool / lower genetic variability;
migrants bring in new alleles / increase gene pool;
2
(c) geographical isolation of populations;
variation present in population(s);
different environmental conditions / different selection pressures / different
phenotypes selected;
change in genetic constitution of populations / gene pools / allele frequency;
4
[12]
Page 36 of 39Q11.
(a) (i) transect line may not go through representative areas / may avoid certain
areas;
1
(ii) large sample;
how random coordinates are generated / how random places
chosen;
2
(b) (i) spread of values around the mean height of the plant;
1
(ii) smaller plants at higher altitude;
greater the altitude the lower the standard deviation ;
reference to figures to make a comparison;
2 max
(iii) the plants measured were grown under uniform conditions;
1
[7]
Q12.
(a) 1. Decrease in (percentage cover) of bare ground / water linked to more plants
/ species / increase in plant coverage;
Allow one maximum mark for answers which describe all
three changes without a suitable explanation for any
change
Must be idea of more / increase not just change in species
/ plants
2. Change in diversity / number of plant / species / named (species) as
abiotic conditions altered / due to competition / more soil / less hostile;
Accept pioneer species replaced due to competition
Accept description of change in species
Accept ‘more suitable’ = less hostile
3. Increase in depth of soil as plants die / humus formed;
3
(b) 1. Greater variety of food / more food sources;
‘More food’ = neutral
2. More / variety of habitats / niches;
Ignore ‘more homes’ or reference to ‘shelters’
2
Page 37 of 39(c) (i) 1. Marking is not removed / marking does not affect survival /
predation;
2. Limited / no immigration / emigration;
Accept ‘migration’ and descriptions of immigration /
emigration
2. and 4. Increase / decrease in population is not sufficient
– there must be a reason
3. Sufficient time for (marked) individuals to mix (within the
population);
Accept – ‘For mixing to occur between samples’
4. No / little births / deaths / breeding;
5. Sampling method is the same;
Ignore ‘random sampling’
2 max
(ii) Correct answer of ...34 = 2 marks;
Allow one mark for an answer of 51 as candidate has
misinterpreted the second sample as being = 30
Incorrect answer but shows correct formula in words or numbers
e.g. 17 × 20 ÷ 10;
Reject correct formula multiplied by 100
2
[9]
Q13.
(a) Increase in number of species;
Increase in numbers of some species;
2
(b) Initial environment hostile / few organisms adapted;
These organisms change the environment / suitable example;
More niches / more habitats;
Allowing other organisms to become established;
max. 3
[5]
Page 38 of 39Required practical 9 - Respiration
Watch the YouTube clip and answer the following questions:
https://www.youtube.com/watch?v=1YUONb7_CLs&list=PL0Mjub5NT75746Ok9jijVZoNXjrEzU53G&index=1
4&t=0s
1. State the independent variable in the investigation
Type of sugar
2. State the dependent variable in the investigation
Time taken for fluid to move 10mm
3. State 2 control variables and explain how they are kept constant
Temperature – water bath. Monitored with a thermometer, if it gets too cold, more hot water is added
Yeast conc and volume (10cm3 5% yeast) and Substrate concentration and volume (10cm 3 5% of each
sugar).
4. What is the purpose of the oil?
Prevent Oxygen entering the yeast solution. Enables conditions to become anaerobic.
5. Why does the fluid move?
Anaerobic respiration produces CO2 but doesn’t use O2. Therefore as CO2 is produced, the pressure
increases, pushing the fluid along.
Page 39 of 39You can also read