Rural Municipality of Cartier

Information Bulletin 99-1
←
→
Page content transcription
If your browser does not render page correctly, please read the page content below
Rural Municipality of Cartier Information Bulletin 99-1
Rural Municipality of Cartier   Information Bulletin 99-1                                               Page 1

                                                  Rural Municipality of Cartier

                                                  Information Bulletin 99-1

                                                  Prepared by:

                                                  Land Resource Unit,
                                                  Brandon Research Centre, Research Branch,
                                                  Agriculture and Agri-Food Canada.

                                                  Department of Soil Science, University of Manitoba.

                                                  Manitoba Soil Resource Section,
                                                  Soils and Crops Branch, Manitoba Agriculture.

                                                  Printed April, 1999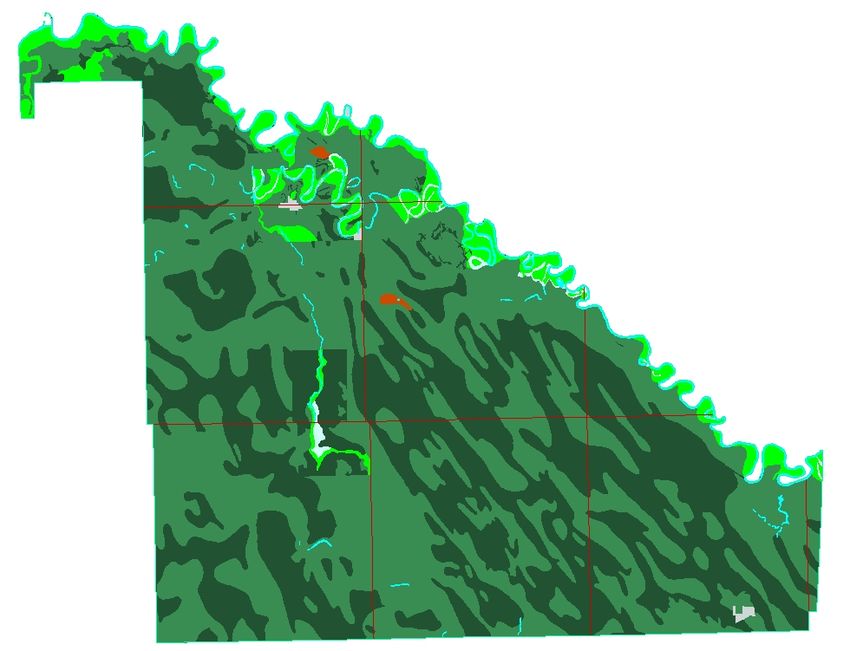
Page 2                                                        Information Bulletin 99-1                           Rural Municipality of Cartier

PREFACE                                                                      ACKNOWLEDGMENTS

This is one of a new series of information bulletins for individual          Continuing support for this project has been provided by Brandon
rural municipalities of Manitoba. They serve to introduce the newly          Research Centre and PFRA Manitoba. The project was initiated by
developed digital soil databases and illustrate several typical derived      the Land Resource Unit under the Canada-Manitoba Agreement of
and interpretive map products for agricultural land use planning             Agricultural Sustainability.
applications. The bulletins will also be available in diskette format
for each rural municipality.                                                 The following individuals and agencies contributed significantly to
                                                                             the compilation, interpretation, and derivation of the information
Information contained in this bulletin may be quoted and utilized            contained in this report.
with appropriate reference to the originating agencies. The authors
and originating agencies assume no responsibility for the misuse,            Managerial and administrative support was provided by:
alteration, re-packaging, or re-interpretation of the information.
                                                                             R.G. Eilers, Head, Land Resource Unit, Brandon Research Centre,
This information bulletin serves as an introduction to the land              Research Branch, Agriculture and Agri-Food Canada.
resource information available for the municipality. More detailed           G.J. Racz, Head, Department of Soil Science, University of
information, including copies of the primary soil and terrain maps           Manitoba.
at larger scales, may be obtained by contacting
                                                                             Technical support was provided by:
Land Resource Unit
Room 360 Ellis Bldg, University of Manitoba                                  G.W. Lelyk, and P. Cyr, Land Resource Unit, Brandon Research
Winnipeg, Manitoba R3T 2N2                                                   Centre, Research Branch, Agriculture and Agri-Food Canada.
Phone: 204-474-6118 FAX: 204-474-7633                                        J. Fitzmaurice, and A. Waddell, Department of Soil Science,
                                                                             University of Manitoba.
CITATION                                                                     G.F. Mills, P. Ag, Winnipeg, Manitoba
Land Resource Unit, 1999. Soils and Terrain. An Introduction to the          J. Griffiths, and C. Aglugub, Soil Resource Section, Soils and Crops
Land Resource. Rural Municipality of Cartier. Information Bulletin           Branch, Manitoba Agriculture.
99-1, Brandon Research Centre, Research Branch, Agriculture and              R. Lewis, PFRA, Agriculture and Agri-Food Canada.
Agri-Food Canada
                                                                             Professional expertise for data conversion, correlation, and
                                                                             interpretation was provided by:

                                                                             W.R. Fraser and R.G. Eilers, Land Resource Unit, Brandon
                                                                             Research Centre, Research Branch, Agriculture and Agri-Food
                                                                             Canada.
                                                                             P. Haluschak and G. Podolsky, Soil Resource Section, Soils and
                                                                             Crops Branch, Manitoba Agriculture.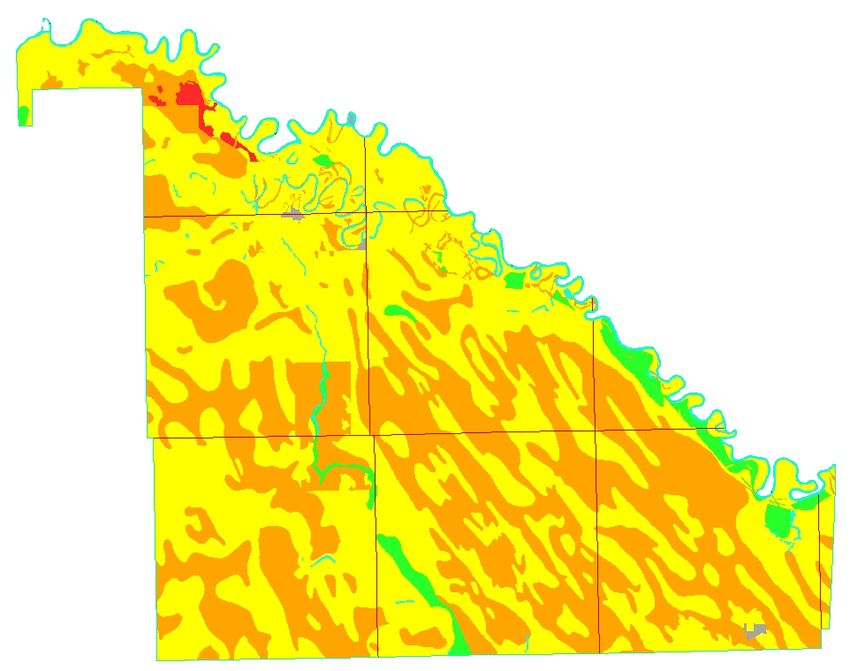
Rural Municipality of Cartier                          Information Bulletin 99-1                                  Page 3

                                                                                   INTRODUCTION

                                                                                   The location o f t h e Rural
                                                                                   Municipality of Cartier is shown in
                                                                                   Figure 1. A brief overview of the
                                                                                   database information, and general
                                                                                   environmental conditions for the
                                                                                   municipality are presented. A set of
                                                                                   maps derived from the data for
                                                                                   typical agricultural land use and
                                                                                   planning applications are also
                                                                                   included.

                                                                                   The soil map and database were
                                                                                   compiled and registered using the
                                                                                   Geographic Information System
                                                                                   (PAMAP GIS) facilities of the Land
                                                                                   Resource Unit. These databases were
                                                                                   used in the GIS to create the
                                                                                   generalized, derived and interpretive
                                                                                   maps and statistics in this report. The
                                                                                   final maps were compiled and printed
                                                                                   using Coreldraw.

                                                                                   This bulletin is available in printed or
                                                                                   digital format. The digital bulletin is
                                                                                   a Windows based executable file
                                                                                   which offers additional display
                                                                                   options, including the capability to
                                                                                   print any portion of the bulletin.

Figure 1. Rural municipalities of southern Manitoba.
Page 4                                                    Information Bulletin 99-1                            Rural Municipality of Cartier

LAND RESOURCE DATA                                                       Base Layer

The soil and terrain information presented in this bulletin was          Digital base map information includes the municipality and
compiled as part of a larger project to provide a uniform level of       township boundaries, along with major streams, roads and
land resource information for agricultural and regional planning         highways. Major rivers and lakes from the base layer were also used
purposes throughout Agro-Manitoba. This information was                  as common boundaries for the soil map layer. Water bodies larger
compiled and analysed in two distinct layers as shown in Figure 2.       than 25 ha in size were digitized as separate polygons.

                                                                         Soil Layer

                                                                         The most detailed soil information currently available was selected
                                                                         as the data source for the digital soil layer for each rural
                                                                         municipality.

                                                                         Comprehensive detailed soil maps (1:20 000 to 1:50 000 scale) have
                                                                         been published for many rural municipalities. Where they were
                                                                         available, the individual soil map sheets were digitized and
                                                                         compiled as a single georeferenced layer to match the digital RM
                                                                         base. Map polygons have one or more soil series components, as
                                                                         well as slope and stoniness classes. Soil database information was
                                                                         produced for each polygon, to meet national standards (MacDonald
                                                                         and Valentine, 1992). Slope length classes were also added, based
                                                                         on photo-interpretation.

                                                                         Older, reconnaissance scale soil maps (1:126 720 scale) represented
                                                                         the only available soil data source for many rural municipalities.
                                                                         These maps were compiled on a soil association basis, in which soil
                                                                         landscape patterns were identified with unique surficial geological
                                                                         deposits and textures. Each soil association consists of a range of
                                                                         different soils ("associates") each of which occurs in a repetitive
                                                                         position in the landscape. Modern soil series that best represent the
                                                                         soil association were identified for each soil polygon. The soil and
Figure 2. Soil and Base Map data.                                        modifier codes provide a link to additional databases of soil
                                                                         properties. In this way, both detailed and reconnaissance soil map
                                                                         polygons were related to soil drainage, surface texture, and other
                                                                         soil properties to produce various interpretive maps. Slope length
                                                                         classes were also added, based on photo-interpretation.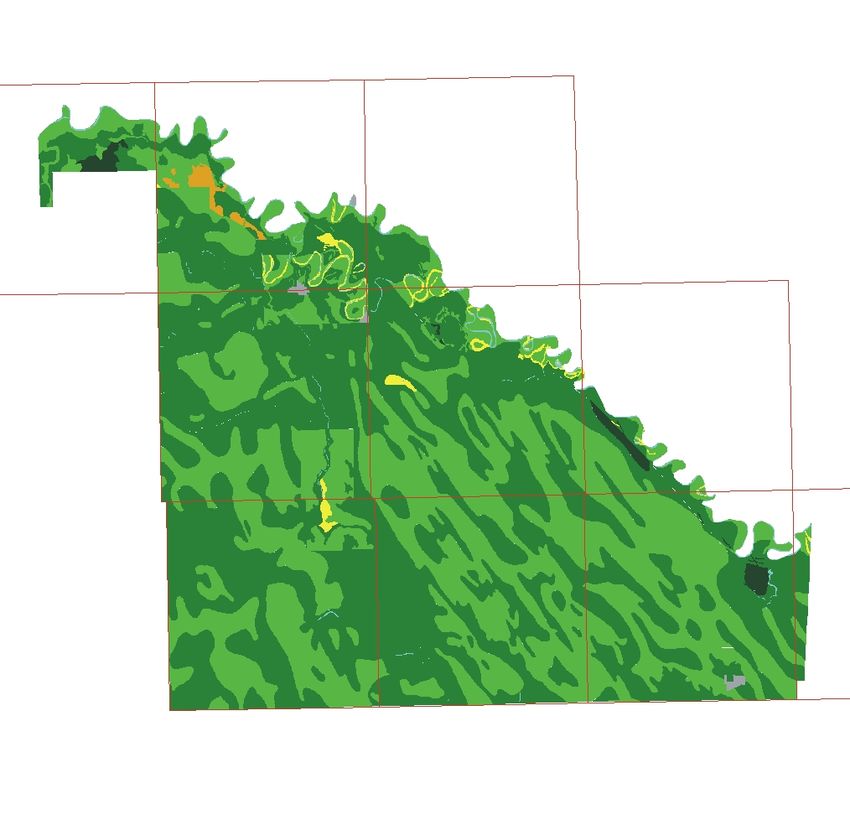
Rural Municipality of Cartier                                Information Bulletin 99-1                                                    Page 5

SOIL AND TERRAIN OVERVIEW                                                   surface ponding. In addition to this local network of drainage
                                                                            works, much of the length of the Assiniboine River has been diked
The Rural Municipality (RM) of Cartier covers an area of 56 287 ha          to protect the adjacent landscape from flooding during runoff
(approximately 6.1 townships) in southern Manitoba. It is located           events.
10 kilometres west of the City of Winnipeg along the south side of
the Assiniboine River (page 3). Elie is the largest population and          Soil materials in the Red River Valley were deposited during the
service centre in the municipality with smaller concentrations of           time of glacial Lake Agassiz and consist primarily of deep, clayey
people living in St. Eustache, Springstein and Dacotah.                     lacustrine sediments. Variable textured, stratified alluvial deposits
                                                                            occur in the floodplain adjacent to the Assiniboine River. Surface
The climate in the municipality can be related to weather data from         texture in the municipality is dominantly clayey (page 11).
Winnipeg International Airport to the east and Portage la Prairie to
the west. The mean annual temperature varies from 2.8 /C in the             Soils in the municipality have been mapped at a reconnaissance
northwestern part of the area to 2.4/C throughout the central and           level (1:126 720 scale) and published in the soil survey report for
eastern portions. The mean annual precipitation varies from 525 mm          the Winnipeg and Morris map sheet areas (Ehrlich et al., 1953).
in the west to 504 mm in the east (Environment Canada, 1993). The           Detailed soil studies at a 1:20 000 scale are available around Elie
average frost-free period decreases from 126 days in the west to 118        and for selected areas adjacent to the Assiniboine River (Michalyna
days in the east and average degree-days above 5/C accumulated              and Smith, 1972; Michalyna et al., 1975) and for the villages of St.
from May to September vary from 1693 to 1697 (Ash, 1991). An                Eustache and Springstein (Podolsky, 1989). According to the
evaluation of growing conditions in this region of Manitoba can be          Canadian System of Soil Classification (Soil Classification Working
related to estimates of seasonal moisture deficit and effective             Group, 1998), the soils are classified as dominantly Black
growing degree-days (EGDD) above 5/C. The seasonal moisture                 Chernozems and Humic Gleysols of the Red River association. The
deficit calculated between May and September is slightly less than          St. Norbert clay soils, also within the Red River association, have
250 mm and the estimated effective growing degree-days                      developed under wooded vegetation along the Assiniboine River
accumulated from May to September average slightly above 1600               and are classified as Chernozemic Dark Gray soils. Regosolic soils
(Agronomic Interpretations Working Group, 1995).              These         of the Riverdale association occur adjacent to the channel
parameters provide an indication of moisture and heat energy                containing the Assiniboine River. An extensive area of Black
available for crop growth and are generally adequate to support a           Chernozem, Humic Gleysol and Regosol soils developed on alluvial
wide range of crops adapted to western Canada.                              deposits of the Oakville association occurs in the western part of the
                                                                            municipality (page 11). A more detailed and complete description
Physiographically, the RM of Cartier is located entirely in the Red         of the type, distribution and textural variability of soils in the
River Valley subsection of the Manitoba Plain (Canada-Manitoba              municipality is provided in the published soil surveys for the area.
Soil Survey, 1980). This portion of the valley is located south of the
Assiniboine River and is very flat with slopes less than 2 percent          The flat topography throughout the area and the high clay content
(page 9). Elevation of the land surface decreases gradually from            of the Red River Valley soils results in the majority of the
240 metres above sea level (m asl) in the west to about 235 m asl in        municipality being classified as imperfectly to poorly drained (page
the east. The low surface gradient (less than 0.1 m/km or 0.8 ft/mi)        13).
results in very slow surface drainage, mainly to the La Salle River
and its tributaries in the south and west and to the Assiniboine River      Management considerations are primarily related to heavy clay
in the north and east. The natural drainage throughout the                  textures and wetness (page 15). There are no significant relief
municipality is not well developed so a network of man-made drains          features to contend with although minor areas of weak salinity occur
has been constructed to enhance runoff and reduce the duration of           at scattered locations, mainly in poorly drained soils throughout the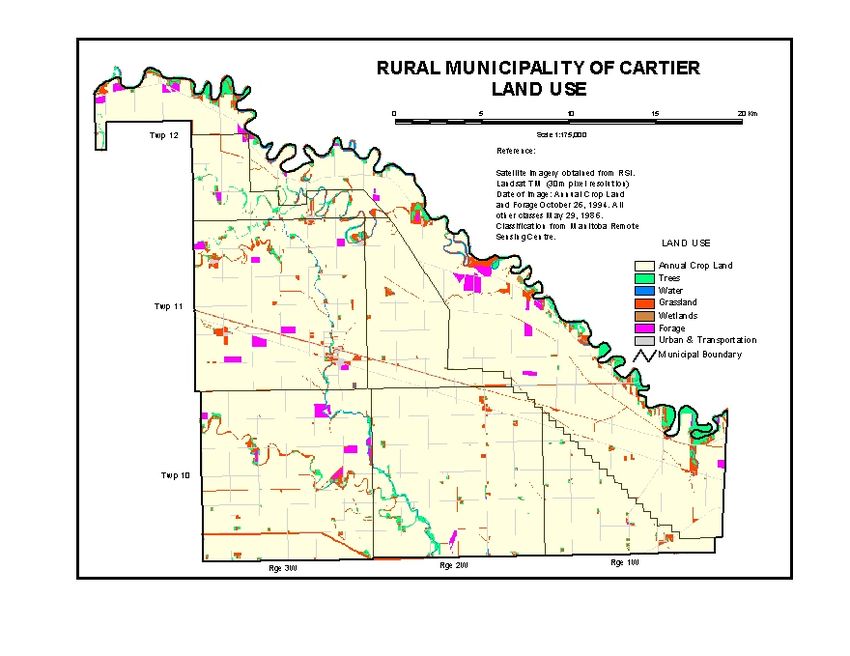
Page 6                                                        Information Bulletin 99-1                            Rural Municipality of Cartier

municipality. Less obvious subsoil salinity is common at depths              and the Assiniboine Rivers. Management practices focus primarily
below 50 cm. There are no significant relief or stoniness conditions         on maintaining adequate crop residues to provide sufficient surface
although poorly drained areas are subject to periodic flooding               cover.
during spring runoff.
                                                                             Land use in the RM of Cartier is primarily agricultural. An
Most of the soils in the municipality are rated in Class 2 (53               assessment of the status of land use in 1995 was obtained through
percent) and Class 3 (44 percent) for agricultural capability with           an analysis of satellite imagery. It showed that annual crops
moderate to moderately severe limitations for agriculture (page 17).         occupied 86 percent of the land in the RM with forage production
The majority of the soils are rated as Poor for irrigation suitability,      taking place on 1 percent of the area. Small areas of grassland,
primarily due to fine texture and poor drainage. About 19 percent            usually associated with farmsteads and major drainage channels
of the area, mainly the alluvial soils along the Assiniboine River and       occupy 4 percent of the area. Treed areas, mainly along the
its tributaries are rated as Fair for irrigation suitability (page 19).      Assiniboine and La Salle Rivers and in shelter belts associated with
The major problem limiting the agricultural use of soils is                  farmsteads, cover about 3 percent of the area. Various non-
inadequate drainage. Unfavourable workability and potential                  agricultural uses such as infrastructure for urban areas,
degradation due to erosion by wind are other important limitations.          transportation and recreation occupy about 4 percent of the
                                                                             municipality (page 27).
One of the issues currently receiving considerable attention is the
sustainability of agricultural practices and their potential impact on       While the majority of soils in the RM of Cartier have moderate to
the soil and groundwater environment. To assist in highlighting this         moderately severe limitations for arable agriculture, the clayey
concern to land planners and agricultural producers, an assessment           textured soils require management practices which maintain
of potential environmental impact (EI) under irrigation has been             adequate surface drainage, soil structure and tilth. The level
included in this bulletin (page 21). As shown, the majority of the           topography and slow to very slow permeability associated with
municipality is at Minimal risk of degradation due mainly to the             these heavy clay soils often result in drainage problems which
heavy texture of the soil and slow internal drainage. These                  adversely affect crop growth.
conditions reduce the risk for deep leaching of potential
contaminants on the soil surface. The alluvial soils, however are            These soils are frequently saturated and subject to surface ponding
stratified with coarser textured soil layers resulting in a slightly         and slow runoff, particularly during spring snowmelt or following
increased risk of leaching and are considered to have a Low risk of          heavy rains. Improvement and maintenance of water management
degradation. This EI map is intended to be used in association with          infrastructure on a watershed or regional basis is required to reduce
the irrigation suitability map.                                              surface ponding while maintaining adequate soil moisture for crop
                                                                             growth. All soils require careful management to protect against the
Another issue of concern to producers, soil conservationists and             risk of wind erosion. This includes leaving adequate crop residues
land use specialists is soil erosion caused by agricultural cropping         on the surface to provide sufficient trash cover during the early
and tillage practices. Areas with potential for water erosion and            spring period. The provision of shelter belts, minimum tillage
where special practices should be adopted to mitigate this risk are          practices, and crop rotations including forages will help to reduce
shown on page 23. The risk for degradation due to water erosion is           the risk of soil degradation and maintain productivity.
Negligible for 40 percent of the land in the municipality due to very
flat topography, clayey texture and poor drainage. About 55 percent
of the soils with clayey texture and imperfect drainage are
considered to have a Low risk for water erosion. A Moderate risk
occurs along small tributary streams associated with the La Salle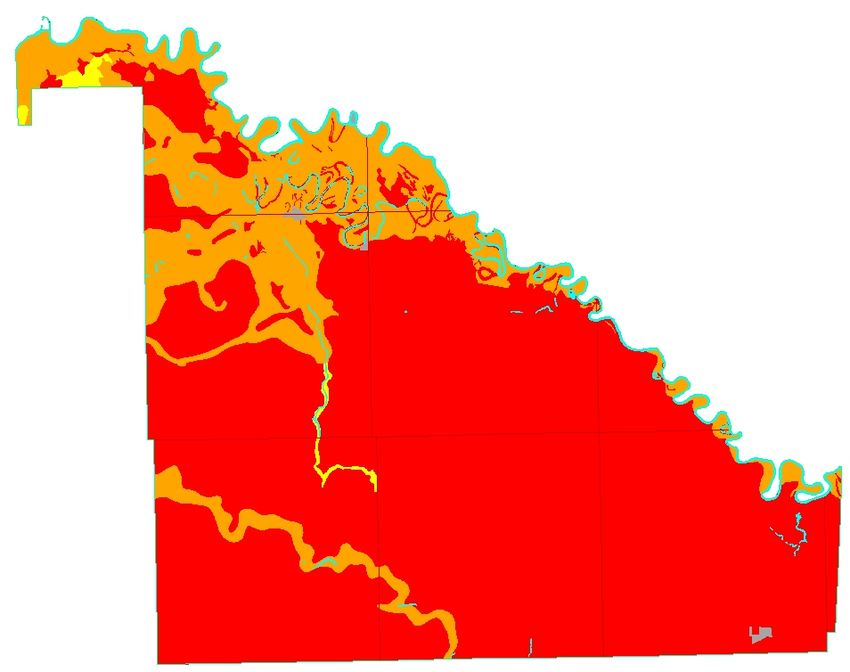
Rural Municipality of Cartier                                 Information Bulletin 99-1                                                  Page 7

DERIVED AND INTERPRETIVE MAPS                                                Digital databases derived from recent detailed soil inventories
                                                                             contain additional detailed information about significant inclusions
A large variety of computer derived and interpretive maps can be             of differing soil and slope conditions in each map polygon. This
generated from the digital soil and landscape databases. These               information can be portrayed at larger map scale than shown in this
maps are based on selected combinations of database values and               bulletin.
assumptions.
                                                                             Information concerning particular interpretive maps, and the
Derived maps show information that is given in one or more                   primary soil and terrain map data, can be obtained by contacting the
columns in the computer map legend (such as soil drainage or slope           Manitoba Soil Resource Section of Manitoba Agriculture, the local
class).                                                                      PFRA office, or the Land Resource Unit.

Interpretive maps portray more complex land evaluations based on
a combination of soil and landscape information. Interpretations are
based on soil and landscape conditions in each polygon.
Interpretative maps typically show land capabilities, suitabilities, or
risks related to sustainability.

Several examples of derived and interpretive maps are included in
this information bulletin:

        Derived Maps
        Slope
        Generalized Soil
        Drainage
        Management Considerations

        Interpretative Maps
        Agricultural Capability
        Irrigation Suitability
        Potential Environmental Impact
        Water Erosion Risk
        Land Use

The maps have all been reduced in size and generalized (simplified)
in order to portray conditions for an entire rural municipality on one
page. These generalized maps provide a useful overview of
conditions within a municipality, but are not intended to apply to
site specific land parcels. On-site evaluations are recommended for
localized site specific land use suitability requirements.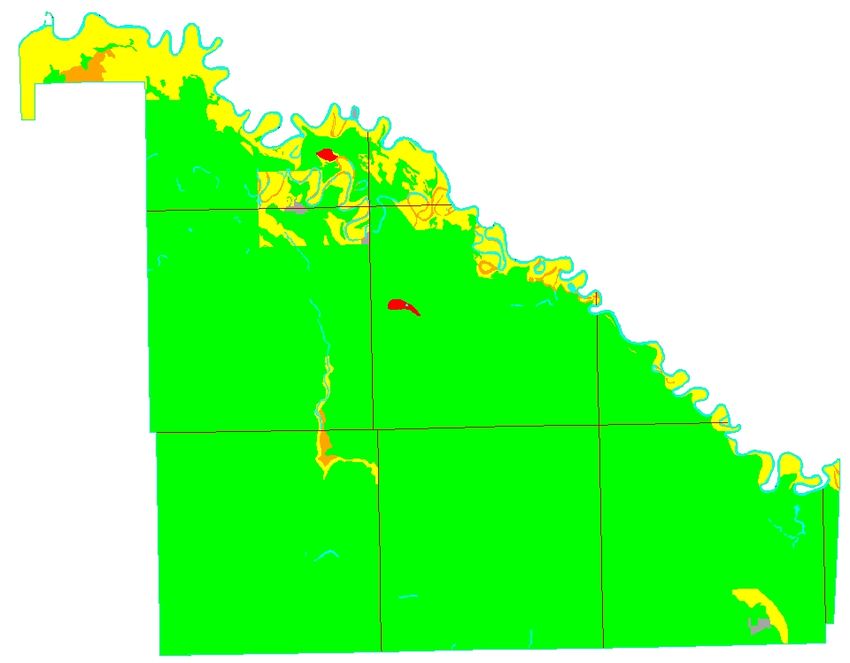
Page 8                                                    Information Bulletin 99-1                                    Rural Municipality of Cartier

Slope Map.                                                               Table 1. Slope Classes1

Slope describes the steepness of the landscape surface. The slope        Slope Class                                         Area                Percent
classes shown on this map are derived from the digital soil and                                                               (ha)                of RM
terrain layer database. Specific colours are used to indicate the
dominant slope class for each polygon in the RM. Additional slope        0-2%                                               55416                     98.5
classes may occur in each polygon area, but cannot be portrayed at
this reduced map scale.                                                  2-5%                                                     0                    0.0

                                                                         5-9%                                                     0                    0.0

                                                                         9 - 15 %                                                 0                    0.0

                                                                         15 - 30 %                                                0                    0.0

                                                                         > 30 %                                                   0                    0.0

                                                                         Unclassified                                          106                     0.2

                                                                         Water                                                 765                     1.4

                                                                         Total                                              56287                    100.0

                                                                         1
                                                                             Area has be en assigned to the dominant slop e in each soil po lygon.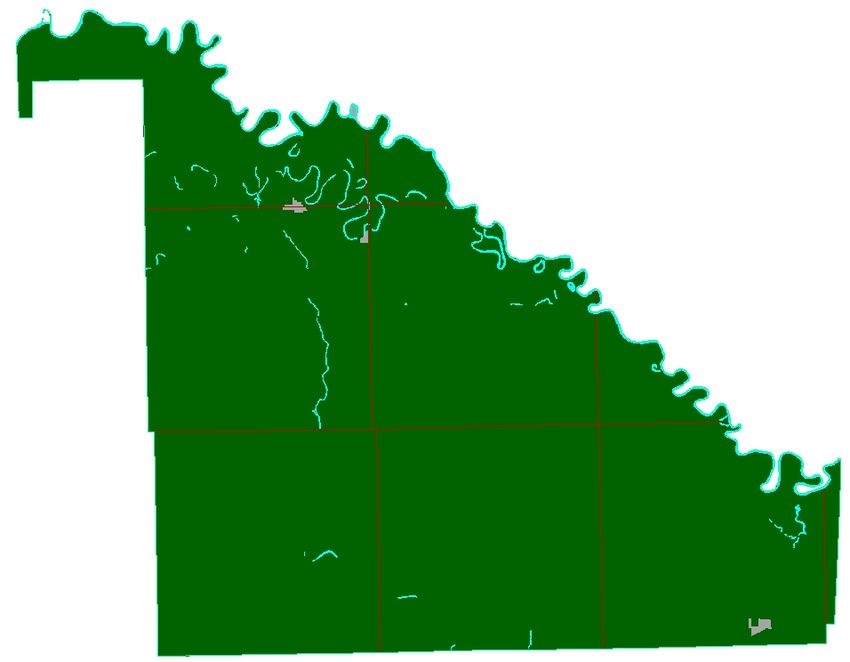
Rural Municipality of Cartier   Information Bulletin 99-1   Page 9

                                   Slope Map
Page 10 Information Bulletin 99-1 Rural Municipality of Cartier
Generalized Soil Map. Table 2. Generalized Soil Groups1
The most recently available soil maps were digitized to produce the Soil Groups Area Percent
new digital soil map. For older reconnaissance soil maps, areas of (ha) of RM
overprinted symbols or significant differences in topography have
been delineated as new polygons. All soil polygons have been Clayey Lacustrine 921 1.6
digitized and translated into modern soil series equivalents. (Luvisols and Dark Gray Chernozems)
The general soil groups provide a very simplified overview of the Variable Textured Alluvium (Gleysols) 406 0.7
soil information contained in the digital soil map. The hundreds of
individual soil polygons have been simplified into broad groups of Clayey Lacustrine (Gleysols) 21737 38.6
soils with similar parent material origins, textures, and drainage
classes. The dominant soil in each polygon determines the soil Clayey Lacustrine (Black Chernozems) 29142 51.8
group, area, and colour for the generalized soil map. Gleysolic soils
groups have poor to very poor drainage, while other mineral soil Loamy Lacustrine 164 0.3
groups typically have a range of rapid, well, or imperfectly drained
soils. Variable Textured Alluvium (Regosols) 2965 5.3
More detailed maps showing the dominant and subdominant soils Sandy Lacustrine 32 0.1
in each polygon can also be produced at larger map scales.
Sand and Gravel 49 0.1
Water 765 1.4
Unclassified 106 0.2
Total 56287 100.0
1
Based on the dominant soil series for each soil polygon.Rural Municipality of Cartier Information Bulletin 99-1 Page 11
Generalized Soil MapPage 12 Information Bulletin 99-1 Rural Municipality of Cartier
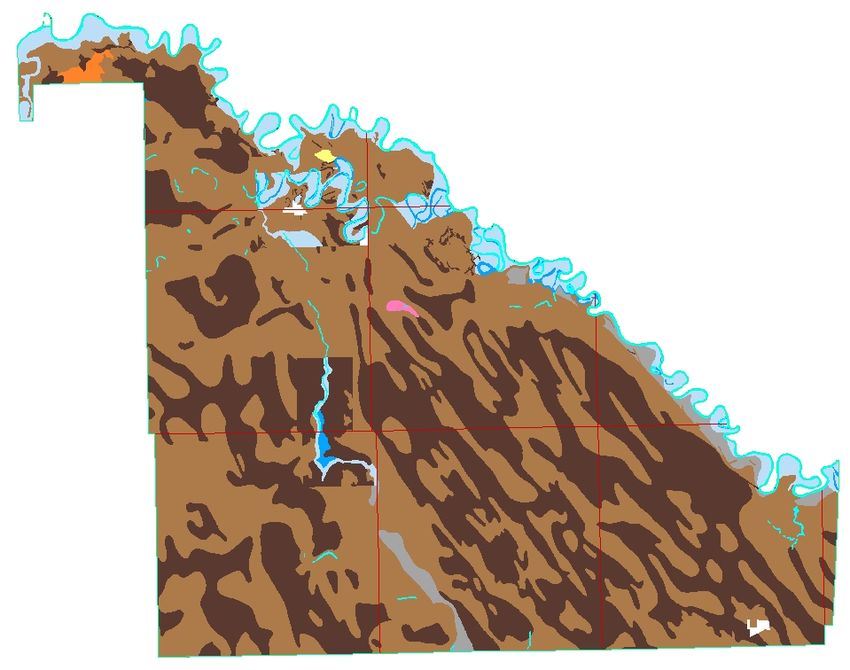
Soil Drainage Map. Table 3. Drainage Classes1
Drainage is described on the basis of actual moisture content in Drainage Class Area Percent
excess of field capacity, and the length of the saturation period (ha) of RM
within the plant root zone. Five drainage classes plus three land
classes are shown on this map. Very Poor 238 0.4
Very Poor - Water is removed from the soil so slowly that the water Poor 21905 38.9
table remains at or on the soil surface for the greater part of the time
the soil is not frozen. Excess water is present in the soil throughout Imperfect 31763 56.4
most of the year.
Well 1510 2.7
Poor - Water is removed so slowly in relation to supply that the soil
remains wet for a large part of the time the soil is not frozen. Rapid 0 0.0
Excess water is available within the soil for a large part of the time.
Marsh 0 0.0
Imperfect - Water is removed from the soil sufficiently slowly in
relation to supply to keep the soil wet for a significant part of the Unclassified 106 0.2
growing season. Excess water moves slowly down the profile if
precipitation is the major source. Water 765 1.4
Well - Water is removed from the soil readily but not rapidly. Total 56287 100.0
Excess water flows downward readily into underlying materials or
laterally as subsurface flow. 1
Area has been assigned to the dominant drainage class for each soil polygon.
Rapid - Water is removed from the soil rapidly in relation to supply.
Excess water flows downward if underlying material is pervious.
Subsurface flow may occur on steep slopes during heavy rainfall.
Drainage classification is based on the dominant soil series within
each individual soil polygon.Rural Municipality of Cartier Information Bulletin 99-1 Page 13
Soil Drainage MapPage 14 Information Bulletin 99-1 Rural Municipality of Cartier
Management Considerations Map. W = Wetness - soil landscapes that have poorly drained soils and/or
>50 % wetlands (due to seasonal and annual flooding, surface
Management consideration maps are provided to focus on awareness ponding, permanent water bodies (sloughs), and/or high water tables),
of land resource characteristics important to land use. This map does require special management practices to mitigate adverse impact on
not presume a specific land use. Rather it portrays the most common water quality, protect subsurface aquifers, and sustain crop production
and wide spread attributes that apply to most soil landscapes in the during periods of high risk of water logging.
province.
O = Organic - soil landscapes with organic soils, requiring special
These maps highlight attributes of soil-landscapes that the land management considerations of drainage, tillage, and cropping to
manager must consider for any intended land use. sustain productivity and minimize subsidence and erosion.
- Fine texture R = Bedrock - soil landscapes that have shallow depth to bedrock (<
- Medium texture 50 cm) and/or exposed bedrock which may prevent the use of some or
- Coarse texture all tillage practices as well as the range of potential crops. They
- Topography require special cropping and management practices to sustain
- Wetness agricultural production.
- Organic
- Bedrock Table 4. Management Considerations1
F = Fine texture - soil landscapes with fine textured soils (clays and Land Resource Characteristics Area Percent
silty clays), and thus low infiltration and internal permeability rates. (ha) of RM
These require special considerations to mitigate surface ponding (water
logging), runoff, and trafficability. Timing and type of tillage practices Fine Texture 30063 53.4
used may be restricted. Fine Texture and Wetness 21739 38.6
Fine Texture and Topography 0 0.0
M = Medium texture - soil landscapes with medium to moderately Medium Texture 3129 5.6
fine textures (loams to clay loams), and good water and nutrient Coarse Texture 82 0.1
retention properties. Good management and cropping practices are Coarse Texture and Wetness 0 0.0
required to minimize leaching and the risk of erosion. Coarse Texture and Topography 0 0.0
Topography 0 0.0
C = Coarse texture - soil landscapes with coarse to very coarse Bedrock 0 0.0
textured soils (loamy sands, sands and gravels), have a high Wetness 404 0.7
permeability throughout the profile, and require special management Organic 0 0.0
practices related to application of agricultural chemicals, animal Marsh 0 0.0
wastes, and municipal effluent to protect and sustain the long term Unclassified 106 0.2
quality of the soil and water resources. The risk of soil erosion can be Water 765 1.4
minimized through the use of shelterbelts and maintenance of crop Total 56287 100.0
residues.
1
Based on the dominant soil series and slope gradient within each polygon.
T = Topography - soil landscapes with slopes greater than 5 % are
steep enough to require special management practices to minimize the
risk of erosion.Rural Municipality of Cartier Information Bulletin 99-1 Page 15
Management Considerations MapPage 16 Information Bulletin 99-1 Rural Municipality of Cartier
Agricultural Capability Map. Table 5. Agricultural Capability1
This evaluation utilizes the 7 class Canada Land Inventory system Class Area Percent
(CLI, 1965). Classes 1 to 3 represent the prime agricultural land, Subclass (ha) of RM
class 4 land is marginal for sustained cultivation, class 5 land is
capable of perennial forages and improvement is feasible, class 6 1 484 0.9
land is capable of producing native forages and pasture but
improvement is not feasible, and class 7 land is considered 2 29817 53.3
unsuitable for dryland agriculture. Subclass modifers include 2D 911 1.6
structure and/or permeability (D), erosion (E), inundation (I), 2I 192 0.3
moisture limitation (M), salinity (N), stoniness (P), consolidated 2W 28715 51.4
bedrock (R), topography (T), excess water (W) and cumulative
minor adverse characteristics (X). 3 24335 43.5
3I 2778 5.0
This generalized interpretive map is based on the dominant soil 3N 76 0.1
series and phases for each soil polygon. The CLI subclass 3NW 613 1.1
limitations cannot be portrayed at this generalized map scale. 3W 20868 37.3
5 494 0.9
5M 82 0.1
5W 7 0.0
5WI 405 0.7
6 237 0.4
6W 237 0.4
Unclassified 106 0.2
Water 446 0.8
Total 55919 100.0
1
Based on the dominant soil series and slop e grad ient within each polygon.Rural Municipality of Cartier Information Bulletin 99-1 Page 17
Agriculture Capability MapPage 18 Information Bulletin 99-1 Rural Municipality of Cartier
Irrigation Suitability Map. Table 6. Irrigation Suitability1
Irrigation ratings are based on an assessment of the most limiting Class Area Percent
combination of soil and landscape conditions. Soils in the same (ha) of RM
class have a similar relative suitability or degree of limitation for
irrigation use, although the specific limiting factors may differ. Excellent 0 0.0
These limiting factors are described by subclass symbols at detailed
map scales. The irrigation rating system does not consider water Good 354 0.6
availability, method of application, water quality, or economics of
irrigated land use. Fair 10857 19.3
Irrigation suitability is a four class rating system. Areas with no or Poor 44205 78.5
slight soil and/or landscape limitations are rated Excellent to Good
and can be considered irrigable. Areas with moderate soil and/or Organic 0 0.0
landscape limitations are rated as Fair and considered marginal for
irrigation providing adequate management exists so that the soil and Unclassified 106 0.2
adjacent areas are not adversely affected by water application. Soil
and landscape areas rated as Poor have severe limitations for Water 765 1.4
irrigation.
Total 56287 100.0
This generalized interpretive map is based on the dominant soil
series for each soil polygon, in combination with the dominant slope 1
Based on the dominant soil series and slope gradient within each polygon.
class. The nature of the subclass limitations and the classification of
subdominant components is not shown at this generalized map
scale.Rural Municipality of Cartier Information Bulletin 99-1 Page 19
Irrigation Suitability MapPage 20 Information Bulletin 99-1 Rural Municipality of Cartier
Potential Environmental Impact Under Irrigation Map. Table 7. Potential Environmental Impact Under Irrigation1
A major environmental concern for land under irrigated crop Class Area Percent
production is the possibility that surface and/or ground water may (ha) of RM
be impacted. The potential environmental impact assessment
provides a relative rating of land into 4 classes (minimal, low, Minimal 49603 88.1
moderate and high) based on an evaluation of specific soil factors
and landscape conditions that determine the impact potential. Low 5163 9.2
Soil factors considered are those properties that determine water Moderate 568 1.0
retention and movement through the soil; topographic features are
those that affect runoff and redistribution of moisture in the High 82 0.1
landscape. Several factors are specifically considered: soil texture,
hydraulic conductivity, salinity, geological uniformity, depth to Organic 0 0.0
water table and topography. The risk of altering surface and
subsurface soil drainage regimes, soil salinity, potential for runoff, Unclassified 106 0.2
erosion and flooding is determined by specific criteria for each
property. Water 765 1.4
Use of this rating is intended to serve as a warning of potential Total 56287 100.0
environmental concern. It may be possible to design and/or give
special consideration to soil-water-crop management practices that 1
Based on the dominant soil series and slope gradient within each polygon.
will mitigate any adverse impact.
This generalized interpretive map is based on the dominant soil
series and slope class for each soil polygon. The nature of the
subclass limitations, and the classification of subdominant
components is not shown at this generalized map scale.Rural Municipality of Cartier Information Bulletin 99-1 Page 21
Potential Environmental Impact Under IrrigationPage 22 Information Bulletin 99-1 Rural Municipality of Cartier
Water Erosion Risk Map. Table 8. Water Erosion Risk 1
The risk of water erosion was estimated using the universal soil loss Class Area Percent
equation (USLE) developed by Wischmeier and Smith (1965). The (ha) of RM
USLE predicted soil loss (tons/hectare/year) is calculated for each
soil component in each soil map polygon. Erosion risk classes are Negligible 22466 39.9
assigned based on the weighted average soil loss for each map
polygon. Water erosion risk factors include mean annual rainfall, Low 30851 54.8
slope length, slope gradient, vegetation cover, management
practices, and soil erodibility. The map shows 5 classes of soil Moderate 2099 3.7
erosion risk based on bare unprotected soil:
High 0 0.0
negligible
low Severe 0 0.0
moderate
high Unclassified 106 0.2
severe
Water 765 1.4
Cropping and residue management practices will significantly
reduce this risk depending on crop rotation program, soil type, and Total 56287 100.0
landscape features.
1
Based on the weighted average USLE predicted soil loss within each
polygon, assuming a bare unprotected soil.Rural Municipality of Cartier Information Bulletin 99-1 Page 23
Water Erosion Risk MapPage 24 Information Bulletin 99-1 Rural Municipality of Cartier
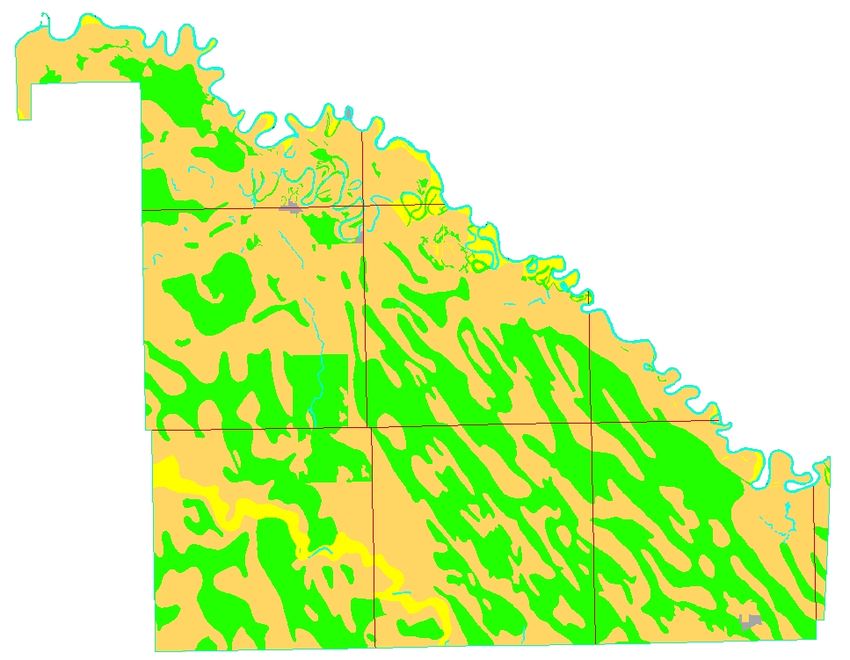
Land Use Map. Table 9. Land Use 1
The land use classification of the RM has been interpreted from Class Area Percent
LANDSAT satellite imagery, using supervised computer (ha) of RM
classification techniques. Many individual spectral signatures were
classified and grouped into the seven general land use classes shown Annual Crop Land 49198 86.2
here. Although land use changes over time, and some land use
practices on individual parcels may occasionally result in similar Forage 758 1.3
spectral signatures, this map provides a general representation of the
current land use in the RM. Grasslands 2266 4.0
Trees 1726 3.0
The following is a brief description of the land use classes:
Wetlands 30 0.1
Annual Crop Land - land that is normally cultivated on an annual
basis. Water 836 1.5
Forage - perennial forages, generally alfalfa or clover with blends Urban and transportation 2253 3.9
of tame grasses.
Total 57067 100.0
Grasslands - areas of native or tame grasses, may contain scattered
stands of shrubs. 1
Land use information (1995) and map sup plied by Prairie Farm
Rehabilitation Administration. Areas m ay vary from previous map s due to
Trees - lands that are primarily in tree cover. differences in analytical proce dures.
Wetlands - areas that are wet, often with sedges, cattails, and
rushes.
Water - open water - lakes, rivers streams, ponds, and lagoons.
Urban and Transportation - towns, roads, railways, quarries.Rural Municipality of Cartier Information Bulletin 99-1 Page 25
Page 26                                                    Information Bulletin 99-1                           Rural Municipality of Cartier

REFERENCES

Agronomic Interpretations Working Group. 1995. Land Suitability           Irrigation Suitability Classification Working Group. 1987. An
Rating System for Agricultural Crops: 1. Spring-seeded Small              Irrigation Suitability Classification System for the Canadian
Grains. Edited by W.W. Pettapiece. Tech. Bull. 1995-6E. Centre            Prairies. LRRC contribution no. 87-83, Land Resource Research
for Land and Biological Resources Research, Agriculture and Agri-         Centre, Research Branch, Agriculture Canada, Ottawa
Food Canada, Ottawa. 90 pages, 2 maps.
                                                                          Land Resource Unit. 1999. Soil and Terrain Classification System
Ash, G.H.B. 1991. An Agroclimatic Risk Assessment of Southern             Manual. In preparation. Ellis Bldg. University of Manitoba.
Manitoba and Southeastern Saskatchewan. M.A. Thesis.                      Winnipeg.
Department of Geography, University of Manitoba, Winnipeg.
                                                                          MacDonald, K.B., and Valentine, K.W.G. 1992. CanSIS Manual 1
Canada Land Inventory. 1965. Soil Capability Classification for           CanSIS/NSDB: A General Description. Land Resource Division,
Agriculture. Canada Land Inventory Report No. 2. ARDA, Dept.              Centre for Land and Biological Resources Research, Research
of Forestry, Canada, Ottawa.                                              Branch, Agriculture Canada, Ottawa.

Canada-Manitoba Soil Survey. 1980. Physiographic Regions of               Michalyna, W., Smith, R. E., 1972. Soils of the Portage La Prairie
Manitoba. Ellis Bldg., University of Manitoba, Winnipeg. Revised.         Area. Report 17. Manitoba Soil Survey. Winnipeg.
Unpublished Report.
                                                                          Michalyna, W., Gardiner, Wm. and Podolsky, G. 1975. Soils of the
Canada-Manitoba Soil Survey. 1979. Ecological Regions and                 Winnipeg Region Study Area. Report D14. Canada-Manitoba Soil
Subregions in Manitoba. Ellis Bldg., University of Manitoba,              Survey. Winnipeg.
Winnipeg. Revised. Unpublished Report.
                                                                          Podolsky, G. 1989. Soils of the St. Eustache, Springfield, Brunkild,
Ehrlich, W.A., Poyser, E.A. Pratt, L.E. and Ellis, J. H. 1953 Report      Southwest Perimeter and La Salle River Areas. Report D67.
of Reconnaissance Soil Survey of Winnipeg and Morris Map Sheet            Canada-Manitoba Soil Survey. Winnipeg.
Areas. Soils Report No. 5. Manitoba Soil Survey. Published by
Manitoba Dept. of Agriculture. 111pp and 2 maps.                          Soil Classification Working Group. 1998. The Canadian System of
                                                                          Soil Classification. Third Edition. Publ. No. 1646. Research
Environment Canada. 1982. Canadian Climatic Normals 1951-1980.            Branch, Agriculture and Agri-Food Canada.
Frost, Vol. 6; Atmospheric Environment, Downsview, Ontario.
                                                                          Wischmeier, W.H. and Smith, D.D. 1965. Predicting Rainfall-
Environment Canada. 1993. Canadian Climatic Normals 1961-1990.            erosion Loss from Cropland East of the Rocky Mountains. U.S.
Prairie Provinces. Atmospheric Environment, Downsview, Ontario.           Department of Agriculture, Agriculture Handbook No. 282, U.S.
                                                                          Government Printing Office, Washington, D.C.
You can also read