FULL YEAR RESULTS PRESENTATION - TO 30 NOV 2020 - St. Modwen
←
→
Page content transcription
If your browser does not render page correctly, please read the page content below
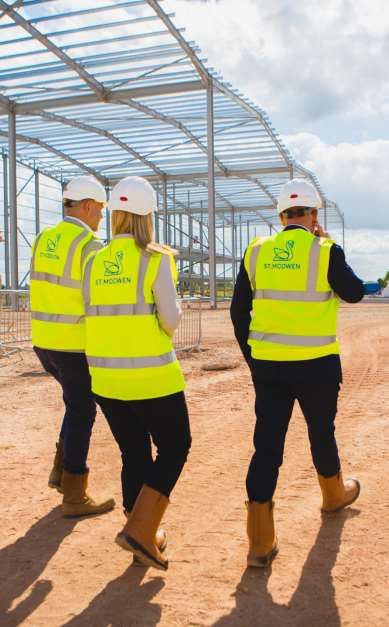
FULL YEAR RESULTS
PRESENTATION
TO 30 NOV 2020

Well-positioned for growth in two attractive markets

                       OUR PURPOSE - CHANGING PLACES. CREATING BETTER FUTURES.

                                          78%
                                       (2019: 65%)

Logistics/housebuilding          Changing shape                    Growth potential                                Returns

                                                                   Platform and pipeline to              Aim to grow adj. EPRA EPS
                              78%(1) of portfolio in logistics
 Focus on two sectors with                                          grow to >£1bn logistics                   to c. 28p and total
                              & housebuilding, heading to
  strong structural growth                                         portfolio and delivery of                 accounting return to
                               >90% by 2023 (2019: 65%)
                                                                 c. 1,500 homes p.a. by 2023              c. 9-10% in medium term

                                                                           (1) 2020 Pro-Forma for SL&R disposals completing post the year-end
                                                                                                                                                2
Resilient operational performance despite Covid-19 disruption
St. Modwen
 Logistics

                                                  Completed 1.2m sq ft, 81% let or under offer
                                                                                                                              50%(1)
                                                  1.6m sq ft committed pipeline 27% let/under offer                           of portfolio
                                                                                                                            (2019: 40%)
                                                  Resilient income, with 97.9% of rent received

  Growing modern urban and big box portfolio
St. Modwen
   Homes

                                                  Sold 948 units, -11% YoY due to H1 build pause
                                                                                                                              28%(1)
                                                  FY margin of 12.4% post 2.4ppt recovery in H2                               of portfolio
                                                                                                                            (2019: 26%)
                                                  Order book +33%, covering 47% of 2021 sales

Scalable platform delivering high quality homes
Regeneration
Strat. Land &

                                                  Secured new capital-light strategic land deals
                                                                                                                              22%(1)
                                                  Sold £125m of non-core assets and land                                      of portfolio
                                                                                                                            (2019: 35%)
                                                  Valuations broadly stable in H2 after H1 fall

Land capability enabling growth in two sectors
                                                                                (1) 2020 Pro-Forma for SL&R disposals completing post the year-end
                                                                                                                                                     3
Improved performance in the second half of 2020

                                                                         Year to   HY to     Year to   Change
• Full year results impacted by Covid-19
                                                                         Nov-20    May-20    Nov-19      (YoY)

• Strong improvement in H2                 NAV per share (p)              427.7     423.1    484.2      (11.7%)

                                           EPRA NTA per share (p)         437.7    430.8     490.8      (10.8%)
• NAV up 1.1% since May
                                           See-through LTV (%)            20.2      28.1      19.6      0.6 ppt

• LTV down 7.9ppt since May                Total accounting return (%)    (11.4)    (12.6)     4.6     (16.0 ppt)

                                           Adjusted EPRA EPS (p)           9.9       2.1      17.4      (43.1%)
• H2 EPS recovered to 77% of prior year
                                           Dividend per share (p)          5.0       1.1       3.6      38.9%

                                                                                                                    4
Step up in logistics/housebuilding to drive increased returns
Clear strategic focus on logistics and housebuilding
• Two sectors with structural growth in demand but tight supply
• 78%(1) of portfolio, growing to over 90% by 2023
• Sold >£1bn of non-core assets in last 3.5 years & plan to sell a further c. £180-200m SL&R assets by 2023

St Modwen Logistics (50%(1) of portfolio): Well positioned to grow to >£1bn
• On track to deliver 1.5m sq ft in 2021, with 27% of committed pipeline pre-let or under offer
• Plan to accelerate delivery to up to 2m sq ft p.a. beyond 2021
• 19m sq ft pipeline with c. 7-8% yield on cost to drive substantial growth in recurring income

St. Modwen Homes (28%(1) of portfolio): Growing volumes and improving margins
• Affordable high-quality product, with private ASP of £277,000 and 96.2% HBF rating
• On track to grow completions by up to 25% in 2021 and over 50% by 2023 (c. 1,500 units)
• Clear plan to improve margin to c. 16-17% by 2023, with further improvement beyond that

Growing returns
• Significant headroom against LTV target of sub 30%
• Grow adj. EPRA EPS to c. 28p and deliver total accounting return of 9-10% in medium term

                                                                        (1) 2020 Pro-Forma for disposals completing post the year-end
                                                                                                                                        5
Operational
review
ST. MODWEN LOGISTICS

Structural growth trends in logistics accelerating
• Structural growth in online retail dramatically                          Structural change continues to drive demand
                                                                          (m sq ft big box take-up (LHS) vs online sales (RHS)              Savills/ONS)
  increased due to Covid-19
                                                                          50                                                                              40%

                                                                          40
• Availability of Grade A big box space down from                                                                                                         30%

  c. 10 to c. 6 months of 5Y average take-up                              30
                                                                                                                                                          20%
                                                                          20
• Development returns continue to offer high                                                                                                              10%
                                                                          10
  spread vs investment yields and interest rates
                                                                           0                                                                              0%
                                                                               07    08 09   10     11   12   13   14    15    16   17     18   19   20
                                                                                      New    Second-hand                Online share of retail sales

       Development provides attractive margin                              Availability of modern space down 34% YoY
  (SMP yield on cost vs MSCI UK All industrial yield and gilts in %)             (availability >100k sq ft by grade in m sq ft - Savills)

 10                                                                       40                                                                             YoY
                                                                                                                                                        change
  8
                                                                          30                                                                              +22%
  6
                                                                          20
                                                                                                                                                          +16%
  4
                                                                          10
  2                                                                                                                                                       -34%
                                                                           0
  0
                                                                                    1Q16     1Q17         1Q18          1Q19        1Q20         1Q21
      01 02 03 04 05 06 07 08 09 10 11 12 13 14 15 16 17 18 19 20
                                                                                              Grade A         Grade B         Grade C
            UK industrial yield    10Y Gilt        Yield on cost
                                                                                                                                                                 7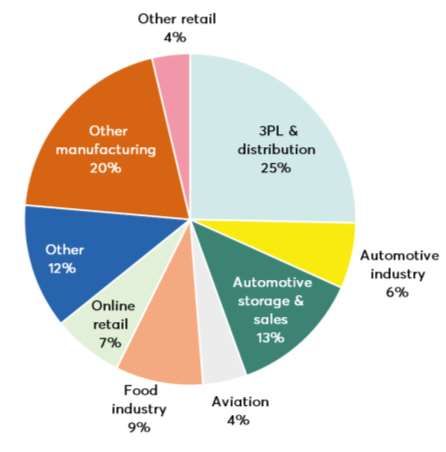
ST. MODWEN LOGISTICS

£666m portfolio, of which £561m income-producing (+28% YoY)

         Urban (54%)                Big box (25%)                              Other (21%)

▪ Assets of
ST. MODWEN LOGISTICS
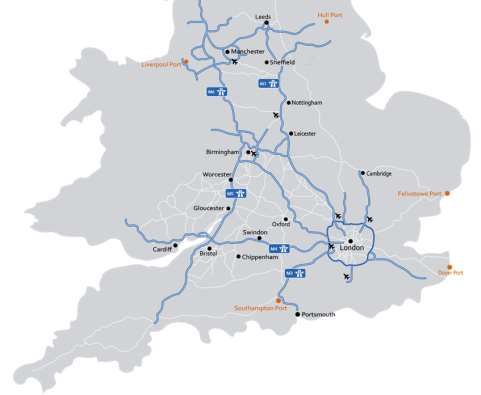
19m sq ft pipeline near key logistics corridors and conurbations
De-risking growth in development via pre-lets Growing urban and big box warehouse space
(m sq ft committed pipeline) (committed pipeline by # of units / x1,000 sq ft total space)
1.6
1.2 13
0.9 413 436
10
2019 2020 Committed
706
Speculative Pre-let
3
< 50k sq ft 50 - 100k sq ft 100 - 300k sq ft
£130m potential future income from development
(estimated key metrics total development pipeline)
Committed Consented Controlled Total
Size (m sq ft) 1.6 6.0 c. 12 c. 19
Potential ERV (£m) 11.5 38.8 c. 80 c. 130
Future capex (£m) 128 425 - 475
Total dev. cost (£m) 155 475 525
Current book value (£m) 27 50 7 84
Yield on cost (%) 7.5 c. 7-8
Committed projects Yield on capex (%) 8.4 c. 9
Potential delivery 0-18 mths 1-5 yrs 5-10 yrs 0-10 yrs
9
ST. MODWEN LOGISTICS

Continuing to grow recurring income stream
• Invested £89m in growing logistics portfolio                  Strong momentum in development leasing
                                                                                     (completed ERV in £m)
                                                              12
• WAULT up from 4.6 to 6.4 years due to asset                 10
  management and new developments                              8
                                                               6
     • 7.4 years including deals since year-end
                                                               4
                                                               2

• L-f-l income existing portfolio up 6.1%                      0
                                                                       2017        2018        2019        2020    Committed
                                                                    completions completions completions completions pipeline

• 81% of 2020 completions let or under offer, up                     Let at period end     Let since       Under offer          Available

  from 58% of 2019 pipeline this time last year
     • 7.3% yield on cost when fully let                             Significant upside to logistics income
                                                           (potential rent, excl. c. £80m related to space subject to planning; £m)

                                                              100
• Committed pipeline 27% pre-let or under offer, up
  from 18% of 2020 pipeline this time last year               80

                                                                                    Available - £4.8m                     38.8
                                                              60                    Under offer - £0.8m
• Lettings in 2020 on average slightly above ERV                                    Let since YE- £2.7m

                                                                                                                                      87.9
                                                               40

• Clear visibility to significantly grow recurring             20
                                                                                   8.9                    Available - £8.3m

  income via profitable controlled pipeline                            20.4
                                                                                                          Under offer - £1.1m
                                                                                                          Pre-let- £2.2m

                                                                0
                                                                    Passing rent Rent free Available to Committed Consented          Total
                                                                                            let at YE    pipeline  pipeline         potential
                                                                                                                                                10
ST. MODWEN HOMES
Housing demand remains strong
Mortgage affordability is attractive
• Long term population growth continues to drive (mortgage payments as % of disposable income Halifax/ONS)
demand for more new homes 70
60
50
• Annual production still well short of 300,000
homes Government target 40 Average
30
• Affordability remains attractive in historical 20
context, in particular in the regions 10
0
84 86 88 90 92 94 96 98 00 02 04 06 08 10 12 14 16 18 20
UK housing delivery well short of target Mortgage lending remains very supportive
(net additional dwellings delivered in years to March, 000 - ONS) (mortgage approvals for new house purchases, 000 - BOE)
140
300 300,000 Government target
120
250
100
200
80
150
60
100 40
50 20
0 0
01 02 03 04 05 06 07 08 09 10 11 12 13 14 15 16 17 18 19 20 21E 93 95 97 99 01 03 05 07 09 11 13 15 17 19
11ST. MODWEN HOMES
Focus on quality and affordable regions adds resilience
Growing diversification in customer mix Focus on affordable price levels
(Total units sold) (private ASP, £000)
848 1,060 948
282
277 275
273
26% 26% 22%
47%
55% 54% 2018 2019 2020 2021 E
9%
3% 6% 5% 2%
1%
16% 13% 16%
2018 2019 2020
Affordable Shared ownership Investor PX HtB Other private
Focus on regions with good affordability
(Total units sold)
Wales
South
7%
West
9%
South East
Midlands
8%
40%
948
units
South
15%
Active sales outlets
North
21% Near-term openings
12ST. MODWEN HOMES
Differentiated positioning provides platform to build scale
74
Net promoter score
Consistently above wider sector
(2019: 76)
Differentiated height and light design Flexibility to adjust to changing needs 96.2%
HBF customer recommend score
2nd highest of all large UK housebuilders
(2019: 92.3%)
0.08
Accident frequency rate
20% of industry average
(2019: 0.04)
Focus on placemaking and green space Striving for zero defects
13ST. MODWEN HOMES
Strong orderbook underpins growth in volumes
• Completed 948 sales despite c. 9-10 weeks of lost 2020 2019
production due to lockdown in spring
Total units sold 948 1,060
Private units sold 800 920
• Like-for-like private ASP up 2.2%
Private sales rate 0.77 0.81
• Record private order book going into 2021 Private ASP (£k) 277 273
Affordable ASP (£k) 154 135
• Up to 25% volume growth in 2021, with pipeline
Pipeline (plots) 5,900 6,200
providing clear visibility on growth beyond that
Pipeline (years) 6.2 5.8
• Grow 0.7x asset turnover by shortening land bank
Recent trading performance
Clear visibility on future volume growth
(Total units sold)
c. 1,500
Sales active sites 24 21
1,060
948 Target private sales forward-sold (%) 47 34
848
694
485 Private order book (£m) 126 95
2016 2017 2018 2019 2020 2021 E 2022 E 2023 E
14ST. MODWEN HOMES
Clear strategy to deliver medium-term margin growth
• Operating margins down due to impact of first Target 16-17% operating margin by 2023
(%)
lockdown but improved to 13.1% in H2
• Margin expected to recover to c. 14.5% in 2021
16
-
14.8 17
14.4 14.5
• Target 16-17% operating margin by 2023, driven 13.9
12.4
by overhead and operational improvements
• Further growth beyond 2023 due to feeding land
bank through new acquisitions and transferring
strategic land at cost
Embedded margin to improve over time
(embedded gross margin in % vs site mix)
• Current land all originates from strategic land &
regeneration, with historical mark-to-market
Target
revaluations reducing margin by c. 300 bps >22%
c. 19.5%
• Embedded gross margin in current land bank to c. 20.5%
improve from c. 19.5% to c. 20.5% due to site mix
2021 2025
Current land bank New sites
• Shift towards new land with gross margin hurdle
of 22% to further improve margins
15STRATEGIC LAND & REGENERATION
Focusing our land activities on growth in logistics and homes
• Strong land repositioning track-record creates
▪ Secured option in 2014
clear competitive advantage in securing scarce
Active developments
▪ 500 homes; 0.4m sq ft logistics
new land opportunities ▪ Peak capital employed: £4m (1)
▪ Start development: 2019
▪ c. 60% IRR + enhanced margin
• Almost entire logistics and housebuilding land Copthorne, SE
bank originates from our strategic land and
regeneration capabilities ▪ Signed dev. agreement in 2017
Aerial ▪ 1,500 homes
▪ Peak capital employed: £1m (1)
• Land capability enables long-term value creation
picture ▪ Start development: 2018
▪ c. 20% IRR + enhanced margin
and enhances returns in logistics/housebuilding Wantage, SE
▪ Signed dev. agreement in 2021
• Release c. £180-200m of capital from existing ▪ Potential for 1,100 homes
New
assets which are non-core or surplus to our own ▪ Peak capital employed: £11m (1)
▪ Earliest start: 2024
development needs ▪ c. 20% IRR + enhanced margin
Cheltenham, SW
• Focus capability on supporting growth in logistics
Disposals
and housebuilding, with shorter delivery, clear ▪ £93m residential land
Picture ▪ £32m commercial/retail assets
return hurdles and lower capital employed ▪ 73% of these were in H2, in line
Leegate with May book value
(1) Until drawdown of first phase of land for development start
16STRATEGIC LAND & REGENERATION
Clear plan to release capital from existing portfolio
November 2020 value 2020 net rent
(£332m) (£10.1m)
£14m residential land in South Wales
Exchanged at Nov-20 £26m £12m other residential land 0.7m
Sold since Nov-20 £7m £7m non-core other
Earmarked for SMH c. £40m c. 850 plots across 6 sites 1.2m
FULL EXIT BY 2023
£86m non-core retail
Majority Trentham Gardens, rest three town-
centre shopping centres
£33m residual non-core other
Planned disposal Majority Longbridge offices, rest around a dozen 7.4m
c. £200m
small commercial assets/land
c. 40-60% EXIT BY 2023, REST POST 2023
£43m residential land in South Wales
£41m other residential land
c. 1,500 plots across 6 sites
c. £60m regeneration
Reviewing options c. £60m Majority Longbridge residential/employment 0.8m
land, rest mostly NCGM and Swansea
17Delivering on our responsible business ambitions
Net carbon Biodiversity & Diversity & Education & Health & Responsible
reduction sustainable inclusion future skills wellbeing operating
environments practices &
partnerships
Our ambition
Net biodiversity gain of Invest 1% of cash Enhance the wellbeing
Embed responsible
Be operationally net >10% associated with profits p.a. in education of our people & make a
To achieve the UK operating practices in
zero carbon by 2025 new development; partnerships & make a meaningful, positive
National Equality our supply chain in
and fully net zero cut SMH site waste by positive impact on over impact on the health
Standard (NES) by 2025 accordance with our
carbon by 2040 1/3rd & increase recycling 20,000 young people and wellbeing of the
Supply Chain Charter
rate to 99% by 2025 by 2025 communities we serve
30% reduction in carbon Reduced waste by 15% 46% line managers Apprenticeship Launched £150,000 Achieved ROSPA Gold
highlights
footprint vs 2019 on home building sites trained programmes in place Community Impact Fund health & safety awards
2020
Partnerships with Women Rolled out mental health for all 3 business units
Net zero carbon
Completed biodiversity D&I built into people into Construction, Ahead resilience training
roadmaps developed
net gain assessments policies and competency Partnership and Armed Reached 40 Mental Supply Chain Charter
21% of homes incl. MMC on 16 priority sites framework Forces Health first aiders developed
Example 2021
Ready for Future Homes Close identified gaps
Enhanced employee
Deliver >10% net gain against NES Quantify current
initiatives
Standards H&W programme
Test Passivhaus tech on 2021 developments impact Launch supply chain
Embed D&I in charter and set 3-5
60% of logistics BREEAM Community
Introduction of recruitment process Longer term plan to year targets
Excellent or Very Good engagement plan for
biodiversity code achieve desired targets
all major schemes
30% of homes incl. MMC Set D&I targets
18Financial review
Financial results started to recover from Covid-19 disruption
• Return to profit in H2                                                                   H1       H2      2020      2019

                                                                                          £m        £m       £m        £m

• Total accounting return (11.4)% due to reduction   Net rental & other income            14.5     16.7      31.2     40.1
  in residential land and retail values in H1        Housebuilding profit                 13.8     30.5      44.3     55.5
                                                     Development fee income               0.8       1.1       1.9      4.4

• Valuations up since May, resulting in positive     Business unit operating expenses     (8.0)    (11.1)   (19.1)    (21.7)
  total accounting return for H2                     Administrative expenses              (9.8)    (10.9)   (20.7)    (22.4)
                                                     Net interest costs                   (5.5)    (4.9)    (10.4)    (9.3)

• Reduction in rent due to non-core sales, credit    Tax and non-controlling interests    (1.1)    (4.0)     (5.1)    (7.9)
  provision and temporary closure of retail assets   Adjusted EPRA earnings               4.7      17.4      22.1     38.7
                                                     Property valuation movements        (159.8)    5.8     (154.0)   41.9

• Housebuilding profit down due to pause in build    Net other finance costs              (3.9)    (11.8)   (15.7)    (7.0)
  activity during H1 lockdown, with recovery in H2   Tax and non-controlling interests    24.6      1.4      26.0     (5.6)
                                                     Underlying net profit               (134.4)   12.8     (121.6)   68.0

• Adjusted EPRA earnings of £22.1m                   Exceptional items                      -        -         -      (17.3)
                                                     Net profit / (loss)                 (134.4)   12.8     (121.6)   50.7

• Dividend of 5.0 pence, reflecting normal policy    Total accounting return (%)         (12.6)     1.3      (11.4)    4.6
                                                     Adjusted EPRA EPS (p)                 2.1      7.8       9.9     17.4
                                                     Basic EPS (p)                       (60.5)     5.8     (54.7)    22.8
                                                     Dividend per share (p)                1.1      3.9       5.0      3.6

                                                                                                                               20
Adjusted EPRA earnings recovered to 77% of prior year in H2
FY earnings down due to lower SL&R income and housebuilding profits
(Changes in adjusted EPRA earnings by business unit and central items, £m)
17.4 pence
per share
1.4
Development Non-core
lettings (9.7) disposals,
Covid-19
impact
22.5 Lower
volumes and 9.9 pence
margins due (11.7) per share
to lockdown
2.8
38.7 1.7 (1.1)
Central cost Increase in
30.4 reductions borrowings
during H1 17.4
18.7 18.7 19.3 19.3
16.2
4.7
2019 St. Modwen St. Modwen Homes Strat. Land & Central admin Interest cost Tax & other 2020
Logistics Regeneration expenses
H1 H2
21Rental income set for material growth in 2021+
Net rent down due to disposals and COVID-19
• Net rental income down £8.9m during 2020 due to (net rental income £m)
40.1
non-core disposals and Covid-19 impact
(6.5) 34.4
2.1 (1.3) 31.2
(3.2) 4.9
21.4 (1.7) 10.1
• Logistics income proven very resilient, with 97.9% SML +6.1% LFL
10.7
of rent due in 2020 received and 0.2% waived SL&R -29.5% LFL; c. 85%
34.3on retail
Covid-19 impact
24.3
18.7 20.5
• SL&R rent collection for 2020 of 91.6%, as c. 60%
of income is retail/leisure 2019 Disposal New Vacated LFL 2020 FY FY 2021
letting for devt. impact - impact - start
disposals new
• Rent collection for December quarter trending in lettings
St. Modwen Logistics Strategic Land & Regeneration
line with previous quarter
Strong rent collection across the board
(% collected relative to this time last quarter in dotted line)
• Expect net rental income for 2021 to be broadly in
line with 2019 driven by logistics lettings 6
2
4 8 93 13
24 87
75
• £50m ERV potential from consented logistics 98 95
92 92
pipeline vs £10m rent on non-core assets 76
87
SL&R SML Total SL&R SML Total
FY20 December
Collected Waived Outstanding
22St. Modwen Homes profit improved to 92% of prior year in H2
SMH operating profit down due to build pause
• Full year revenue down 9.4% to £245.1m, reflecting (£m)
pause in build activity during Spring lockdown
(3.8)
0.5
(6.4)
• Operating profit down 23.9% YoY due reduction in
volume and resulting fixed cost inefficiencies 40.1
36.3 35.7
29.9 30.5
• H2 operating profit recovered to 92% of prior year,
despite reduced site efficiency in June/July
Nov 2019 Volume Impact of Margin Nov 2020
reduction changes in reduction
sales mix
• Outlook underpinned by strong order book, with
47% of target private sales forward sold Substantial recovery in operating profit in H2
(£m)
Margin 13.4% 13.9% 14.4% 14.8% 12.4%
• Expect significant growth in 2021, driven by up to
25% volume growth and margin recovery to c.
14.5%, assuming market conditions remain as is 24.9
20.2
22.9
14.3
9.8
6.6 15.2
9.0 11.1
5.8 7.6
3.8
2015 2016 2017 2018 2019 2020
H1 operating profit H2 operating profit
23Portfolio valuation and NAV up in H2 following reduction in H1
Portfolio revaluation H1 (%) Revaluation H2 (%) Portfolio revaluation full year (%) Portfolio
value
-7 (£m)
LOGISTICS (1.1) 4.6 3.5 666
SL&R 332
(25.5) (2.4) (29.7)
-5
Non-core retail (19.1) (2.3) (21.7) 86
-12
Regeneration (13.8) 8.5 (6.5) 63
South Wales land (53.3) (8.1) (56.6) 57
-22
Other residential land (17.2) (1.1) (21.4) 86
-5
Non-core other (11.6) (11.8) (26.0) 40
-137
TOTAL (12.1) 2.2 (10.5) 998*
* Excl. £373m SMH
NAV per share up 1.1% in H2 following reduction in H1
(in pence)
2.1 (3.0) +1.6% vs May
(-10.8% YoY)
(50.6) (9.6) 7.8 10.6 (4.0) (9.8)
470.4 484.2 484.2 483.3 +1.1% vs May
431.0 450.9 435.7 430.9 437.6 437.9
413.5 426.2 423.1 423.1 (-11.7%427.7
YoY) 427.7
Nov-15 Nov-16 Nov-17 Nov-18 Nov-19 Adjusted Logistics SL&R Other May-20 Adjusted Logistics SL&R Other Nov-20 EPRA NTA
EPRA valuation valuation EPRA valuation valuation
earnings earnings
24Strong capital base with 20% LTV provides room for growth
Key debt metrics Nov-20 Nov-19
• £118m reduction in net borrowings since May due to
successful non-core disposals Avg. duration of facilities (years) 3.9 4.9
Weighted avg. interest rate (%) 3.4 3.5
• Net borrowings to increase due to investment in Gross borrowings fixed/hedged (%) 61 66
growing income-producing logistics portfolio Net borrowings (£m) 277 291
Headroom (£m) 288 274
• Stable LTV of 20% provides clear headroom for LTV (%) 20.2 19.6
growth vs sub 30% target
LTV incl. cash on short-term deposit (%) 17.7 17.1
No significant debt maturities until December 2023 LTV remains well below sub 30% target
(maturity of existing facilities by calendar year, £m) (net borrowings in £m and LTV in %)
600 40
Homes England Extension Option
500 35
KPI Facility Extension Option
Homes England Facility 400 30
KPI Facility
425 300 25
RCF
200 20
15 100 15
75 75 75
15 0 10
2021 2022 2023 2024 2025 2026 2027 2028 Nov 15 Nov 16 Nov 17 Nov 18 Nov 19 Nov 20
Net borrowings (LHS) See-through LTV (RHS)
25Clear path to growth in earnings and total return
• Aim to deliver c. 9-10% total return in medium term
• Potential to grow adjusted EPRA EPS to c. 28p in
medium term, assuming market conditions remain Potential to deliver material growth in EPS
(medium term adjusted EPRA EPS potential, in pence)
as is
(1-2)
• Key drivers of adjusted EPRA EPS growth: 10-12 (2)
• Continued investment in logistics pipeline
• Growth in SMH volumes and margins
26
• Recycling out of low-returning SL&R assets 9-11
-
30
• Expect 2021 adjusted EPRA EPS to be close to 2019 9.9
levels, assuming current trading remains as is
2020 SML SMH SL&R Interest & Medium
other term
• Dividend payout of 50% of adjusted EPRA EPS potential
26Outlook
Our focus in executing our strategy

   Grow our two high-    ▪ Grow Logistics from £666m to >£1bn by 2023
    quality, scalable    ▪ Grow Homes from 1,000 to c. 1,500 units pa by 2023
       platforms         ▪ Recycle c. £180-200m of SL&R assets in next 3 years

                         ▪ Grow Homes margins to 16-17% by 2023
      Operational
                         ▪ Improve asset turn in housebuilding
      excellence
                         ▪ Maintain industry leading accident frequency rate

                         ▪ Deliver on six responsible business ambitions
  Responsible business   ▪ Become Net Zero Carbon operationally by 2025
                         ▪ Deliver on the Future Homes Standard

                         ▪ Improve customer understanding and engagement
       Customers
                         ▪ Maintain 5* HBF customer recommend status

                         ▪ Continue to support colleagues through pandemic
        People
                         ▪

                                                                                 28
Well-positioned for growth in two attractive sectors
• Clear strategic focus on two sectors which benefit SL&R
Logistics &
65%
from structural growth trends housebuilding
35%
Mid 2017
portfolio
• Two high-quality platforms to build scale, (£1.8bn)
underpinned by strong land capability
• Refocus land and regeneration capability on SL&R
supporting growth in two key sectors 24%
• Secured pipeline to grow logistics portfolio and 2020
portfolio Logistics &
annual housing delivery by >50% by 2023 (£1.4bn) housebuilding
76%
• Low 20% LTV and continued capital recycling
provides room to invest SL&R
90%
29Appendices
Disposals

FY 2020                     Amount £m   EPRA Net Initial Yield %

Acquisitions during 2020

Logistics land                  4                  -

Residential land                4                  -

Total                           8                  -

Disposals during 2020

Logistics                      29                 6.1

Non-core retail & other        32                 6.5

Residential land               93                  -

Total                          154                6.3

Disposals post period end

Non-core other                  7                  -

Total                           7                  -

                                                                   31
Income statement proportionally consolidated
2020 2020 2020 2020 2020 2019
St. Modwen St. Modwen Strategic Land
Unallocated Total Total
Logistics Homes & Regeneration
£m £m £m £m £m £m
Gross rental income 25.6 - 17.3 - 42.9 48.6
Property outgoings (5.4) - (7.2) - (12.6) (11.6)
Other net income 0.3 - 0.6 - 0.9 3.1
Net rental & other income 20.5 - 10.7 - 31.2 40.1
Housebuilding operating profit - 41.5 2.8 - 44.3 55.5
Development fee income 0.1 - 1.8 - 1.9 4.4
Business unit direct operating expenses (2.7) (11.1) (5.3) - (19.1) (21.7)
Central administrative expenses - - - (20.7) (20.7) (22.4)
Net interest costs - - - (10.4) (10.4) (9.3)
Taxation on adjusted EPRA earnings - - - (5.0) (5.0) (7.8)
Non-controlling interests on adjusted EPRA earnings - - - (0.1) (0.1) (0.1)
Adjusted EPRA earnings 17.9 30.4 10.0 (36.2) 22.1 38.7
Property revaluation and development gains 23.0 (3.4) (150.1) (3.3) (133.8) 24.4
Property disposal gains/(losses) (2.7) - (5.1) - (7.8) (5.0)
Impairment of intangibles - - - (3.6) (3.6) -
Change in discounted market liability - - (8.8) - (8.8) -
Net other finance costs - - (12.7) (3.0) (15.7) (7.0)
Tax on other earnings - - - 26.7 26.7 (1.7)
Less non-controlling interests on other earnings - - - (0.7) (0.7) 1.3
Profit attributable to the owners of the Company 38.2 27.0 (166.7) (20.1) (121.6) 50.7
32Balance sheet proportionally consolidated
Nov-20 Nov-20 Nov-20 Nov-20 Nov-20 Nov-19
St. Modwen St. Modwen Strategic Land
Unallocated Total Total
Logistics Homes & Regeneration
£m £m £m £m £m £m
Property portfolio 666 373 332 - 1,371 1,485
Other assets 12 30 53 98 193 207
Gross assets 678 403 385 98 1,564 1,691
Net borrowing - - - (277) (277) (291)
Lease liabilities - - - (8) (8) (9)
Other liabilities (19) (56) (139) (111) (325) (311)
Gross liabilities (19) (56) (139) (396) (610) (611)
Net assets 659 347 246 (298) 954 1,080
Non-controlling interests - - - (4) (4) (4.7)
Shareholders' funds 659 347 246 (302) 950 1,076
Business unit ROCE(1) 6.2 7.7 (46.2)
NAV per share (p) 427.7 484.2
EPRA NTA per share (p) 437.7 490.8
See-through LTV (%) 20.2 19.6
(1) Business unit returns on capital employed are calculated as the business unit profit before interest and tax for the year divided by the average business unit net
assets, after adding back any business unit specific net borrowings, for the year.
33Portfolio overview
Investment Assets Current Developments Land Total
£m £m £m £m
St. Modwen Logistics
Urban warehouse 304 - - 304
Big box 138 - - 138
Other 119 27 78 224
Total 561 27 78 666
St. Modwen Homes
Housebuilding - 142 231 373
Total - 142 231 373
Strategic Land & Regeneration
Residential land - 1 142 143
Regeneration 6 - 57 63
Non-core retail 86 - - 86
Non-core other 32 - 8 40
Total 124 1 207 332
Total portfolio 685 170 516 1,371
34Portfolio valuation and yields
EPRA EPRA topped
Portfolio Equivalent LFL equivalent LFL ERV
Value net initial up
movement yield yield shift growth
yield net initial yield
£m % % % % bps %
St. Modwen Logistics
Urban warehouse 304 3.0 3.5 5.1 6.1 (10) 0.3
Big box 138 6.6 0.5 2.1 4.8 (10) 0.7
Other 119 8.6 4.0 5.9 7.6 (50) 8.0
Current developments/land 105 (3.7)
Total 666 3.5 2.9 4.5 6.1 (20) 2.8
St. Modwen Homes
Housebuilding 373 - - - - - -
Total 373 - - - - - -
Strategic Land & Regeneration
Residential land 143 (40.7) - - - - -
Regeneration 63 (6.5) - - - - -
Non-core retail 86 (21.7) 9.4 9.5 10.1 80 (6.4)
Non-core other 40 (26.0) 6.5 6.6 7.5 30 (4.2)
Total 332 (29.7) 8.9 9.1 9.0 70 (5.9)
Total portfolio 1,371 (10.5) 3.9 5.3 6.7 - 0.1
(1) ERV growth and yields on investment assets only.
35Rent and vacancies
EPRA LFL
Topped-up EPRA WAULT WAULT
Passing rent ERV(1) rental
rent vacancy (3) (break) (expiry)
income (2)
£m £m £m % % yrs yrs
St. Modwen Logistics
Urban warehouse 11.9 17.1 21.1 12.6 16.0 5.0 7.9
Big box warehouse 1.8 4.3 7.7 (13.2) 44.4 10.5 11.6
Other 6.3 8.6 10.8 5.1 13.3 6.9 7.8
Current developments/land 0.4 0.4 0.2 0.3 - 5.0 10.0
Total 20.4 30.4 39.8 6.1 20.7 6.4 8.4
St. Modwen Homes - - - - - - -
Total - - - - - - -
Strategic Land & Regeneration
Residential land 1.8 1.8 0.7 18.5 33.1 - -
Regeneration 0.7 0.8 0.5 (16.8) 5.7 3.1 17.2
Non-core retail 9.9 10.1 10.4 (38.7) 11.3 5.2 6.3
Non-core other 3.1 3.1 3.3 (28.0) 11.6 5.2 7.2
Total 15.5 15.8 14.9 (29.5) 12.1 5.0 7.1
Total portfolio 35.9 46.1 54.7 (10.5) 18.4 6.0 8.0
(1) Excluding turnover rent at Trentham Gardens.
(2) Including impact of credit loss provision and temporary closure of Trentham as a result of Covid-19, £0.2m one-off and £0.6m impact from vacating space ahead of
future redevelopment; 1.1% excluding these items.
(3) Adjusting for lettings since year-end pro-forma St. Modwen Logistics vacancy has reduced to 13.9%, as big box warehouse reduced to 9.0%.
36Portfolio movements by sector
(1) (2)
Nov-19 Additions Disposals Transfers Valuation Nov-20
£m £m £m £m £m £m
St. Modwen Logistics
Urban warehouse 244 21 (8) 38 9 304
Big box 61 22 - 46 9 138
Other 133 1 (21) (3) 9 119
Current developments / land 150 45 (2) (84) (4) 105
Total 588 89 (31) (3) 23 666
St. Modwen Homes
Housebuilding 384 176 (198) 12 (1) 373
Total 384 176 (198) 12 (1) 373
Strategic Land & Regeneration
Residential land 259 40 (47) (12) (97) 143
Regeneration 96 1 - (30) (4) 63
Non-core retail 114 (2) (3) 1 (24) 86
Non-core other 44 5 (27) 32 (14) 40
Total 513 44 (77) (9) (139) 332
Total portfolio 1,485 309 (306) - (117) 1,371
(1) Additions include purchases and capital expenditure.
(2) Valuation movement excludes development profits.
37Portfolio movements by category
(1) (2)
Nov-19 Additions Disposals Transfers Valuation Nov-20
£m £m £m £m £m £m
Investment 626 44 (47) 68 (6) 685
Development 205 93 (73) (57) 2 170
Land 654 172 (186) (11) (113) 516
Total 1,485 309 (306) - (117) 1,371
(1) Additions include purchases and capital expenditure.
(2) Valuation movement excludes development profits.
38Our diversified logistics customer base
Top 10 customers (1, 2) Logistics customer exposure (1)
£m
Winit 2.1
BCA Fleet Solutions 2.0
Gatwick Airport 1.4
DB Schenker 1.2
Ocado 1.1
SMH Fleet Solutions 1.0
General Electric Energy 1.0
XPO Logistics 0.9
Grupo Antolin 0.9
DHL 0.9
Total 12.5
-end.
(2) Top 10 logistics customers are equal to top 10 customers of the overall Group.
39Committed logistics development pipeline
Total
Expected Current Future Yield on
Project Size Units Pre-let development ERV
completion book value capex cost
cost
000 sq ft % £m £m £m £m %
Big box logistics
Exeter 196 1 H2 2022 100
Gloucester 116 1 H2 2021 100
Newport 101 1 H1 2021 -
Urban warehouse
Stoke 224 3 H2 2021 -
Gloucester 189 4 H2 2021 -
Tamworth 161 3 H2 2021 -
Basingstoke 138 3 H2 2021 -
Wellingborough 139 2 H2 2021 -
Lincoln 124 4 H2 2021 -
Worcester 73 2 H2 2021 -
Gatwick 65 1 H1 2021 -
Newport 30 1 H1 2021 -
Total 1,555 26 19 155 27 128 11.5 7.5
40Logistics pipeline
St. Modwen Park Burton St. Modwen Park Access 18
1 Location: A38 8 Location: junction 18, M5
Potential size: 0.9m sq ft Potential size: 1.4m sq ft
Completed: 310k sq ft (100% let) Completed: 371k sq ft (81% let & u/o)
St. Modwen Park Tamworth St. Modwen Park Chippenham
2 Location: junction 10, M42 9 Location: junction 17, M4
Potential size: 0.8m sq ft Potential size: 1.0m sq ft
Completed: 565k sq ft (95% let) Completed: 106k sq ft
Committed: 161k sq ft
St. Modwen Park Stoke Central St. Modwen Park Gatwick
3 Location: junction 15 16 M6 10 Location: junction 10, M23 5
Potential size: 0.5m sq ft Potential size: 0.4m sq ft
Completed: 43k sq ft (100% let) Completed: 100k sq ft (100% let)
Committed: 65k sq ft 3
4
St. Modwen Park Stoke South Skypark, Exeter 1
4 Location: A50 / A5035 11 Location: junction 29, M5 2
Potential size: 0.4m sq ft Potential size: 0.2m sq ft
Completed: 184k sq ft (44% let) Committed: 196k sq ft (100% pre-let)
13
Committed: 224 sq ft
6
St. Modwen Park Lincoln St. Modwen Park Basingstoke
5 Location: A46 12 Location: junction 6, M3
Potential size: 0.7m sq ft Potential size: 0.1m sq ft 7
Completed: 176k sq ft (100% let) Committed: 138k sq ft 14
8
Committed: 124k sq ft 9
12
St. Modwen Park Broomhall St. Modwen Park Wellingborough
6 Location: junction 6 7, M5 13 Location: A45 / A14 10
Potential size: 0.2m sq ft Potential size: 0.8m sq ft
Committed: 73k sq ft Committed: 139k sq ft 11
St. Modwen Park Gloucester St. Modwen Park Newport
Location: junction 12, M5 Location: junction 23a, M4
7 Potential size: 1.1m sq ft 14 Potential size: 1.2m sq ft
Other consented space
Completed: 380k sq ft (100% let) Committed: 131k sq ft
East Midlands 0.8m sq ft
Committed: 305k sq ft (55% pre-let & u/o)
West Midlands 0.4m sq ft
South West 0.2m sq ft
41Residential pipeline
Residential plots (000) Owned Controlled Total
St. Modwen Homes 5.9 - 5.9
Strat. Land & Regeneration 6.6 6.8 13.4
Plots with planning 12.5 6.8 19.2
Strategic land 3.4 3.6 7.0
Total 15.9 10.4 26.3
42Joint venture arrangements
VSM Estates Mill
KPI VSM Estates Uxbridge VSM NCGM
Hill
Nov 2020
Property portfolio (£m) 95.7 24.4 0.0 25.5
NAV (£m) 87.2 (0.5) 5.7 15.3
Net (borrowings)/cash (£m) 1.1 4.0 4.9 9.5
LTV (%) 0.0 N/A(1) N/A(1) N/A(1)
Profit before tax (£m) (11.1) (10.6) (2.7) (29.2)
St. Modwen share (%) 50 50 75 50
Nov 2019
Property portfolio (£m) 111.9 37.2 0.0 17.7
NAV (£m) 98.1 9.6 11.3 31.0
Net (borrowings)/cash (£m) (6.4) 0.3 13.1 14.0
LTV (%) 5.7 N/A(1) N/A(1) N/A(1)
Profit before tax (£m) (1.4) (5.2) 1.9 (0.0)
St. Modwen share (%) 50 50 75 50
(1) This metric is not applicable to these joint ventures as they have no borrowing facilities.
43Glossary
• Adjusted EPRA earnings EPRA earnings adjusted • EPRA net tangible assets per share EPRA net • Net asset value (NAV) equity attributable to
to include development profits from housebuilding, tangible assets divided by the number of ordinary owners of the Company.
the amortisation of loan arrangement fees (including shares in issue at the period end (excluding shares • Net asset value (NAV) per share net asset value
the share of its joint ventures and held by The St. Modwen Properties PLC Employee divided by the number of ordinary shares in issue at
associates) and tax associated with both of these Share Trust). the period end (excluding shares held by The St.
company specific adjustments. • EPRA net initial yield (NIY) the yield that would Modwen Properties PLC Employee Share Trust).
• Adjusted EPRA earnings per share Adjusted be received by a purchaser, based on the current • Net borrowings total borrowings (at amortised
EPRA earnings divided by the weighted number of annualised rental income, net of non-recoverable cost and excluding lease liabilities) less cash and
shares in issue during the period (excluding shares outgoings (as determined by the external valuers), cash equivalents.
held by The St. Modwen Properties PLC Employee expressed as a percentage of the acquisition cost, • Return on capital employed (ROCE) Business
Share Trust). being the market value plus assumed actual unit profit before interest and for the year divided by
• ASP - the weighted average sales price of St. costs at the reporting date. the average business unit net assets, after adding
Modwen Homes units sold. • EPRA topped-up net initial yield EPRA net initial back any business unit specific net borrowings, for
• Business unit returns on capital employed - yield adjusted to include the expiration of rent free the year.
calculated as the business unit profit before interest periods or other unexpired lease incentives within • Passing rent the annualised rental income of a
and tax for the year divided by the average business annualised net rental income. property net of outstanding rent-free lease
unit net assets, after adding back any business unit • EPRA vacancy the ERV attributable to vacant incentives.
specific net borrowings, for the year. space expressed as a percentage of total ERV • Topped-up rent passing rent adjusted to include
• EPRA the European Public Real Estate Association, (including the share of joint ventures and the expiration of rent free periods or other unexpired
a body that has put forward recommendations for associates but excluding any properties under lease incentives.
best practice in financial reporting by real estate development). • Total accounting return (TAR) the increase in net
companies. • Equivalent yield the weighted average income asset value per share for the period, plus dividends
• EPRA earnings the Group profit for the year, return (after adding notional costs) a paid per share during the period, expressed as a
excluding investment property revaluation property will produce based upon the timing of the percentage of net asset value per share at the start
gains/losses, gains/losses on disposal of investment income received. In accordance with usual practice, of the period.
properties and inventories and associated items, and the equivalent yields (as determined by the external • Total development costs the expected
movements in the fair value of financial instruments. valuers) assume rent is received annually in arrears. development costs of a project, including the value
Each of these adjustments is made for both the • Equivalent yield shift the movement in the of land at the start of the project and any
Group and the share of its joint ventures and equivalent yield of a property asset during the associated land capital expenditure.
associates and is net of current and deferred tax period. • Weighed average unexpired lease term (WAULT)
charges/credits. • Estimated rental value (ERV) the external the weighted average remaining lease term.
• EPRA net tangible assets (EPRA NTA) net asset opinion as to the open market rent which, • Yield on cost the expected headline ERV on
value, adjusted to include the fair value of on the date of valuation, could reasonably be completion of a property under development
inventories and exclude deferred tax on capital expected to be obtained on a new letting or rent expressed as a percentage of the estimated total
allowances and revaluations on the retained review of the property. development cost.
portfolio, intangibles and the mark-to-market of • Loan-to-value (LTV) the level of the net • Yield on capex the yield on cost excluding the
derivative financial instruments. borrowings expressed as a percentage of the book value of land if the land is owned by the Group
property portfolio in the reporting period prior to commencement of
the development.
44Disclaimer
This document has been prepared by St. Modwen Properties PLC solely for use at a
presentation in connection with its full year results announcement in respect of the full
year ended 30 November 2020. For the purposes of this notice, the presentation
the question and answer session that follows the oral presentation, hard copies of this
document and any materials distributed at, or in connection with, that presentation.
The Presentation does not contain or constitute and should not be construed as an
invitation or inducement to any person to underwrite, subscribe for, or otherwise
acquire or dispose of any shares in St. Modwen Properties PLC or other securities and
should not be relied on for such purposes.
The Presentation may contain certain forward-looking statements. By their nature,
forward looking statements involve risk and uncertainty because they relate to future
events and circumstances. Actual outcomes and results may differ materially from any
outcomes or results expressed or implied by such forward looking statements.
Any forward looking statements made by or on behalf of St. Modwen Properties PLC
are made in good faith based on the information available at the time the statement
is made, speak only as of the date they are made and no representation or warranty is
given in relation to them, including as to their completeness or accuracy or the basis
on which they were prepared. St. Modwen Properties PLC does not undertake to
update forward looking statements to reflect any changes in St. Modwen Properties
PLC's expectations with regard thereto or any changes in events, conditions or
circumstances on which any such statement is based.
Statements are made in the Presentation about the price and past performance of
shares in St. Modwen Properties PLC. Past performance cannot be relied upon as a
guide to future performance.
45You can also read