2020 FULL YEAR AND FOURTH QUARTER EARNINGS - FEBRUARY 10, 2021

Page created by Clyde Ortega
 
CONTINUE READING
2020 FULL YEAR AND FOURTH QUARTER EARNINGS - FEBRUARY 10, 2021
2020 FULL YEAR AND
 FOURTH QUARTER
     EARNINGS
     FEBRUARY 10, 2021
2020 FULL YEAR AND FOURTH QUARTER EARNINGS - FEBRUARY 10, 2021
SAFE HARBOR COMMENTS
Forward-Looking Statements

This press release contains “forward-looking” statements related to O-I Glass, Inc. (“O-I Glass” or the “company”) within the meaning of Section 21E of the Securities Exchange Act of 1934, as amended (the
“Exchange Act”) and Section 27A of the Securities Act of 1933. Forward-looking statements reflect the company’s current expectations and projections about future events at the time, and thus involve
uncertainty and risk. The words “believe,” “expect,” “anticipate,” “will,” “could,” “would,” “should,” “may,” “plan,” “estimate,” “intend,” “predict,” “potential,” “continue,” and the negatives of these words and other
similar expressions generally identify forward-looking statements.

It is possible that the company’s future financial performance may differ from expectations due to a variety of factors including, but not limited to the following: (1) the company’s ability to obtain the benefits it
anticipates from the Corporate Modernization, (2) risks inherent in, and potentially adverse developments related to, the Chapter 11 bankruptcy proceeding involving the company’s wholly owned subsidiary
Paddock Enterprise, LLC (“Paddock”), that could adversely affect the company and the company’s liquidity or results of operations, including the impact of deconsolidating Paddock from the company’s
financials, risks from asbestos-related claimant representatives asserting claims against the company and potential for litigation and payment demands against the company by such representatives and other
third parties, (3) the amount that will be necessary to fully and finally resolve all of Paddock’s asbestos-related claims and the company’s obligations to make payments to resolve such claims under the terms
of its support agreement with Paddock, (4) the company’s ability to manage its cost structure, including its success in implementing restructuring or other plans aimed at improving the company’s operating
efficiency and working capital management, achieving cost savings, and remaining well-positioned to address the company’s legacy liabilities, (5) the company’s ability to acquire or divest businesses, acquire
and expand plants, integrate operations of acquired businesses and achieve expected benefits from acquisitions, divestitures or expansions, (6) the company’s ability to achieve its strategic plan, (7) foreign
currency fluctuations relative to the U.S. dollar, (8) changes in capital availability or cost, including interest rate fluctuations and the ability of the company to refinance debt on favorable terms, (9) the general
political, economic and competitive conditions in markets and countries where the company has operations, including uncertainties related to Brexit, economic and social conditions, disruptions in the supply
chain, competitive pricing pressures, inflation or deflation, changes in tax rates and laws, natural disasters, and weather, (10) the impact of COVID-19 and the various governmental, industry and consumer
actions related thereto, (11) the company’s ability to generate sufficient future cash flows to ensure the company’s goodwill is not impaired, (12) consumer preferences for alternative forms of packaging, (13)
cost and availability of raw materials, labor, energy and transportation, (14) consolidation among competitors and customers, (15) unanticipated expenditures with respect to data privacy, environmental, safety
and health laws, (16) unanticipated operational disruptions, including higher capital spending, (17) the company’s ability to further develop its sales, marketing and product development capabilities, (18) the
failure of the company’s joint venture partners to meet their obligations or commit additional capital to the joint venture, (19) the ability of the company and the third parties on which it relies for information
technology system support to prevent and detect security breaches related to cybersecurity and data privacy, (20) changes in U.S. trade policies, and the other risk factors discussed in the company’s Annual
Report on Form 10-K for the year ended December 31, 2019, Quarterly Report on form 10-Q for the quarterly period ended September 30, 2020 and any subsequently filed Annual Report on Form 10-K,
Quarterly Reports on Form 10-Q or the company’s other filings with the Securities and Exchange Commission.

It is not possible to foresee or identify all such factors. Any forward-looking statements in this document are based on certain assumptions and analyses made by the company in light of its experience and
perception of historical trends, current conditions, expected future developments, and other factors it believes are appropriate in the circumstances. Forward-looking statements are not a guarantee of future
performance and actual results or developments may differ materially from expectations. While the company continually reviews trends and uncertainties affecting the company’s results or operations and
financial condition, the company does not assume any obligation to update or supplement any particular forward-looking statements contained in this document.

    2
2020 FULL YEAR AND FOURTH QUARTER EARNINGS - FEBRUARY 10, 2021
OVERVIEW

Results exceeded management guidance
●   4Q20 aEPS1 was $0.40, above guidance of $0.30 - $0.35

●   FY20 FCF2 was $146M, above guidance of ≥ $100M

Stable demand amid ongoing global pandemic
●   4Q20 shipments ~ flat with prior year

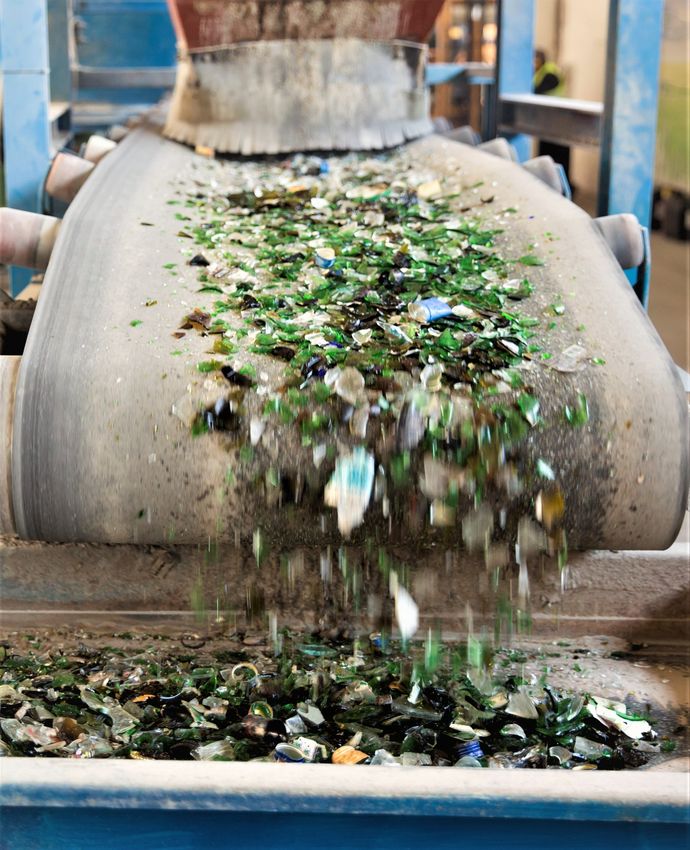
●   Consumers trust glass packaging on and off premise regardless of venue

●   Strong preference for glass as the healthy, premium and sustainable option for Food and Beverage

Improved results reflect strong execution of O-I’s value creation strategy
●   Margin Expansion initiatives continue to drive significant cost savings and top line enhancements

●   Optimizing structure through strategic and tactical divestiture programs

●   Revolutionizing glass as MAGMA continues to advance

Improving business outlook
●   FY21 aEPS expected to be $1.55 - $1.75; 1Q21 aEPS expected to be $0.32 - $0.37

●   FY21 FCF expected to approximate $240 million (20-25% EBITDA to FCF conversion)

        1   Adjusted EPS excludes items management does not consider representative of ongoing operations. See the appendix for further disclosure.
    3   2   Management defines free cash flow as cash provided by continuing operating activities less cash paid for property, plant and equipment (all components as determined in accordance with GAAP).
            See the appendix for further disclosure.
2020 FULL YEAR AND FOURTH QUARTER EARNINGS - FEBRUARY 10, 2021
SHIPMENTS STABILIZE ACROSS ALL GEOGRAPHIE S
                          2020 O-I Shipment Trends (vs PY)                                                       2020 Retail/Off Premise Consumer
                                                                                                                   Consumption Trends (vs PY)
     5%                                                                              40%
                                                         O-I                                             U.S. Beer                    U.S. Wine        U.S. Spirits
                                                         AM
     0%                                                                                                  U.S. Food                    Europe Alcohol   Europe Food
                                                         EU                          30%

     -5%
                                                                                     20%
  -10%

  -15%                                                                               10%

  -20%                                                                                 0%
                      Q1                       Q2                      Q3       Q4                       Q1                      Q2               Q3         Q4
Note: Volumes are on a year over year and same structure basis excluding ANZ.
                                                                                     Source: Various syndicated and broker reports

O-I Shipment Trends Reflect Disruption from Pandemic                                 Underlying Retail Consumer Consumption is Strong (~75-80% of O-I Vol)
Consumers Value Sustainability and Trust Premium Glass                               Offsetting Decline in On-Premise Consumption (~20-25% of O-I Vol)

            E X P E C T S H I P M E N T S W I L L I M P R O V E 2 - 4 % I N 2 0 2 1 A S P O P U L AT I O N I S
                        VA C C I N AT E D A N D M A R K E T S G R A D U A L LY R E O P E N
 4
2020 FULL YEAR AND FOURTH QUARTER EARNINGS - FEBRUARY 10, 2021
2020 KEY ACCOMPLISHMENTS

■    Executing the Strategic and Tactical divestiture programs including ANZ sale; reducing debt
      • Anticipate total proceeds ~ $1.1B, including $677 million from ANZ and $400-$500 million from Tactical divestitures upon completion

■    Improved financial flexibility despite pandemic
      • FCF exceeded guidance
      • Reduced net debt ~ $429M and leverage ratio was comfortably below covenant
      • Historically high liquidity and no near-term debt maturities

■    Successfully navigated the brunt of the pandemic through O-I’s COVID response plan
      • Quickly aligned supply with demand and achieved historically lower inventory/IDS levels

■    Generated ~$115M Margin Expansion initiative benefits, significantly exceeded original target
    • Significantly mitigated the unfavorable impact of lower production due to the pandemic

■    Advanced MAGMA with full scale Generation 1 deployment in Germany remaining on track for 1Q21

■    Paddock Chapter 11 initiated to establish a fair and final resolution to legacy asbestos liabilities

5
2020 FULL YEAR AND FOURTH QUARTER EARNINGS - FEBRUARY 10, 2021
ORGANIZED FOR SOLID EXECUTIO N
                         L E V E R A G I N G A D VA N C E D C A PA B I L I T I E S B U I LT I N R E C E N T Y E A R S

                People and Organization                                                                    Capital Structure Discipline
      Rigorous / integrated O-I People System         •                           Capital                  •   Maximize FCF / EBITDA Conversion
                                                                    People and                             •   Maintain strong liquidity
New org structure and operating model in 2020         •
                                                                                 Structure                 •   Reduce debt / Plan to ~ 3x leverage
Upgrade talent – internal / external succession       •             Organization                           •   Address legacy liabilities / Paddock Ch11
Incentives aligned with strategy / performance        •                          Discipline
                      Breakthrough R&D                                                                     Portfolio Optimization
  Unique org structure to support incubation      •
                                                          Breakthrough                       Portfolio     •   Align portfolio to market / customer strategy
 New MAGMA business model development             •                                                        •   All assets evaluated for return / cash flow
                R&D global partner network        •           R&D                           Optimization   •   Improve / restructure to enhance portfolio return
                 Modeling / 3D Engineering        •                                                        •   Strategic and tactical divestiture program

                                           ESG                                                             Management Systems
          Appointed Chief Sustainability Officer
              New global sustainability network
                                                      •
                                                      •
                                                                                            Management     •   Integrated Business Planning (IBP)

                      Establish ESG roadmap           •   ESG                                Systems
                                                                                                           •
                                                                                                           •
                                                                                                               End-to-end management system
                                                                                                               Completed 3-year implementation timeline
  Glass advocacy campaign to balance dialogue         •                                                    •   3-year rollup planning, synced with strategy
                                                                                                           •   Advanced demand planning capabilities
                 Commercial Excellence                                                                     •   Rapid supply chain alignment
                    Key Account Management •
          Customer Relationship Management •                    Commercial                 Margin
  Value Based Pricing and Net Promoter Score •                                                             Margin Expansion
                                                                Excellence                Expansion        •   Turnaround initiatives shifting to structural programs
               Marketing and Innovation                                      Marketing                     •   Revenue optimization embedded in commercial
    Digital marketing glass advocacy campaign •
      NPD process and capability development •
                                                                                and                        •
                                                                                                           •
                                                                                                               Factory performance across entire network
                                                                                                               Cost Transformation leverage zero based budgeting
                Marketing research capabilities •                            Innovation                    •   Org. simplification expedites decision making

      6
2020-2021 ESG ACCELERATION

      Expanded Initiatives and New Goals Across 9 Dimensions

  Our Structural Acceleration                      Leading the Way
  ●   Enhanced Rigor of Board Governance           ●   First glass container maker to have SBTi
                                                       approved emissions target
  ●   Appointed CSO mid-2020
                                                   ●   First packaging company to offer green bond
  ●   Established Internal Global Sustainability
      Network                                      ●   MAGMA expected to improve glass sustainability
                                                       profile, including bottle light weighting
  ●   Created Executive Diversity & Inclusion
      Council and signed the CEO action pledge     ●   Investing in improving sustainability of legacy
                                                       furnaces
  ●   2021 Sustainability report and expanded
      website disclosure

           RE-BALANCING THE PACKAGING DIALOGUE
Glass Advocacy ● Recycling Funding ● Donations for COVID Vaccine In Our Communities
  7
2021 PRIORITIES
      B O L D S T R U C T U R A L A C T I O N S T O C H A N G E O - I ’ S B U S I N E S S F U N D A M E N TA L S

                   1                                        2                                                    3
            MARGIN                             REVOLUTIONIZE                                            OPTIMIZE
           EXPANSION                              GLASS                                                STRUCTURE
STRONG OPERATING PERFORMANCE             C R E AT E A N E W B U S I N E S S M O D E L      REBALANCE BUSINESS PORTFOLIO
    AND COST EFFICIENCIES                      F O R G L A S S PA C K A G I N G             AND IMPROVE BALANCE SHEET

 ~$50M gross initiative benefits         Validate MAGMA Gen 1 in Germany               Complete the tactical divestiture program
     • Revenue Optimization                                                                 • $400-$500M 2019 to 2021
                                          Glass advocacy campaign
     • Factory Performance                                                               Evaluate expansion initiatives
                                          Reposition ESG
     • Cost transformation                                                                  • Potentially funded by incremental tactical divestitures
 Improve performance in North America                                                   Advance Paddock Chapter 11
                                                                                         Further efforts for a simple, agile organization
                                                                                         Increase cash flow and reduce debt

                         O-I WILL HOST INVESTOR WORKSHOPS DURING 2021 TO
 8                       SHARE LONG-TERM PLANS INCLUDING MAGMA AND ESG
2020 RESULTS
PA N D E M I C I M PA C T E D E A R N I N G S : ~ 4 % L O W E R S A L E S , ~ 7 . 5 % L O W E R P R O D U C T I O N
                                                                                                                                                                     SEGMENT
FY20 aEPS was $1.22 compared to $2.24 in PY                                                                                                                         OPERATING
                                                                                                                                                                    PROFIT1 ($M)                          aEPS
● ~ $1/sh gross impact of lower sales and production levels due to the pandemic             FY19 AS REPORTED                                                                          $856                     $2.24
● Very good operating and cost performance partially mitigated lower volumes
                                                                                            FX2                                                                                          (19)                  (0.09)
● Earnings also reflect unfavorable FX, temporary items and divestitures
                                                                                            Temporary items3                                                                             (17)                  (0.08)
                                                                                            Divestitures (ANZ/Soda Ash JV4)                                                              (24)                  (0.17)
Segment operating profit reflects impact of global pandemic
                                                                                            SUB-TOTAL                                                                                 $796                     $1.90
● Higher selling prices offset cost inflation                                               Net price5 (incl. cost inflation)                                                                 3                  0.01
● Sales volume down 4% from prior year
                                                                                            Volume and mix (incl. acquisitions)                                                          (83)                  (0.40)
   ● Down ~ 15% in 2Q20 during peak of pandemic; stable demand in other quarters
                                                                                            Operating costs (excl. cost inflation)                                                       (38)                  (0.18)
● Very good operating performance despite lower production
                                                                                            Retained corporate costs                                                                         --                (0.07)
   ● Production down ~ 7.5% from prior year due to pandemic ~ $155M unfav impact
                                                                                            Net interest expense6 / NCI                                                                      --                  0.11
   ● Lower production partially mitigated by Margin Expansion initiatives
● Total Margin Expansion initiatives ~ $115M fav benefit                                    Change in tax rate6                                                                              --                (0.14)
   ● Revenue optimization, factory performance and cost transformation                      Share count                                                                                      --                (0.01)
                                                                                            FY20 RESULTS                                                                              $678                     $1.22
Non-operating items                                                                       1 Segment operating profit is defined as consolidated earnings before interest income, interest expense, and provision for income taxes
                                                                                            and excludes amounts related to certain items that management considers not representative of ongoing operations as well as certain
                                                                                            retained corporate costs and the Company’s global equipment business. See the appendix for further disclosure.
● Higher retained corporate cost due to additional R&D and higher management incentives   2 Foreign currency effect determined by using 2020 foreign currency exchange rates to translate 2019 local currency results.
                                                                                          3 Temporary items primarily refer to the European energy certificates and white certificates.
● Lower interest expense reflects debt reduction and refinancing activities               4 Divestiture of Soda Ash JV impacts aEPS only, ANZ divestiture impacts both segment operating profit and aEPS
                                                                                          5 Net price represents the net impact of movement in selling prices and cost inflation.

● Elevated tax rate due to lower earnings and change in regional earnings mix
                                                                                          6 Adjusted interest expense and adjusted effective tax rate exclude certain items that management
                                                                                            considers not representative of ongoing operations.

 9
2020 FCF AND CAPITAL STRUCTURE
                                                                                        HIGHER FCF AND LOWER NET DEBT

                  CAPITAL ALLOCATION GUIDING PRINCIPLES                                                                                                                                               FY20 FCF1 AND NET DEBT2 FAVORABLE TO PY
GUIDING PRINCIPLE                                                                 PROGRESS                                                                                                                         800
                                                                                                                                                                                                                                                 FCF Progression
                                                                                                                                                                                                                                                                                          561

Maximize Free Cash Flow1                                                                                                                                                                                           400
                                                                                                                                                                                                                                          112
                                                                                                                                                                                                                                                               205
                                                                                                                                                                                                                                                                     316           264
                                                                                                                                                                                                                                                                                                  146

● Strong free cash flow                                                           ● FY20 FCF $146M vs $(18)M in PY                                                                                                    0

                                                                                                                                                                                                            ($M)
                                                                                                                                                                                                                                                                                                         (18)
● CapEx ~ $300M                                                                   ● FYE CapEx $311M (higher due to FX)                                                                                                                          (179)
                                                                                                                                                                                                                   (400)
● FYE20 IDS at or below PY                                                        ● FYE IDS 9 days below PY                                                                                                                (435)

                                                                                                                                                                                                                   (800)       (716)
                                                                                                                                                                                                                              1Q            2Q                   3Q                      4Q            FY
Preserve Strong Liquidity
                                                                                                                                                                                                                                                        2020                2019
● Liquidity ≥ $1.25B across 2020                                                  ● FYE20 committed liquidity > $2.2B

Reduce Net Debt2                                                                                                                                                                                                   6.3
                                                                                                                                                                                                                                           Net Debt Progression
                                                                                                                                                                                                                                                        5.96
                                                                                                                                                                                                                   6.0
● FYE20 net debt below PY of $5.0B                                                ● FYE20 net debt $4.6B, down ~ $429M from PY
                                                                                                                                                                                                                   5.8      5.51
                                                                                                                                                                                                                                   5.59                                           5.62
● Divestitures for further deleveraging                                           ● ANZ net proceeds applied to debt                                                                                               5.5
                                                                                                                                                                                                                                                5.44

● Manage leverage position                                                        ● BCA leverage ratio3 well below covenant (5.0x)                                                                                 5.3

                                                                                                                                                                                                            ($B)
                                                                                                                                                                                                                                                                                                       5.01
                                                                                                                                                                                                                   5.0                                                     4.77
● Improve balance sheet position                                                  ● No significant bond maturities until 2023                                                                                      4.8                                                                          4.58
                                                                                  ● Discretionary funding to de-risk pensions                                                                                      4.5
                                                                                                                                                                                                                   4.3
                                                                                                                                                                                                                   4.0
                                                                                                                                                                                                                               1Q                  2Q                        3Q                   4Q
       1   Management defines free cash flow as cash provided by continuing operating activities less cash paid for property, plant and equipment (all components as determined in accordance with GAAP).
           See the appendix for further disclosure.                                                                                                                                                                                                     2020                  2019
  10   2   Net Debt is defined as Total Debt less Cash. See appendix for further disclosure.
       3   BCA leverage ratio is defined as Net Debt divided by EBITDA, after credit agreement adjustments.
4Q20 RESULTS
                   HIGHER SEGMENT OPERATING PROFIT (EXCLUDING DIVESTITURES AND FX)
                                                                                                                                                                 SEGMENT
                                                                                                                                                                OPERATING
4Q20 aEPS was $0.40 compared to $0.50 in PY                                                                                                                     PROFIT1 ($M)                          aEPS
                                                                                        4Q19 AS REPORTED                                                                          $203                    $0.50
● Current year results reflect recent divestitures
                                                                                        FX2                                                                                            (4)                (0.03)

Higher segment operating profit (excluding divestitures and FX)                         Divestitures (ANZ/Soda Ash JV3)                                                             (19)                  (0.09)
                                                                                        SUB-TOTAL                                                                                 $180                    $0.38
● Higher selling prices fully offset cost inflation
                                                                                        Net price4 (incl. cost inflation)                                                                6                   0.03
● Sales volume ~ flat with prior year; favorable mix
                                                                                        Volume and mix (incl. acquisitions)                                                              3                   0.01
● Very good operating performance reflects margin expansion initiatives
   ● Production volume consistent with prior year levels                                Operating costs (excl. cost inflation)                                                         11                    0.05

   ● Higher plant incentive costs, elevated logistics, inventory adjustments            Retained corporate costs                                                                         --               (0.05)
● Margin expansion initiatives and cost control actions benefited results ~ $45M        Net interest expense5 / NCI                                                                      --                  0.00
                                                                                        Change in tax rate5                                                                              --               (0.01)
Non-operating items                                                                     Share count                                                                                      --               (0.01)

● Higher retained corporate cost: additional R&D, higher management incentives          4Q20 RESULTS                                                                              $200                    $0.40

● 32% adjusted effective tax rate5 compared to 31% in prior year                   1 Segment operating profit is defined as consolidated earnings before interest income, interest expense, and provision for income taxes
                                                                                     and excludes amounts related to certain items that management considers not representative of ongoing operations as well as certain
                                                                                     retained corporate costs and the Company’s global equipment business. See the appendix for further disclosure.
                                                                                   2 Foreign currency effect determined by using 2020 foreign currency exchange rates to translate 2019 local currency results.
                                                                                   3 Divestiture of Soda Ash JV impacts aEPS only, ANZ divestiture impacts both segment operating profit and aEPS
                                                                                   4 Net price represents the net impact of movement in selling prices and cost inflation.
                                                                                   5 Adjusted interest expense and adjusted effective tax rate exclude certain items that management
                                                                                     considers not representative of ongoing operations.

 11
4Q20 SEGMENT REVIEW
                                                     IMPROVED PROFITS IN BOTH AMERICAS AND EUROPE

                                                                           AMERICAS                                                                                                        EUROPE                                                                                    ASIA PACIFIC1
                                                 SEGMENT                                                                                                     SEGMENT                                                                                                    SEGMENT
                                                OPERATING                                                                                                   OPERATING                                                                                                  OPERATING
($M)                                              PROFIT                                                COMMENTS                                              PROFIT                                             COMMENTS                                                PROFIT                                       COMMENTS

4Q19                                                         $115                                                                                                          $69                                                                                                         $19
 FX                                                               (8)                                                                                                           4                                                                                                           --
 Divestitures                                                        --                                                                                                         --                                                                                                      (19)         ▼        ANZ sale
SUBTOTAL                                                     $107                                                                                                          $73                                                                                                            $0
 Net price                                                        (9)        ▲        Constructive price environment                                                          15         ▲       Constructive price environment                                                            ---
 (incl. cost inflation)                                                               • Revenue Optimization                                                                                     • Revenue Optimization
                                                                             ▼        FX induced inflation                                                                               ►       Modest inflation
 Volume and mix                                                      6       ▲        Sales volume increased 2.4%                                                            (3)         ▼       Sales volume decreased 2.3%                                                               ---
 (incl. acquisitions)
 Operating costs                                                  23         ▲        Margin expansion initiatives                                                         (12)          ▲       Margin expansion initiatives                                                              ---
 (excl. cost inflation)                                                               • Factory Performance                                                                                      • Factory Performance
                                                                                      • Cost Transformation                                                                                      • Cost Transformation
                                                                             ▲        Improved JV performance                                                                            ▲       Improved JV performance
                                                                             ▼        Plant performance incentives                                                                       ▼       Plant performance incentives
                                                                                                                                                                                         ▼       Higher logistics costs
                                                                                                                                                                                         ▼       Aged inventory adjustment
4Q20                                                         $127                                                                                                          $73                                                                                                            $0

  12    1 Following the sale of ANZ on July 31, 2020, the remaining businesses in the Asia Pacific region do not meet the criteria of an individually reportable segment. Therefore, the results for the company’s remaining Asia businesses will be included in retained corporate and other costs following that date.
2021 BUSINESS OUTLOOK
                                       I M P R O V I N G O U T L O O K A S M A R K E T S S TA B I L I Z E A N D R E C O V E R
                                  EARNINGS OUTLOOK (aEPS)                                                                                                                                    FCF OUTLOOK ($M)
                                                                 FY21                                                                    1Q21                                                              FY21

2020 AS REPORTED                                      $1.22                                                                     $0.41                                   2020 AS REPORTED                 $146    14% Adj EBITDA conversion5

FX1                                                    $0.02                                                                     $0.00                                  FX1                              ($15)

Divestitures2                                                                                                                                                           Divestitures2                     $50
                                                    ($0.04)                                                                   ($0.04)
                                                                                                                                                                        SUBTOTAL                         $181
SUBTOTAL                                               $1.20                                                                     $0.37
Net price3
                                                                                                                                                                        EBITDA                            ▲      $475M of D&A

(incl. cost inflation)                                     ▼          PAF lag effect                                                ►
                                                                                                                                                                        Working Capital                   ▲      $50M to $75M use of cash in 2021
Volume and mix
                                                           ▲          + 2 to 4%                                                     ►           ~ Flat
(incl. acquisitions)
                                                                                                                                                                        CapEx                             ▼      $375M in 2021

                                                                      Fav prod volume
                                                                                                                                                                                                          ►
                                                                                                                                                Fav initiatives
Operating costs                                                                                                                                                         Restructuring cash
(excl. cost inflation)                                     ▲          Fav net margin expansion Initiatives
                                                                      Higher depreciation, maintenance,                             ▲           Higher maintenance,
                                                                                                                                                insurance and pension
                                                                      insurance and pension expense
                                                                                                                                                                        Pension                           ▲      $35 cash above exp in 2021

Retained corporate costs                                   ▼          R&D, incentives                                               ▼           R&D
                                                                                                                                                                        Equity investments                ▲      Dividends = income in 2021

Net interest exp4 / NCI                                    ►                                                                        ►                                   Interest payments                 ►
Change in tax rate4                                        ▲          ~28 to 32% tax rate                                           ▼           ~30% tax rate
                                                                                                                                                                        Cash taxes                        ▼      $110M in 2021

Share count                                                ►          SBB offset new incentive awards                               ▼                                   Returnable packaging / Other      ▼      Government programs lapse
                                                                                                                                                                                                                 Additional packaging as vol incr.

2021 GUIDANCE                                      ~ $1.55 - $1.75                                                           ~ $0.32 - $0.37                            2021 GUIDANCE                  ~$240M    20-25% EBITDA conversion

           1.   Foreign currency effect determined by using January 31, 2021 foreign currency exchange rates to translate 2020 local currency results.
           2.   Divestiture of ANZ and Argentina, net of lower interest expense due to debt reduction. Excludes factoring impact.
           3.   Net price represents the net impact of movement in selling prices and cost inflation.
13         4.   Adjusted interest expense and adjusted effective tax rate exclude certain items that management considers not representative of ongoing operations.
           5.   See the appendix for further disclosure on the non-GAAP measure, Adj EBITDA conversion
CONCLUSIO N

2020 results above most recent guidance

Stable demand amid ongoing pandemic

Organized for execution – leveraging new capabilities
                                                        Sustainability
Clear priorities for 2021                                 Message
Improving business outlook and volume growth

14
FINANCIAL APPENDIX
FX I M PACT O N EARNI NG S

     APPROXIMATE ANNUAL IMPACT ON   FX RATES AT KEY POINTS
     EPS FROM 10% FX CHANGE                  Jan 31st   Avg      Avg
                                               2021    1Q20     2020
     EUR        0.13                EUR          1.21    1.10     1.15
     MXN        0.04                MXN         20.35   20.74    21.56
     BRL        0.03                BRL          5.44    4.64     5.21
     COP        0.01                COP         3,558   3,655    3,715

16
NO N- G AAP FI NANCI AL M EASUR E S
The company uses certain non-GAAP financial measures, which are measures of its historical or future financial performance that are not calculated and presented in accordance with
GAAP, within the meaning of applicable SEC rules. Management believes that its presentation and use of certain non-GAAP financial measures, including adjusted earnings, adjusted
earnings per share, segment operating profit, net debt, free cash flow, adjusted EBITDA, adjusted EBITDA to free cash flow conversion, adjusted interest expense and adjusted effective
tax rate provide relevant and useful supplemental financial information, that is widely used by analysts and investors, as well as by management in assessing both consolidated and
business unit performance. These non-GAAP measures are reconciled to the most directly comparable GAAP measures and should be considered supplemental in nature and should not
be considered in isolation or be construed as being more important than comparable GAAP measures.

Adjusted earnings relates to net earnings from continuing operations attributable to the company, exclusive of items management considers not representative of ongoing operations
because such items are not reflective of the company’s principal business activity, which is glass container production. Adjusted earnings are divided by weighted average shares
outstanding (diluted) to derive adjusted earnings per share. Segment operating profit relates to earnings from continuing operations before interest expense, net, and before income taxes
and is also exclusive of items management considers not representative of ongoing operations as well as certain retained corporate costs. Management uses adjusted earnings, adjusted
earnings per share, and segment operating profit to evaluate its period-over-period operating performance because it believes these provide useful supplemental measures of the results
of operations of its principal business activity by excluding items that are not reflective of such operations. Adjusted earnings, adjusted earnings per share, and segment operating profit
may be useful to investors in evaluating the underlying operating performance of the company’s business as these measures eliminate items that are not reflective of its principal business
activity.

Net debt is defined as total debt less cash. Management uses net debt to analyze the liquidity of the company.

Further, free cash flow relates to cash provided by continuing operating activities less cash payments for property, plant and equipment. Management has historically used free cash flow
to evaluate its period-over-period cash generation performance because it believes this has provided a useful supplemental measure related to its principal business activity. Adjusted
EBITDA relates to net earnings from continuing operations attributable to the company, less interest, taxes, depreciation and amortization as well as items management considers not
representative of ongoing operations because such items are not reflective of the company’s principal business activity, which is glass container production. Free cash flow to adjusted
EBITDA conversion may be useful to investors to assist in understanding the comparability of cash flows generated by the company’s principal business activity. It should not be inferred
that the entire free cash flow amount is available for discretionary expenditures, since the company has mandatory debt service requirements and other non-discretionary expenditures that
are not deducted from the measure. Management uses non-GAAP information principally for internal reporting, forecasting, budgeting and calculating compensation payments.

The Company routinely posts important information on its website at www.o-i.com/investors.

    17
The reconciliation below describes the items that management considers not representative of ongoing operations.

RECO NCI LI AT I O N FO R   Unaudited
                                                                                                                       Three months ended

                                                                                                                      2020
                                                                                                                          December 31
                                                                                                                                    2019                   2020
                                                                                                                                                                   Year ended
                                                                                                                                                                  December 31
                                                                                                                                                                                2019

ADJUSTED EARNI NG S         Earnings (loss) from continuing operations attributable to the Company

                               Items impacting cost of goods sold:
                                                                                                                  $       (29)    $       32           $          249    $             (397)

                                    Acquisition-related fair value inventory adjustments                                                                                                  1
                               Items impacting other selling and administrative expense:
                                    Restructuring, asset impairment and other charges                                                                                                     2
                               Items impacting equity earnings (losses) :
                                    Restructuring, asset impairment and other charges                                      36                                      36
                               Items impacting other expense, net:
                                    Gain on sale of ANZ businesses                                                          5                                  (275)
                                    Charge for asbestos-related costs                                                                     35                                             35
                                    Charge for goodwill impairment                                                                                                                      595
                                    Restructuring, asset impairment and other charges                                      26             41                      106                   111
                                    Strategic transaction and corporate modernization costs                                 1             31                        8                    31
                                    Charge for deconsolidation of Paddock                                                                                          14
                                    Pension settlement charges                                                             18             13                       26                    26
                                    Gain on sale of equity investment                                                                   (107)                                          (107)
                               Items impacting interest expense:
                                    Charges for note repurchase premiums and write-off of finance fees                                    39                       44                    65
                               Items impacting income tax:
                                    Net benefit for income tax on items above                                               7             (7)                     (13)                  (13)
                                    Tax charge recorded for certain tax adjustments                                                        3                                              3
                               Items impacting net earnings attributable to noncontrolling interests:
                                    Net impact of noncontrolling interests on items above                                   (1)           (1)                      (1)                    (1)
                            Total adjusting items (non-GAAP)                                                      $        92     $       47           $          (55)   $              748

                            Adjusted earnings (non-GAAP)                                                          $        63     $       79           $          194    $              351

                            Diluted average shares (thousands)                                                        157,274         156,907               158,785               155,250

                            Earnings (loss) per share from continuing operations (diluted)                        $      (0.18)   $     0.20           $       1.57      $             (2.56)
                            Adjusted earnings per share (non-GAAP) (a)                                            $      0.40     $     0.50           $       1.22      $             2.24

                            (a) For purposes of computing adjusted earnings per share, the diluted average shares (in thousands) are 156,651 for the year ended Dec. 31, 2019.
                                For purposes of computing adjusted earnings per share, the diluted average shares (in thousands) are 159,824 for the three months ended Dec. 31, 2020.

                            The Company is unable to present a quantitative reconciliation of its forward-looking non-GAAP measure, adjusted earnings and adjusted earnings per share, for the quarter
                            ending March 31, 2021 or year ending December 31, 2021, to its most directly comparable GAAP financial measure, earnings from continuing operations attributable to the
                            Company, because management cannot reliably predict all of the necessary components of this GAAP financial measure without unreasonable efforts. Earnings from
                            continuing operations attributable to the Company includes several significant items, such as restructuring charges, asset impairment charges, charges for the write-off of
                            finance fees, and the income tax effect on such items. The decisions and events that typically lead to the recognition of these and other similar items are complex and
                            inherently unpredictable, and the amount recognized for each item can vary significantly. Accordingly, the Company is unable to provide a reconciliation of adjusted
                            earnings and adjusted earnings per share to earnings from continuing operations attributable to the Company or address the probable significance of the unavailable
18                          information, which could be material to the Company's future financial results.
Three months ended            Year ended
                                                  Unaudited                                                                                     December 31              December 31

 R E C O N C I L I AT I O N T O E A R N I N G S
                                                                                                                                             2020          2019       2020          2019
                                                  Net sales:
                                                   Americas                                                                              $     880      $    890     $ 3,322     $    3,622
F R O M C O N T I N U I N G O P E R AT I O N S     Europe
                                                   Asia Pacific
                                                                                                                                               589
                                                                                                                                                 -
                                                                                                                                                             553
                                                                                                                                                             153
                                                                                                                                                                       2,364
                                                                                                                                                                         281
                                                                                                                                                                                      2,387
                                                                                                                                                                                        534

      B E F O R E I N C O M E TA X E S            Reportable segment totals                                                                   1,469         1,596     5,967           6,543
                                                   Other                                                                                         28            32        124            148
                                                  Net sales                                                                              $    1,497     $   1,628    $ 6,091     $    6,691

                                                  Segment operating profit (a):
                                                   Americas                                                                              $     127      $    115     $ 395       $     495
                                                   Europe                                                                                       73            69       264             317
                                                   Asia Pacific                                                                                  -            19        19              44
                                                  Reportable segment totals                                                                    200           203        678            856

                                                  Items excluded from segment operating profit:
                                                    Retained corporate costs and other                                                          (47)          (29)     (145)           (112)
                                                                                                                (b)
                                                    Items not considered representative of ongoing operations                                   (86)          (13)       85            (694)

                                                  Interest expense, net                                                                         (53)          (96)     (265)           (311)
                                                  Earnings (loss) from continuing operations before income taxes                         $       14     $      65    $ 353       $     (261)

                                                  Ratio of earnings (loss) from continuing operations before income taxes to net sales         0.9%          4.0%       5.8%           -3.9%

                                                  Segment operating profit margin (c):
                                                   Americas                                                                                   14.4%         12.9%     11.9%           13.7%
                                                   Europe                                                                                     12.4%         12.5%     11.2%           13.3%
                                                   Asia Pacific                                                                                   -         12.4%      6.8%            8.2%
                                                  Reportable segment margin totals                                                            13.6%         12.7%     11.4%           13.1%

                                                  (a)   Segment operating profit consists of consolidated earnings before interest income, interest expense, and provision for income taxes and excludes
                                                        amounts related to certain items that management considers not representative of ongoing operations as well as certain retained corporate costs.

                                                        The Company presents information on segment operating profit because management believes that it provides investors with a measure of
                                                        operating performance separate from the level of indebtedness or other related costs of capital. The most directly comparable GAAP financial
                                                        measure to segment operating profit is earnings from continuing operations before income taxes. The Company presents segment operating profit
                                                        because management uses the measure, in combination with net sales and selected cash flow information, to evaluate performance and to
                                                        allocate resources.

                                                  (b)   Reference Reconciliation to Adjusted Earnings.
 19                                               (c)   Segment operating profit margin is segment operating profit divided by segment net sales.
4Q PRI CE, VO LUM E AND CURRENCY I M PACT
                                      O N REPO RTABL E SEG M ENT SALES
                                                                                                                         Three months ended December 31,
                                                                                                   Americas                 Europe            Asia Pacific        Total

                                  Net sales for reportable segments- 2019                      $           890       $             553       $         153    $       1,596
                                    Effects of changing foreign currency rates (a)                         (47)                     36                                  (11)
                                    Price                                                                   19                      14                                   33
                                    Sales volume & mix                                                      18                     (14)                                   4
                                    Divestiture (ANZ)                                                                                                 (153)            (153)
                                  Total reconciling items                                                  (10)                     36                (153)            (127)
                                  Net sales for reportable segments- 2020                      $           880       $             589       $         -      $       1,469

     4Q PRI CE, SALES VO LUM E, O PERATI NG CO STS AND CURRENCY
        I M PACT O N REPO RTABL E SEG M ENT O PERATI NG PRO FI T
                                                                                                                       Three months ended December 31,
                                                                                                 Americas                 Europe            Asia Pacific          Total
                                  Segment operating profit - 2019                              $        115          $            69      $             19    $           203
                                    Effects of changing foreign currency rates (a)                        (8)                      4                                       (4)
                                    Net Price (net of cost inflation)                                     (9)                     15                                        6
                                    Sales volume & mix                                                     6                      (3)                                       3
                                    Operating costs                                                       23                     (12)                                      11
                                    Divestiture (ANZ)                                                                                                 (19)                (19)
                                  Total reconciling items                                                   12                     4                  (19)                 (3)
                                  Segment operating profit - 2020                              $           127       $            73      $           -       $           200

      (a) Currency effect on net sales and segment operating profit determined by using 2020 foreign currency exchange rates to
20
          translate 2019 local currency results.
FULL YEAR PRI CE, VO LUM E AND CURRENC Y I M PACT
                           O N REPO RTABL E SEG M ENT SALES
                                                                                                                            Year ended December 31,
                                                                                                    Americas               Europe           Asia Pacific           Total

                                   Net sales for reportable segments- 2019                      $         3,622       $            2,387    $          534     $       6,543
                                     Effects of changing foreign currency rates (a)                        (204)                      41               (17)             (180)
                                     Price                                                                   30                       51                                  81
                                     Sales volume & mix                                                    (126)                    (115)               (7)             (248)
                                     Divestiture (ANZ)                                                                                                (229)             (229)
                                   Total reconciling items                                                 (300)                     (23)             (253)             (576)
                                   Net sales for reportable segments- 2020                      $         3,322       $            2,364    $          281     $       5,967

        FULL YEAR PRI CE, SALES VO LUM E, O PERATI NG CO STS AND
     CURRENCY I M PACT O N REPO RTABL E SEG M ENT O PERATI NG PRO FI T
                                                                                                                            Year ended December 31,
                                                                                                  Americas                 Europe            Asia Pacific          Total
                                   Segment operating profit - 2019                              $        495          $           317      $            44     $            856
                                     Effects of changing foreign currency rates (a)                       (19)                       1                   (1)                (19)
                                     Net Price (net of cost inflation)                                    (38)                      51                 (10)                   3
                                     Sales volume & mix                                                   (54)                     (27)                  (2)                (83)
                                     Operating costs                                                       11                      (78)                 12                  (55)
                                     Divestiture                                                                                                       (24)                 (24)
                                   Total reconciling items                                                 (100)                   (53)                (25)                (178)
                                   Segment operating profit - 2020                              $           395       $           264      $            19     $            678

       (a) Currency effect on net sales and segment operating profit determined by using 2020 foreign currency exchange rates to
21
           translate 2019 local currency results.
RECO NCI LI AT I O N FO R FREE CASH FLO W
                                                                                                                                                                                                          Forecast for
                                                                                                        Three Months Ended                                                         Year Ended             Year Ended
                                                                  March 31,   June 30,   Sept 30,      Dec 31,       March 31,        June 30,   Sept 30,     Dec 31,           Dec 31,   Dec 31,
                                                                    2020        2020       2020         2020           2019             2019      2019         2019              2020      2019       Dec 31, 2021

Cash provided by (utilized in) continuing operating activities     $   (315) $     181 $       262 $       329          $      (595) $     (67) $        416 $       654        $    457 $     408    $             615
Cash payments for property, plant and equipment                        (120)       (69)        (57)        (65)                (121)      (112)         (100)        (93)           (311)     (426)                (375)
Free cash flow (non-GAAP)                                          $   (435) $     112 $       205 $       264          $      (716) $    (179) $        316 $       561        $    146 $     (18)   $             240

                                                                 RECO NCI LI AT I O N FO R NET DEBT

                                                                                                                                     Three Months Ended
                                                                                           March 31,     June 30,   Sept 30,        Dec 31,      March 31,       June 30,   Sept 30,   Dec 31,
                                                                                            2020           2020      2020            2020           2019           2019      2019       2019

                             Total debt                                                    $   6,398     $ 6,507    $       5,375   $ 5,142         $ 5,911      $ 6,331    $ 5,888    $ 5,559
                             Cash and cash equivalents                                           891       1,067              606       563             326          371        273        551
                             Net Debt                                                      $   5,507     $ 5,440    $       4,769   $ 4,579         $ 5,585      $ 5,960    $ 5,615    $ 5,008

    22
RECO NCI LI AT I O N FO R ADJUSTED EBI TDA CO NVERSI O N
                                                                                                                            Year Ended
                                                                                                                              Dec 31,
                                                                                                                               2020

                               Earnings (loss) from continuing operations before income taxes                                $     353
                               Interest expense, net                                                                              (265)
                               Earnings (loss) before interest and taxes (non GAAP)                                          $     618

                               Depreciation and amortization                                                                       482
                               Earnings (loss) before interest, taxes, depreciation and amortization (non GAAP)              $   1,100

                                Items not considered representative of ongoing operations (a)                                      (85)
                               Adjusted Earnings (loss) before interest, taxes, depreciation and amortization (non GAAP)     $   1,015

                               Cash provided by (utilized in) continuing operating activities                                $     457
                               Cash payments for property, plant and equipment                                                    (311)
                               Free cash flow (non-GAAP)                                                                     $     146

                               Adjusted EBITDA to Free cash flow conversion                                                      14.4%

                               (a)
                                     Reference Reconciliation to Adjusted Earnings.

     The Company is unable to present a quantitative reconciliation of its forward-looking non-GAAP measures, EBITDA and free cash flow, for the year ending December 31, 2021,
     to its most directly comparable GAAP financial measures, earnings (loss) from continuing operations before income taxes plus items that management considers not
     representative of ongoing operations, depreciation and amortization and cash provided by continuing operations less cash payments for property, plant and equipment,  
     because management cannot reliably predict all of the necessary components of these GAAP financial measures without unreasonable efforts.  Earnings (loss) from
     continuing operations before income taxes includes several significant items, such as restructuring charges, asset impairment charges, charges for the write-off of finance
     fees. The decisions and events that typically lead to the recognition of these and other similar items are complex and inherently unpredictable, and the amount recognized
     for each item can vary significantly. Accordingly, the Company is unable to provide a reconciliation of EBITDA to earnings (loss) from continuing operations before income
     taxes and free cash flow to cash provided by continuing operating activities or address the probable significance of the unavailable information, which could be material to the
23   Company's future financial results.
RECO NCI LI AT I O N FO R ADJUSTED NET I NTERES T EXPEN S E

                   Unaudited                                                                Three Months Ended                        Year Ended
                                                                                           Dec 31,       Dec 31,                Dec 31,        Dec 31,
                                                                                            2020          2019                   2020           2019

                   Interest expense, net                                                  $      (53)       $      (96)        $    (265)       $     (311)
                   Items impacting interest expense (a)                                          -                  39                44                65
                   Adjusted Net Interest Expense                                           $     (53)       $      (57)        $    (221)        $    (246)

                   (a)
                         Reference Reconciliation to Adjusted Earnings.

The Company is unable to present a quantitative reconciliation of its forward-looking non-GAAP measure, adjusted net interest expense, for the year ending December 31, 2021 and quarter ended March 31, 2021,
to its most directly comparable GAAP financial measure, Interest expense, net, because management cannot reliably predict all of the necessary components of these GAAP financial measures
without unreasonable efforts.  Interest expense, net, includes several significant items, such as charges for the write-off of finance fees and note repurchase fees.
The decisions and events that typically lead to the recognition of these and other similar items are complex and inherently unpredictable, and the amount recognized for each item
can vary significantly. Accordingly, the Company is unable to provide a reconciliation of adjusted interest expense, net or address the probable significance of the unavailable information,
which could be material to the Company's future financial results.

24
RECO NCI LI AT I O N FO R ADJUSTED EFFECT I V E TAX RATE

Unaudited                                                                               Three Months Ended                                  Year Ended
                                                                              December 31, 2020     December 31, 2019       December 31, 2020        December 31, 2019

Earnings (loss) from continuing operations before income taxes (A)                        $14                    $65                    $353         $          (261)
Items management considers not representative of ongoing operations                         86                     52                    (41)                     759
Adjusted Earnings (loss) from continuing operations before income taxes (C)              $100                   $117                    $312                    $498

Benefit (Provision) for income taxes (B)                                                   (39)                  (32)                    (89)                    (118)
Tax items management considers not representative of ongoing operations                      7                    (4)                    (13)                     (10)
Adjusted benefit (provision) for income taxes (D)                                          (32)                  (36)                   (102)                    (128)

Effective Tax Rate (B)/(A)                                                              278.6%                 49.2%                    25.2%                   -45.2%
Adjusted Effective Tax Rate (D)/(C)                                                      32.0%                 30.8%                    32.7%                    25.7%

The Company is unable to present a quantitative reconciliation of its forward-looking non-GAAP measure, adjusted effective tax rate, for the year ending December 31, 2021,
to its most directly comparable GAAP financial measure, provision for income taxes divided by earnings (loss) from continuing operations before income taxes, because
management cannot reliably predict all of the necessary components of these GAAP financial measures without unreasonable efforts.  Earnings (loss) from continuing
operations before income taxes includes several significant items, such as restructuring charges, asset impairment charges, charges for the write-off of finance fees, and
the provision for income taxes would include the income tax effect on such items.  The decisions and events that typically lead to the recognition of these and other similar
items are complex and inherently unpredictable, and the amount recognized for each item can vary significantly. Accordingly, the Company is unable to provide a
reconciliation of adjusted effective tax rate to earnings (loss) from continuing operations before income taxes divided by provision for income taxes or address the probable significance
of the unavailable information, which could be material to the Company's future financial results.

   25
RECO NCI LI AT I O N FO R 1Q 20 ADJUSTE D EARNI NG S

26
You can also read