September 2020 Quarterly Update - Eve Investments
←
→
Page content transcription
If your browser does not render page correctly, please read the page content below

P: +61 8 6465 5500
EveInvestments
W: www.eveinvestments.com.au
19 October 2020
September 2020 Quarterly Update
RECORD QUARTER DURING CHALLENGING ECONOMIC CONDITIONS
Group unaudited revenues of $2.1 million for the quarter, an increase of 23% on last quarter
Cash balance increased to $5.4 million from $5.1 million at the end of last quarter
Native honey shipments sell out prior to arrival in China. First order of tea tree honey received
during the quarter
Taiwan becomes a new distribution region with first order received for native and tea tree honey
Registration for Amazon Canada, UK, Japan and Singapore commenced this quarter
Tea tree oil yield forecast to exceed previous year’s harvest
EVE Investments (ASX:EVE, EVE or the Company), an ASX‐listed health, nutrition and wellness company,
has today released its Appendix 4C Report for the three‐month period to 30 September 2020 and is pleased
to provide a review of operational progress during the quarter.
The September quarter saw continued growth in group1 company revenues to a record $2.1 million, the
fourth consecutive quarter of sales growth. This represents a 23% increase on the June quarter and a 50%
increase on the March quarter and is an excellent result given the current global economic uncertainty. The
Company aims to continue to deliver successive quarters of growth as it expands its sales presence in key
regions and adds new territories, notwithstanding challenges posed by COVID‐19 and global economic
conditions. Revenue increases were due to strong demand for our tea tree and honey‐based products. This
demand is in part due to the immunity building properties of our products plus growing brand awareness
from strategic marketing campaigns. In particular, demand for organic tea tree oil has been remarkably
strong with orders well exceeding current farm supply. Whilst the impact of COVID‐19 hasn’t affected the
supply side of our business, the growing consumer interest in natural immunity building and natural anti‐
bacterial products has contributed to an increase in product sales.
As mooted in the June quarterly update (Refer to ASX Announcement on 13 July 2020), a key strength during
COVID‐19 has been EVE’s vertically integrated model. Control of our supply chain and manufacturing facility
has continued to serve the Company well, providing the ability to respond quickly to order requests from
large distributors. Our current manufacturing facility was able to meet all Company and third‐party
production requirements during the quarter and still have available capacity.
1
Group revenue includes the revenue from all 100% owned subsidiaries as well as associates Naturally Australian Products (49%
owned by EVE) and Omni Innovation (38% owned by EVE), the figures for associates are not consolidated into the Appendix 4C.
Page 1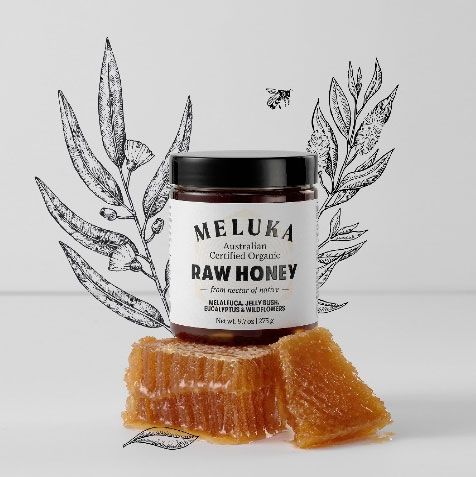
The following is a summary of the breakup of sales by category, region and sales channel for the quarter.

Sales composition by category

            Figure 1: Breakdown of sales across EVE companies by product type in September quarter.

Sales of bulk oils continued to provide a more significant portion of sales. This quarter saw a greater
percentage of sales attributable to bulk oils due to the tea tree harvest in Australia and increased demand
in the US for oil products distributed by Naturally Australian Products (NAP). Meluka Australia’s (Meluka)
products represented a lower proportion of sales this quarter due to the increase in bulk oil sales and large
China orders being placed and accounted for late last quarter. We expect the next series of orders from
China will be in the December quarter to meet ongoing inventory requirements in preparation for Chinese
New Year in Feb 2021. Contract manufacturing revenue is derived from manufacturing product for third
parties and continued to perform well.

Sales composition by Region

               Figure 2: Breakdown of sales across EVE companies by region in September quarter.

US sales continued to represent the largest percentage of sales, while the growing Australian sales numbers
remained relatively constant as a proportion of total sales. China sales were lower for the quarter, as
mentioned previously, due to large orders being placed late last quarter and fulfilled this quarter. First sales
into Taiwan were recorded during the quarter and are in the Other percentage. Distributor sales to markets
like China are variable quarter‐to‐quarter; however, we expect that sales to China and other markets will
continue to grow and comprise a larger percentage of sales throughout 2021 and subsequent financial years.

                                                     Page 2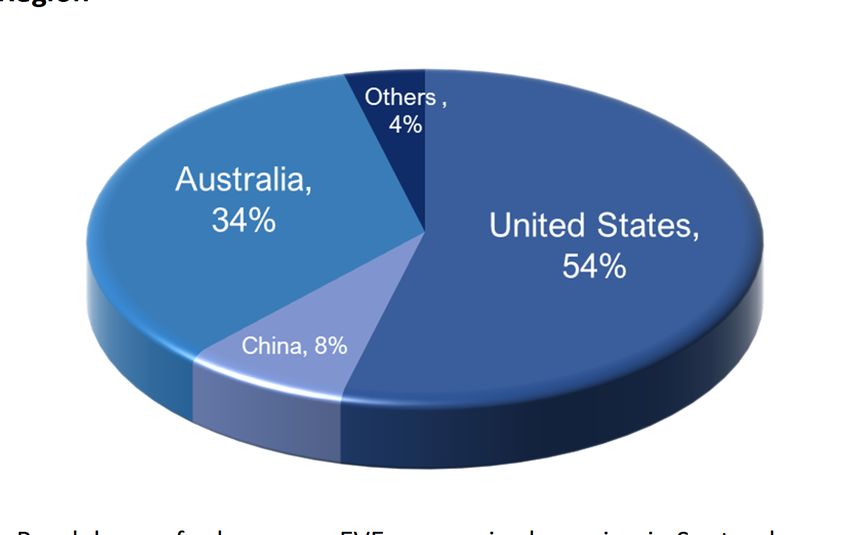
Sales composition by Channel

           Figure 3: Breakdown of sales across EVE companies by sales channel in September quarter.

Wholesale sales made up nearly 80% of the revenue for the quarter. This was mainly attributable to the sale
of tea tree oil from Jenbrook’s tea tree harvest revenue plus the growth experienced by Naturally Australian
Products (NAP) in the US. Jenbrook will complete its commercial plantation harvest in October which will
reduce the overall percentage attributable to wholesale sales in the December quarter.

Operational Progress

Meluka Australia – Highlights for the Quarter

China Distribution
Meluka’s honey range launched in mid‐May through Yandi Biotech’s (Yandi) online portal in China. The first
two shipments of our native raw honey were sent in the previous quarter and sold out prior to the shipments
reaching Shanghai. Due to this growing demand, Yandi provided a third purchase order during the
September quarter, for an additional sea container of 21,120 units of native raw honey. In addition, Meluka
also received an initial order from Yandi for a shipment of 2,112 units of its signature premium tea tree
honey product. This is the third Meluka product to be added to Yandi’s range as the Company continues to
focus on cementing its distribution partnerships and extending current product lines. This order will be
introduced to Yandi’s network on the back of the success of the native raw honey and promoted as a
premium high strength medicinal honey that has a variety of immunity building properties (antioxidant, anti‐
bacterial and anti‐microbial).

The rapid pre‐selling and re‐ordering of product by Yandi provides the Company with further confidence
about its distribution strategy into this large and important market. The Company continues to work closely
with development of marketing collateral for upcoming new product launches (tea tree oil and tea tree
honey) highlighting the uniqueness of the products and key health benefits.

Expectations are that Yandi will place further product orders in the December quarter in preparation for
Chinese New Year.

Taiwan Distribution
In July, the Company opened up a new distribution region after receiving an initial product order from AIFYA
International Group (AIFYA) for a variety of Meluka Australia’s honey product lines. The initial order

                                                    Page 3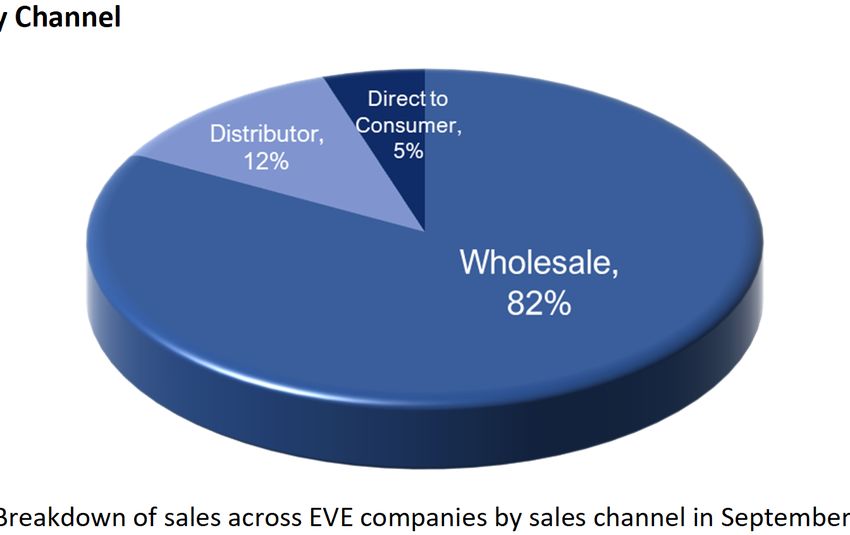
comprised 6,336 units of the raw honey product and 2,112 units of our premium TTF24 tea tree honey. The
purchase order was in line with standard commercial terms received by the Company from distributors.

AIFYA was established in 2009 and is headquartered in Taipei, Taiwan and provides high‐quality health and
wellness products to its member network and includes products from both eastern and western medicine.
Taiwan, with a population of approximately 24 million people, has a relatively high level of disposable
income and a preference for premium food products. Australia is currently the fourth‐largest supplier of
food and beverages to Taiwan.2

USA
The USA continues to be an important market for the Company, with group revenues growing in this market
this quarter. Bulk oil sales via Naturally Australian Products (NAP) is explained in further detail separately in
this report. Meluka branded products continued to perform very well on Amazon. Meluka’s raw native
honey, the first product to be released in the US has established itself a leading honey product with high
favourable consumer ranking. It regularly ranks inside the top 30 leading honey products sold on Amazon in
the USA. The other products in Meluka’s honey range are beginning to increase sales numbers as they attract
more consumer reviews and positive feedback about the products. The probiotics drinks range is a relatively
new product launch in the US and is also gaining sales traction. Over the next few quarters, marketing
initiatives will focus on the probiotic drinks and tea tree honey to increase awareness of their medicinal
attributes. Initiatives will be undertaken via Amazon advertising and social media advertising linked to our
Meluka US website.

The Company is also in discussions with a large US wholefoods distributor to potentially distribute the
Company’s products throughout the US via its store network. The aim is having this distribution arrangement
operating next year, complementing our two online channels and providing a broad market penetration into
the US organics and wholefoods sector.

Australia
Australian online sales for the quarter performed well despite tapering off in September due to our probiotic
drinks selling out. The drinks are the leading sales product in Australia and have performed exceedingly well
given the relatively low marketing budget. New inventory arrived in late September and sales in October
returned to previous levels. In addition, the ‘Original’ flavour was added to the product range. Other flavours
will be introduced in 2021 to further expand of the product range.

The listing on Amazon in Australia has also contributed to increasing sales. Whilst Amazon is relatively new
to Australia its presence is growing and new distribution centres continue to be added. Meluka’s native
raw honey is performing very well on the Amazon platform due to its high level of positive reviews from
the US. It currently is ranked number 1 in the honey category and number 1 in the general grocery
category on Amazon Australia.

Jenbrook
The annual harvest of tea tree from Jenbrook’s tea tree plantation continued through the quarter with
almost 5 tonnes of organic tea tree oil produced. Harvesting will continue into the current quarter with
expectations that operations should be complete by late October. The Company will then focus on its wild
harvesting program to continue to provide oil supply.

2
    https://www.austrade.gov.au/Australian/Export/Export‐markets/Countries/Taiwan/Industries/Food‐and‐beverage

                                                          Page 4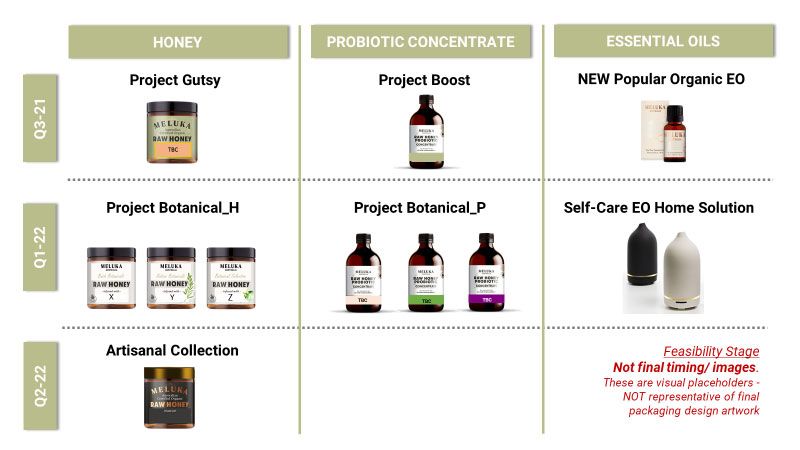
This year has again seen demand far outstrip supply with the Company sourcing third party supply to meet
some of this demand. It has also utilised third party suppliers to provide customer requirements for essential
oils such as lemon myrtle, eucalyptus and a range of other oils.

As previously reported, the Company has been able to achieve a minimum sales price increase of 12.5% on
last year’s average sales price. It is also on track to exceed the yield on last year’s harvest by approximately
10%.

Due to the increasing demand for essential oils, Jenbrook has appointed Beck Howe to the role of Business
Development Manager. Ms Howe is coordinating the supply of tea tree oil from Jenbrook’s properties as
well as managing the sourcing and supply of a variety of other essential oils that Jenbrook’s customers
require. Beck is leveraging the knowledge gained by the NAP team to locate and procure these in‐demand
oils. Ultimately these oils will be needed by Meluka as it develops its own branded range of essential oils.

Naturally Australian Products Inc (49% EVE)
Naturally Australian Products (NAP), a US distribution business recorded revenue of $1.1 million in the
quarter, a 100% increase on the prior quarter. The continued strong performance from NAP is attributable
to a growing demand for essential oils products in the US. NAP has developed strong relationships with
several large skincare businesses and has become a trusted supplier of high‐quality bulk essential oils. These
oils are sourced globally, with Australia being a significant supply source, predominantly for tea tree,
eucalyptus and lemon myrtle oils.

NAP only recently relocated into a new larger warehouse facility to support the expansion of its business
and the expansion of Meluka into the US. During the quarter, an Operations Manager was appointed to
support logistics/operations and post quarter end, NAP also appointed an additional salesperson to its team
to cater for the increased level of enquiry. The company also received its first order from a Chilean company
who is anticipating placing regular orders to meet its supply requirements.
NAP is owned 49% by EVE, accordingly it is accounted for as an investment in an associate, meaning its
revenue is not consolidated into the Appendix 4C.

Marketing & Innovation Update

Consumer Brand Marketing Communications
The September marketing communications campaign highlighted the
introduction of the new Original variant launch to Meluka Australia’s
popular Probiotic Concentrate range. The advertising plan focused
on getting in front of a new and broader target audience to build
brand awareness. This successfully drove new consumers to engage
with the brand across Meluka Australia’s social media pages and
increased Google search impressions on the brand.

                                                     Page 5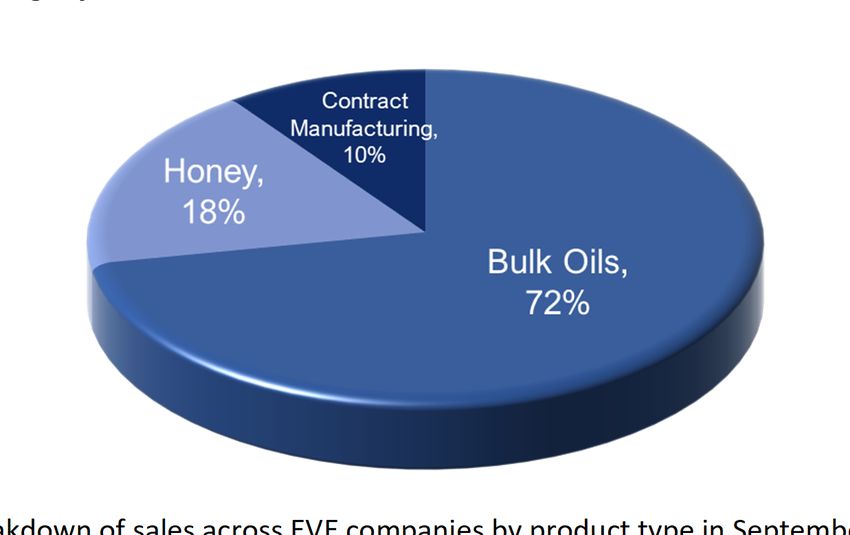
The revised style and tonality of Meluka Australia’s branded assets
                                  which have been updated to reflect the current market trends on social
                                  media has resonated and was well received by consumers. The brand
                                  saw a steep uplift in organic engagement and significant increase in
                                  organic fan following from the previous period.

                                  Direct and personalised consumer communications (CRM) efforts have
                                  been dialled up to actively nurture and close gaps in the consumer
                                  loyalty cycle by reminding and incentivising repurchase.

Innovation Projects
The priority new product development projects currently targeted for 2021 launch are in initial feasibility
stage, forming part of a larger R&D / new product development project slate.

Corporate & Financial Update
During the quarter the Company invited investors and shareholders to attend its investor briefing providing
an update on the company’s operations, with approximately 100 participants in attendance.

The Company also released its 2020 Annual Report during the quarter, a copy of which can be found on the
Company’s website.

In accordance with Section 6 of the Appendix 4C, during the quarter the Company has paid $109,000 in
director fees and $43,000 for a fully provisioned office and administration staff.

                                                  Page 6
Key statistics
Total unaudited group revenue for the quarter was $2.1 million
Cash at bank of $5.4 million
Inventory increased to $0.9 million
Receivables of $0.6 million
Creditors payable of $ 0.5 million
$1 million in debt facilities with $0.5 million drawn
Options converted during the quarter raised $580,600 before costs
Outlook
The Company has commenced the new financial year with a record first quarter of group revenue. With
demand increasing for health and wellness products and growing consumer awareness of the unique
products we produce its expected that revenues will continue to grow. Significantly we are heading into
several critical retail sales periods where demand for product is likely to increase. Key events include
Christmas in Australia, Thanksgiving in the US, Chinese New Year in China and Amazon Prime day across the
Amazon network and Black Friday and Cyber Monday across online networks. Inventory levels will be
increased to cater for expected demand over this period.
Further planned growth initiatives over the next two quarters include the following;
Commencement of sales via Amazon in Canada, UK, Singapore and Japan
Continued sales growth in China for our raw honey, tea tree honey and tea tree oil
Increased sales focus on our premium tea tree honey range ‘TTF24’ and ‘TTF32’ and expansion of
probiotic drinks range in the US this quarter
Finalisation of US partner for distribution across retail store networks
Achieve increased sales volumes domestically across the entire range
Marketing programs to be expanded to build brand and product awareness
Commencement of new product development in preparation of product launches in Q3 FY21
Continued sales of bulk essential oils products from both on‐farm and third‐party suppliers
Research and Development program to include further advancement of tea tree extract and hydrosol
products
Commenting on the update, Managing Director Bill Fry said:
“The September quarter has provided further validation of EVE’s distribution strategy with revenue growth
across all businesses. The interest in our products from Chinese and Taiwanese consumers was particularly
pleasing and bodes well for the introduction of our other products into these regions. In addition, the
success of our native raw honey product on Amazon is paving the way for our other honey products and the
probiotic concentrates on this channel. This is a key strategy we aim to replicate across all regions where we
utilise Amazon.
With the recent additions to our marketing team we continue to actively pursue an aggressive marketing
and promotional strategy. Importantly with the key retail sales events mentioned previously our marketing
team are developing a series of campaigns that will commence next quarter to promote our products and
inform consumers about the key health properties. They will also be commencing new product development
for the additions to our range that we propose to introduce next year.
The EVE team are excited about the progress to date and plans for the next stages of growth.”
Page 7Authorised for release by Bill Fry, Managing Director.
— ENDS —
For more information, please contact:
Company enquiries Media enquiries
Bill Fry Daniel Paperny
Managing Director Mojo Media
Eve Investments Ltd P: +61 433 339 454
+61 8 6465 5500 daniel.paperny@mojomedia.com.au
billf@eveinvestments.com.au
About EVE Investments
EVE Investments (ASX: EVE) is a leading, vertically integrated producer of branded nutrition, health and wellness products. The
Company has global reach and application to fast‐growing markets across Australia and New Zealand, Asia Pacific and North
America. Our mission is to help provide access to the world’s best natural organic products that have demonstrated medicinal
benefits and can help enrich the lives of everyday people.
For further information, please visit www.eveinvestments.com.au and follow us on Twitter @EVEInvestments
1
Group revenue includes the revenue from all 100% owned subsidiaries as well as associates Naturally Australian Products
(49% owned by EVE) and Omni Innovation (38% owned by EVE), the figures for associates are not consolidated into the
following Appendix 4C.
Page 8Appendix 4C
Quarterly cash flow report for entities subject to Listing Rule 4.7B
For the purposes of the consolidated statement of cash flows, only cashflows from EVE, Jenbrook Pty Ltd and Meluka Health are included.
Cashflows from associates Naturally Australian Products and Omni Innovation are not included in the below figures.
Name of entity
EVE Investments Limited
ABN Quarter ended (“current quarter”)
89 106 523 611 30 September 2020
Consolidated statement of cash flows Current quarter Year to date (3
$A’000 months)
$A’000
1. Cash flows from operating activities
1.1 Receipts from customers 1,168 1,168
1.2 Payments for
(a) research and development (24) (24)
(b) product manufacturing and operating costs (448) (448)
(c) advertising and marketing (243) (243)
(d) leased assets (15) (15)
(e) staff costs (455) (455)
(f) administration and corporate costs (263) (263)
1.3 Dividends received (see note 3) ‐ ‐
1.4 Interest received 6 6
1.5 Interest and other costs of finance paid (4) (4)
1.6 Income taxes paid ‐ ‐
1.7 Government grants and tax incentives 60 60
1.8 Other (provide details if material) ‐ ‐
1.9 Net cash from / (used in) operating activities (219) (219)
2. Cash flows from investing activities
2.1 Payments to or for acquire:
(a) entities ‐ ‐
(b) businesses ‐ ‐
(c) property, plant and equipment (109) (109)
(d) investments ‐ ‐
(e) intellectual property ‐ ‐
(f) other non‐current assets ‐ ‐
Page 9Consolidated statement of cash flows Current quarter Year to date (3
$A’000 months)
$A’000
2.2 Proceeds from disposal of:
(a) entities ‐ ‐
(b) businesses ‐ ‐
(c) property, plant and equipment ‐ ‐
(d) investments ‐ ‐
(e) intellectual property ‐ ‐
(f) other non‐current assets ‐ ‐
2.3 Cash flows from loans to other entities ‐ ‐
2.4 Dividends received (see note 3) ‐ ‐
2.5 Other (provide details if material) ‐ ‐
2.6 Net cash from / (used in) investing activities (109) (109)
3. Cash flows from financing activities
3.1 Proceeds from issues of equity securities
(excluding convertible debt securities) ‐ ‐
3.2 Proceeds from issue of convertible debt ‐ ‐
securities
3.3 Proceeds from exercise of options 581 581
3.4 Transaction costs related to issues of equity (16) (16)
securities or convertible debt securities
3.5 Proceeds from borrowings ‐ ‐
3.6 Repayment of borrowings ‐ ‐
3.7 Transaction costs related to loans and ‐ ‐
borrowings
3.8 Dividends paid ‐ ‐
3.9 Other (provide details if material) ‐ ‐
3.10 Net cash from / (used in) financing activities 565 565
4. Net increase / (decrease) in cash and cash
equivalents for the period
4.1 Cash and cash equivalents at beginning of
period 5,138 5,138
4.2 Net cash from / (used in) operating activities (219) (219)
(item 1.9 above)
4.3 Net cash from / (used in) investing activities (109) (109)
(item 2.6 above)
4.4 Net cash from / (used in) financing activities 565 565
(item 3.10 above)
4.5 Effect of movement in exchange rates on cash ‐ ‐
held
4.6 Cash and cash equivalents at end of period 5,375 5,375
Page 105. Reconciliation of cash and cash equivalents Current quarter Previous quarter
at the end of the quarter (as shown in the consolidated $A’000 $A’000
statement of cash flows) to the related items in the
accounts
5.1 Bank balances 1,775 1,138
5.2 Call deposits 3,600 4,000
5.3 Bank overdrafts ‐ ‐
5.4 Other (provide details) ‐ ‐
5.5 Cash and cash equivalents at end of quarter 5,375 5,138
(should equal item 4.6 above)
6. Payments to related parties of the entity and their associates Current quarter
$A'000
6.1 Aggregate amount of payments to related parties and their associates 152
included in item 1
6.2 Aggregate amount of payments to related parties and their associates
included in item 2
Note: if any amounts are shown in items 6.1 or 6.2, your quarterly activity report must include a description of, and an explanation for,
such payments.
7. Financing facilities Total facility amount Amount drawn at
Note: the term “facility’ includes all forms of financing at quarter end quarter end
arrangements available to the entity.
$A’000 $A’000
Add notes as necessary for an understanding of the sources
of finance available to the entity.
7.1 Loan facilities 998 523
7.2 Credit standby arrangements
7.3 Other (please specify)
7.4 Total financing facilities
7.5 Unused financing facilities available at quarter end 475
7.6 Include in the box below a description of each facility above, including the lender, interest rate,
maturity date and whether it is secured or unsecured. If any additional financing facilities have been
entered into or are proposed to be entered into after quarter end, include a note providing details
of those facilities as well.
Business Loan (maturity of 25/03/2034) and Revolving Agri Line Facility (on‐going) provided by ANZ
to Jenbrook Pty Ltd. Interest rate is 2% less than the Business Mortgage Index Rate (variable).
Security provided over the Robyndale farm.
On acquisition of Meluka Health, an existing shareholder loan of $100,613 became a facility of the
group. This loan is unsecured with nil interest and is due on 25/02/2022.
Page 118. Estimated cash available for future operating activities $A’000
8.1 Net cash from / (used in) operating activities (item 1.9) (219)
8.2 Cash and cash equivalents at quarter end (item 4.6) 5,375
8.3 Unused finance facilities available at quarter end (item 7.5) 475
8.4 Total available funding (item 8.2 + item 8.3) 5,850
8.5 Estimated quarters of funding available (item 8.4 divided by item 8.1) 27
Note: if the entity has reported positive net operating cash flows in item 1.9, answer item 8.5 as “N/A”. Otherwise, a figure for
the estimated quarters of funding available must be included in item 8.5.
8.6 If item 8.5 is less than 2 quarters, please provide answers to the following questions:
8.6.1 Does the entity expect that it will continue to have the current level of net operating cash
flows for the time being and, if not, why not?
Answer:
8.6.2 Has the entity taken any steps, or does it propose to take any steps, to raise further cash to
fund its operations and, if so, what are those steps and how likely does it believe that they
will be successful?
Answer:
8.6.3 Does the entity expect to be able to continue its operations and to meet its business
objectives and, if so, on what basis?
Answer:
Note: where item 8.5 is less than 2 quarters, all of questions 8.6.1, 8.6.2 and 8.6.3 above must be answered.
Compliance statement
1 This statement has been prepared in accordance with accounting standards and policies which comply with Listing
Rule 19.11A.
2 This statement gives a true and fair view of the matters disclosed.
Date: 19 October 2020
Authorised by: Bill Fry, Managing Director
(Name of body or officer authorising release – see note 4)
Notes
1. This quarterly cash flow report and the accompanying activity report provide a basis for informing the market about the entity’s activities for the past
quarter, how they have been financed and the effect this has had on its cash position. An entity that wishes to disclose additional information over and
above the minimum required under the Listing Rules is encouraged to do so.
2. If this quarterly cash flow report has been prepared in accordance with Australian Accounting Standards, the definitions in, and provisions of, AASB
107: Statement of Cash Flows apply to this report. If this quarterly cash flow report has been prepared in accordance with other accounting standards
agreed by ASX pursuant to Listing Rule 19.11A, the corresponding equivalent standard applies to this report.
3. Dividends received may be classified either as cash flows from operating activities or cash flows from investing activities, depending on the accounting
policy of the entity.
4. If this report has been authorised for release to the market by your board of directors, you can insert here: “By the board”. If it has been authorised for
release to the market by a committee of your board of directors, you can insert here: “By the [name of board committee – eg Audit and Risk
Committee]”. If it has been authorised for release to the market by a disclosure committee, you can insert here: “By the Disclosure Committee”.
5. If this report has been authorised for release to the market by your board of directors and you wish to hold yourself out as complying with
recommendation 4.2 of the ASX Corporate Governance Council’s Corporate Governance Principles and Recommendations, the board should have
received a declaration from its CEO and CFO that, in their opinion, the financial records of the entity have been properly maintained, that this report
complies with the appropriate accounting standards and gives a true and fair view of the cash flows of the entity, and that their opinion has been
formed on the basis of a sound system of risk management and internal control which is operating effectively.
Page 12You can also read