ISE Industry Forum
CSISG 2020 Full Year & Q4 Results
Announcement

Finance & Insurance Sector
←
→
Page content transcription
If your browser does not render page correctly, please read the page content below
ISE Industry Forum CSISG 2020 Full Year & Q4 Results Announcement Finance & Insurance Sector
DOES CUSTOMER SATISFACTION
STILL MATTER?
Research Shows A Positive Relationship Between Customer Satisfaction And
Financial Performance
    Companies Performing Well on Customer Satisfaction                                   Companies with more satisfied customers generally
            Outperform the Benchmark Index                                                    more resilient even during downturns

                                    Portfolio Outperforms
                                       the Benchmark

                                                                                                                        Better returns
                                                                                                                       during downturns

  Source:
  Note: Fund is named The American Customer Satisfaction Core Alpha ETF (ticker: ACSI)                                                       3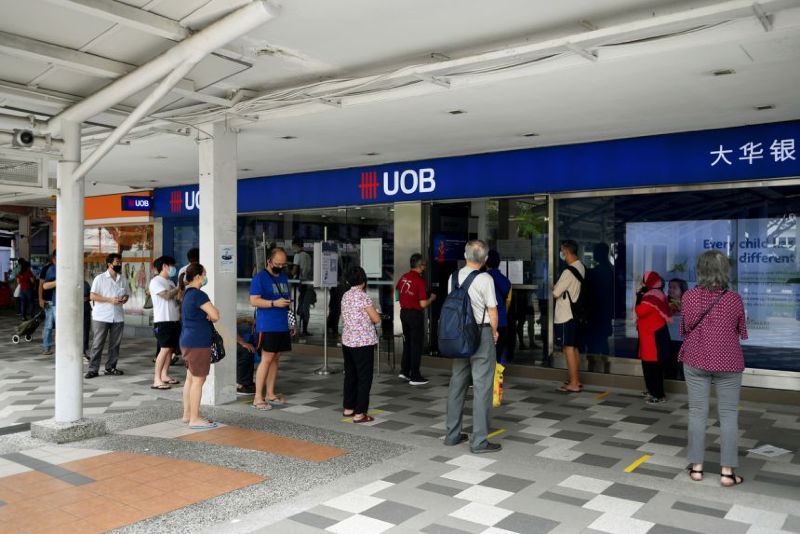
Why Customer Experience & Satisfaction Matters

    Customer              Customer               Customer                 Firm
   Experience            Satisfaction             Loyalty             Performance

• Great customer experiences tend to        •   High repurchase behaviour
  lead to satisfaction or even delight      •   Price insensitivity
• Happy customer tend to be more            •   Positive word-of-mouth
  loyalty to the brand                      •   Higher customer referrals
• Poor experiences tend to lead to          •   Stays longer with brand in downturns
  dissatisfaction, negative word-of-mouth   •   Returns to the brand faster in a
  and even defection                            recovery

                                                                                       4
CSISG METHODOLOGY
How Well Did Companies Satisfy Their Customers?
The CSISG Score

                              Customer
                             Satisfaction
                                CSISG
                           (Scale of 0-100)

                        1. Overall Satisfaction
                    2. Ability to Meet Expectations
                         3. Similarity to Ideal

                                                      6
CSISG Structural Model
       Qn. Perceived Overall Quality
       Qn. Perceived Customisation
       Qn. Perceived Reliability
                                                                                                    Qn. Complaint Behaviour
             Perceived
           Overall Quality                                                                             Customer
              (After Recent
               Experience)
                                                                                                      Complaints

               Qn. Price / Quality      Perceived                             Customer
               Qn. Quality / Price        Value                              Satisfaction

              Customer                                           Qn. Overall Satisfaction
             Expectations                                        Qn. Ability to Meet Expectations
           (Predicted Quality                                    Qn. Similarity to Ideal                 Customer
             Before Recent                                                                                Loyalty
              Experience)

        Qn. Predicted Overall Quality                                                               Repurchase Intention
        Qn. Predicted Customisation     → Denotes positive relationship between the drivers         Price Tolerance
        Qn. Predicted Reliability       → Denotes inverse relationship between the drivers
                                                                                                                              7
Q4 CSISG Fieldwork Methodology

               (For Banking and Credit Cards Local Respondents)
               Singapore citizens and PRs were interviewed at their homes.
               Homes are selected from a random address listing that matches the housing
               profile of Singapore resident population.

               (For Insurance and e-Payments Local Respondents)
               Singapore citizens and PRs were asked to complete an online survey.
               Respondents were randomly selected from a nationally representative online
               panel.

                Each respondent answers up to 21 CSISG questions and about 25 industry-
                specific attribute/touchpoint questions about the company/brand they had
                recent experiences with. Each respondent evaluates only 1 company/brand.

                Typically 50-200 respondents per company would have answered the CSISG
                questionnaire.

                                                                                            8
Overview of Score Calculation

                1                      2                   3                     4
           Company              Sub-Sector                                   National
                                                     Sector Score
            Score                 Score                                       Score

            Company                 Company
                                                      Revenue / GDP Contribution Weights
            Selection                Weights

                                                           Revenue Share Study /
                    Incidence Study
                                                              DOS GDP Data
        •Identify companies with highest             •Identify revenue contribution of
         interactions with locals.                    each sub-sector to its respective
        •Locals survey either through randomised      sector.
         door-to-door interviews or online surveys   •Identify GDP contribution of each
         through nationally representative online     sector to the total GDP of sectors
         panels.                                      measured in the CSISG.
                                                                                           9
CSISG 2020
KEY FACTS
CSISG 2020 Full Year Key Facts

Calendar year 1st   Info-Communications   Total Questionnaires Completed                         19,147
quarter             Retail
                                                        Face-to-Face (Locals)                    5,024
2nd quarter         Air Transport
                    Land Transport                                 Online (Locals)               14,027

                                                                              Tourists*          96
3rd quarter         F&B
                    Tourism                     Distinct entities measured                       264

4th quarter         Finance                Entities with published scores                        101
                    Insurance

                                           * Note: 96 tourists were interviewed for the Wireless@SG
                                           sub-sector from January to March 2020.                         11
Measurement of Most Sub-Sectors Were Shifted Online in 2020
CSISG 2020 Full Year Key Facts
Quarter Measured Face-to-Face Measured Online
Q1 Mobile, Broadband, PayTV, Department stores, Supermarket, Fashion
Wireless@SG Apparel, e-Commerce
Q2 None MRT, Public Buses, Point-to-Point
Transport, Full Service Airlines, Budget
Airlines, Changi Airport
Q3 None Restaurants, Fast Food, Cafe & Coffee
House, Attractions
Q4 Banking, Credit Cards Insurance, e-Payments
Total 6 Sub-sectors 16 Sub-sectors
12CSISG 2020 Q4 Coverage
Banks Credit Cards
Finance &
Insurance
NEW!
Insurance* e-Payments
* Note: Data collection for Insurance sector was done online with locals only, as opposed to face-to-face
interviews in 2019. Life and Health & Medical Insurance were merged as one sub-sector 13CSISG 2020 Q4 Quick Facts
Sectors Covered Finance & Insurance
Survey Period Oct 2020 to Jan 2021
Total Questionnaires Completed 4,720
Face-to-Face (Locals) 3,220
Online (Locals) 1,500
Distinct entities measured 57
Entities with published scores 26
14CSISG 2020 FULL YEAR SCORECARD
CSISG 2020 Q4 RESULTS
FINANCE AND INSURANCE
SECTORS
Drivers & Outcomes Of Satisfaction
     (Finance & Insurance Sectors)

             Perceived
              Quality
                                               Complaints    Customer                      Perceived
                                                            Expectations                    Quality                         Perceived                                                          Customer
                           Perceived
                                       CSISG
                                                            (Predicted Quality                                                                                   CSISG
                                                                                                                              Value                                                             Loyalty
                             Value

                                                                                           (After Recent
                                                              Before Recent
                                                                                            Experience)
             Customer                            Customer
            Expectations                          Loyalty

                                                               Experience)

                           Banks                                 73.6 ▼                         75.9 ▼                           76.6 ▼                           74.0 ▼                            67.3 ▼
                                                                 (-1.4%)                        (-1.9%)                          (-1.5%)                          (-1.7%)                          (-7.0%)

                 Credit Cards                                    72.2                           75.2                             75.6                             72.7                             71.9
                                                                 (-0.5%)                        (-0.4%)                          (-0.4%)                          (-0.1%)                          (-0.6%)

                    Insurance*                                   75.5                           74.9                             72.2                             73.8                             71.4

                   e-Payments
                                                                 77.0                           78.6                                  NA                          79.0                             80.2
                      (New)
                                                                  ▲▼ Statistically significant year-on-year increase/drop at 90% confidence
                                                                     No statistically significant year-on-year change at 90% confidence
                                                                                                                                                                                                               18
         * Note: Data collection for Insurance sub-sector was done online with locals only, as opposed to face-to-face interviews in 2019. Life and Health & Medical Insurance were merged as one sub-sector
◼︎
INSURANCE
Measuring the Insurance Sector
(Rationalising Measurement of the Insurance Sector)

    Product Level                                                       Brand Level
      (Prior to 2020)                                                (From 2020 Onwards)

    Life Insurance
      Sub-sector                                                    Insurance Sector

                            •Methodology: Changed From
   Health & Medical          door-to-door interviews to
 Insurance Sub-sector        online surveys                   Life                   Health & Medical
                            •Rationalisation: Product-     Insurance                    Insurance
                             based sub-sectors collapsed
                             into one overall sub-sector
Motor & Other Personal      •Unchanged: Respondents        Must hold either product to qualify for survey
 Insurance Sub-sector        continue to evaluate their
                             insurer at the brand level
                             regardless of product held

                                                                                                            20
Insurance Sector CSISG Scores
(Customers Who Had Purchased Or Interacted With Their Insurer In The Last 12 Months)
Insurance Sector
CSISG: 73.8
Prudential 74.6
AIA 73.3
Great Eastern 73.2
NTUC Income 72.3
Other insurers 75.1
(E.g. Manulife, Aviva, AXA, etc.)
65 70 75 80
Note: No year-on-year change shown for the Insurance sector as there was a change in data collection methodology from face-to-face in 2019 to 21
online surveys in 2020.Insurance Sector Attributes
2020 Avg Rating
Has a good reputation
Feeling comfortable and safe
Provides prompt service
Makes you feel assured that things will be taken care of
Is innovative and forward-looking
Descending Range of products meet your needs
Order Of Products and services available when you want it
Attributes
Ratings Gives you individual attention
Products appeal to you
Performs services right the very first time
Products and services are presented in a way that is
clear and easy to understand
Proactively helps you when needed
Has your best interest at heart
Promises to do something by a certain time, it will do so
Brand image complements your personality
6.5 7.0 7.5 8.0
Attribute Rating (Scale of 1 to 10) 22Loyalty Drivers: Empathy, Product & Branding Underperformed
(Insurance Attributes: Drivers of Customer Loyalty) 2020 Avg Rating
Provides prompt service Responsiveness
Has your best interests at heart Empathy
Increasing Is innovative and forward-looking Branding
Positive Products appeal to you Product
Impact on
Brand image complements your personality Branding
Loyalty
Score Makes you feel comfortable and safe when insuring Assurance
Range of products that meet your needs Product
Products and services are presented in a way that is
clear and easy to understand
Proactively helps you when needed
Performs services right the very first time
Limited
Impact on Gives you individual attention
Loyalty Has products and services available when you want it
Score
Has a good reputation
Fulfils its promises at the promised time
Makes you feel assured that things will be taken care of
6.5 7.0 7.5 8.0
23
Attribute Rating (Scale of 1 to 10)INSURANCE CHANNELS
Financial Advisor/ Sales Rep Remains The Top Most Interacted Channel
         (Insurance Touchpoints)

                                                                                               % Used The Channel
                          60%
                                      53.9%
% Insurance Respondents

                                                       39.2%

                          30%                                      27.0%
                                                                                   22.4%
                                                                                                    16.8%

                          0%
                                Financial Advisor or   Website     Customer       Mobile App     Contact Centre
                                Sales Representative             Service Centre

                                                                                                                    25
Digital Channel Usage
(Insurance Touchpoints)
% Used The Channel
60% 53.9%
Respondents
% Insurance
39.2%
30% 27.0% 22.4% 16.8%
0%
Financial Advisor or Website Customer Mobile App Contact Centre
Sales Representative Service Centre
Use of Digital Channels
80%
% of Respondents
Digital channels 48.9% 51.1%
used by 1 in 2 40%
insurance
customers
0%
Do Not Use Used
Website/ Mobile App Website/ Mobile App 26Unsurprisingly Digital Users Tend to Be Younger
(Insurance Touchpoints) 100%
% Insurance Respondents
48.9% 51.1%
50%
% Within
Each
Demograp
hic Sub-
Group
0%
Did Not Use Used
Website/ Mobile App Website/ Mobile App
18 to 34 Years 45.1% 54.9%
Age
Group
35 to 59 Years 48.1% 51.9%
60 Years & Above 69.1% 30.9%
% Within Each Demographic Sub-Group
(Row Percentage) 27Digital Channel Users Also Rated Perceived Value & Loyalty Higher
(Insurance Touchpoints) 100%
% Insurance Respondents
48.9% 51.1%
50%
% Within
Each
Demograp
hic Sub-
Group
0%
Did Not Use Used
Website/ Mobile App Website/ Mobile App
Perceived Value 70.5 73.9
Score
(0 to 100)
CSISG 73.0 74.6
Customer Loyalty 69.6 73.1
GREEN/RED score or rating indicates segment performed BETTER/WORSE than those who did not use Website/ Mobile App with statistical significance. 28Satisfaction Highest for Financial Advisor But Lowest for Contact Centre
(Insurance Channel Satisfaction)
% Used The Channel Channel Satisfaction
60% 9.00
Channel Satisfaction (1 to 10 scale)
7.98 7.94
% Insurance Respondents
7.76
7.62 7.58
30% 7.00
0% 5.00
Financial Advisor or Website Customer Mobile App Contact Centre
Sales Representative Service Centre
29Consumer Purchase Funnel
Awareness
Consideration
Purchase
Loyalty
30Purchase Funnel - What Channels Do Customers Prefer
Awareness
Consideration
What is the preferred channel to search
information on insurance?
Purchase
What is the preferred channel to purchase
an insurance?
Loyalty
31Preferred Channels For Search Information & Purchase of Insurance
Preferred channel to search for Preferred channel to purchase
information about insurance insurance
Financial Advisor or
Website 42.3% Sales Representative
51.6%
TOP 2
Financial Advisor or Channels
Sales Representative
36.2% Website 24.0%
Customer Service Customer Service
Centre
11.8% Centre
13.9%
Contact Centre 5.4% Contact Centre 6.5%
Mobile App 4.3% Mobile App 3.9%
0.0% 35.0% 70.0% 0.0% 35.0% 70.0%
32While More Younger Customers Prefer Using Websites to Search for
Information, Financial Advisor Remains The Most Preferred Purchase Channel
Preferred channel to search for Preferred channel to purchase
information about insurance insurance
43.3% 53.6%
Financial Advisor or
Website 43.3% 47.6%
Sales Representative
32.1% 66.9%
38.4% 25.3%
Financial Advisor or
32.0% Website 24.8%
Sales Representative
51.9% 14.2%
9.2% 11.4%
Customer Service Customer Service
13.9% 15.6%
Centre Centre
10.4% 13.7%
6.1% 6.6%
Contact Centre 5.0% Contact Centre 7.0%
5.6% 2.8%
2.9% 3.2%
Mobile App 5.9% Mobile App 5.0%
0.0% 1.1%
0.0% 35.0% 70.0% 0.0% 35.0% 70.0%
18 to 34 Years 35 to 59 Years 60 Years & Above 33CREDIT CARDS
Marginal Movement in Scores Across Issuers
(Most Recently Used Card)
                                        CSISG   CSISG
                                        2019    2020

           Citibank   Credit   Cards   73.5        73.8   HSBC Credit Cards
               DBS    Credit   Cards   73.4        73.5   OCBC Credit Cards
   American Express   Credit   Cards   73.2        73.3   Maybank Credit Cards
           Maybank    Credit   Cards   72.9        73.0   UOB Credit Cards
             HSBC     Credit   Cards   72.8        72.9   American Express Credit Cards
               UOB    Credit   Cards   72.7        72.4   Standard Chartered Credit Cards
              OCBC    Credit   Cards   72.1        72.0   Other Credit Cards
                                                   71.9   Citibank Credit Cards
                                                   71.9   DBS Credit Cards
              Other Credit Cards 71.4

                                                   E.g. of other credit cards includes
                                                   Bank of China, CIMB, Diners Club

                                                                                            35
Service Quality Decline for the Credit Card Sub-Sector
Product
Quality
Perceived
Perceived Perceived Perceived
Service
Quality Product Quality Service Quality Quality
Quality
Credit Cards 75.6 74.9 ▼ 75.2
(+0.5%) (-1.4%) (-0.4%)
▲▼ Statistically significant year-on-year increase/drop at 90% confidence
No statistically significant year-on-year change at 90% confidence 36
◼︎
◼︎
◼︎Decline Stems From Fall in Overall Service Quality & Ability to Meet
Customers’ Service Needs
Product
Quality
Perceived
Perceived Perceived Perceived
Service
Quality Product Quality Service Quality Quality
Quality
Credit Cards 75.6 74.9 ▼ 75.2
(+0.5%) (-1.4%) (-0.4%)
Component Attributes of Perceived Service Quality (Scale of 1 to 10)
7.80 ▼ 7.71▼ 7.71
-1.5% -1.6% -0.6%
Perceived Overall Ability To Meet Reliability of
Service Quality Service Requirements Services
▲▼ Statistically significant year-on-year increase/drop at 90% confidence
No statistically significant year-on-year change at 90% confidence 37
◼︎
◼︎
◼︎Credit Cards Attributes - YOY Movements
2020 Avg Rating
Brand image of the card complements your personality ▲
Has a good reputation
Card benefits such as cashbacks, reward points, privileges
Makes you feel comfortable and safe when using the card
Descending
Order Of Ease of reward redemption
Attributes
Ratings Ease of accessing card balance and transaction information
Card benefits are presented in a way that is
clear and easy to understand ▼
Redemption catalogue that meet my needs
Flexibility of policies such as waiver of charges
Is innovative and forward-looking ▼
▲▼ Statistically significant
Merchant tie-ups that meet your needs
increase/drop between the
2020 and 2019 scores at
7.0 7.6 8.2 90% confidence
Attribute Rating (Scale of 1 to 10) 38CARD USAGE PATTERNS
Increase in Proportion of Customers Using Their Card for Food Delivery
     (Credit Card: Most Recent Spend Category)
                                                                                                                 26.3%         2020
                                      Dining                                                                                   2019
                                                                                                         23.2%

                                                                                            16.1%
                             Food Delivery
                                                         3.8%
                                                                                                        Largest Increase
                                                                                 12.4%
                                    Fashion
                                                                   8.7%

                                                                              11.1%
                                  Groceries
                                                                                       14.9%

                                                                              10.8%
                      Online Marketplace
        (e.g. Lazada, Shopee, Redmart, Zalora)                  6.6%

                                                                       8.7%
                           Local Transport
                                                                                  13.2%

                                                  0.0%
                                      Travel
                                                                              11.1%

                                                                                       14.6%
                                      Others
                                                                                                18.6%

                                                 0%                                   15%                                30%          40
⬆︎
Most Customers Increased Takeout and Food Delivery Due to COVID-19
(CSISG 2020 Results For F&B Sector)
Question: (F&B Sector: Thinking about the COVID-19 situation, did your patronage pattern change? (MA))
Restaurants Fast Food Restaurants Cafés & Coffee Houses
70%
52% 50.5%
% Respondents
39.4% 37.8% 39.5%
36.8% 35.1% 36.4%
35%
34.5%
29.3%
18% 14.9% 16.7%
10.9%
0%
More More More No Change More More More No Change More More More No Change
Home- Take-Away Food Home- Take-Away Food Home- Take-Away Food
Cooked Delivery Cooked Delivery Cooked Delivery
Food Food Food
Combined: 62% Combined: 65% Combined: 57%
41
Multiple responses allowed for this question, hence sum of percentages may not add up to 100%.Increase In Use of Google/ Apple/ Samsung Pay
(Credit Card: Mobile Wallet Usage)
2019 2020
100%
86.6%
77.7%
50%
22.3%
13.4%
0%
Do not use Use
Google/ Apple/ Samsung Pay Google/ Apple/ Samsung Pay
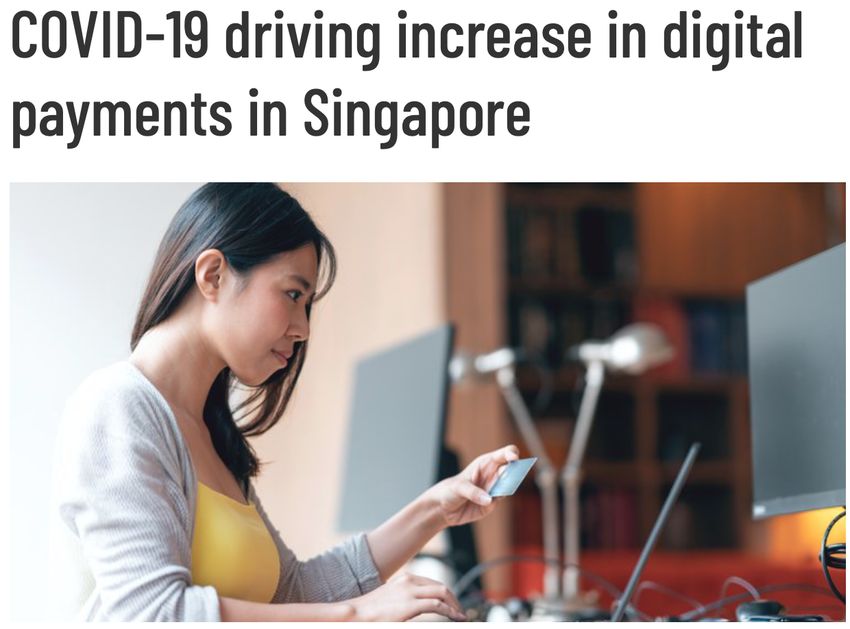
42e-Payments Saw Increased Usage During COVID-19 Health Crisis
DBS:
• 30% are above 50 years
• 30-40% Increase in cashless transactions for
online groceries and online food deliveries
• 11% Fall in volume of cash withdrawals and
deposits during the first 3 months of 2020
• 5% rate of decline in cash transactions yearly
since 2017
UOB:
• Online food orders volume grew yearly by 41%
• Online grocery shopping grew by 44%
• E-commerce transaction volume grew yearly by
36%
OCBC:
• Customer spending increased by
• Up to 50% on food deliveries
• Up to 50% on online video and music
streaming subscription services such as
Netflix and Spotify.
Sources:
• Online grocery spending doubled
(1) https://www.atmmarketplace.com/news/covid-19-leads-to-increased-digital-payments-in-singapore/ • Overall consumer spending fallen by about 10%
(2) https://www.straitstimes.com/tech/more-people-go-cashless-e-payment-volume-soars-amid-covid-19-crisis 43e-Payments Forecasted To See Significant Growth
Report by Worldpay
Projected Significant from FIS
Increase In Transaction
NFC Payments QR Code Payments
Recently debated topic
in Parliament during
Budget 2021
Sources:
(1)Mobile POS Payments - Singapore. (n.d.). Retrieved March 10, 2021, from https://www-statista-com.libproxy.smu.edu.sg/outlook/dmo/fintech/digital-payments/mobile-pos-payments/singapore
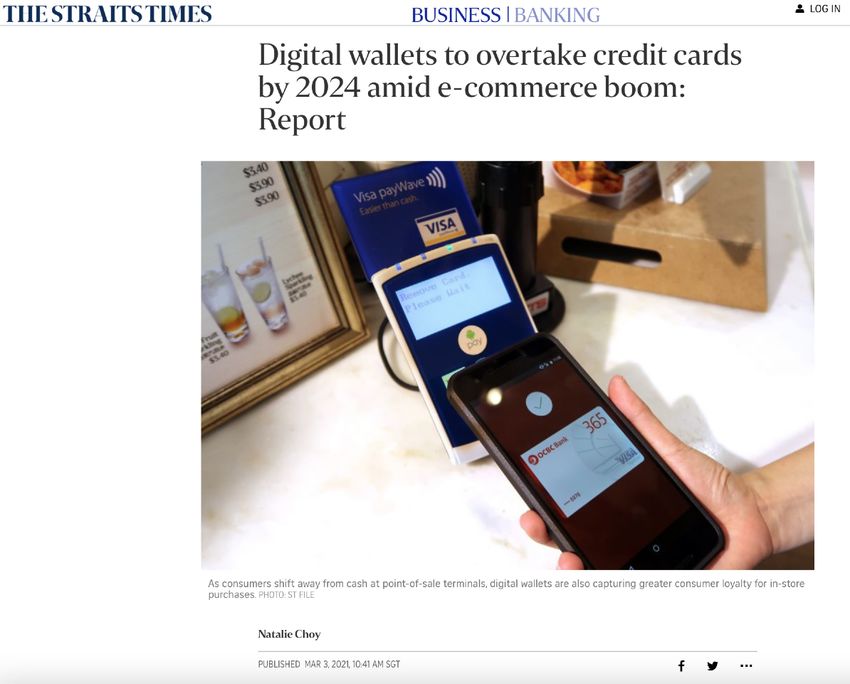
(2)https://www.straitstimes.com/business/banking/digital-wallets-to-overtake-credit-cards-by-2024-amid-e-commerce-boom-report 44
(3)https://www.straitstimes.com/singapore/e-payments-on-the-rise-but-singapore-does-not-aim-to-be-a-cashless-society-ong-ye-kungE-PAYMENTS (NEW SUB-SECTOR)
Who Do We Measure In e-Payments

      Banks Proprietary Payment Apps                Banks mBanking Apps (Scan & Pay)

                                       e-Payments
          Non-banking e-wallets                      Platform Specific Mobile Wallets

                                                                                        46
4 in 5 Respondents Indicated Higher Usage Compared to Last Year
(e-Payments Usage)
e-Payments Usage e-Payments Current Usage Frequency
Compared to 2019 50%
% of e-Payments Respondents
6.0%
14.8% 33.2%
25.8%
25% 22.4%
17.6%
79.2%
More often than last year 0%
Similar to last year Less frequent: 2 to 3 At least 1 - 3 At least 4
Less often than last year The most 1 times a month times a week times a week
time a month
47Higher Usage Associated with Higher Satisfaction, Loyalty, Spend
(e-Payments Usage Frequency)
50%
% of e-Payments 33.2%
Respondents 25.8%
25% 22.4%
17.6%
0%
Less frequent: 2 to 3 At least 1 - 3 At least 4
The most 1 times a month times a week times a week
time a month
CSISG 74.5 75.9 80.8 84.1
Loyalty 73.1 77.2 82.2 86.7
Average Spent per
month
$164.06 $224.47 $289.61 $647.56
GREEN/RED score or spent indicates this group performed BETTER/WORSE than the BOLDED scores/ spent with statistical significance. 48e-Payment Apps CSISG Scores
(Most Recently Used App)
e-Payments Sub-Sector
CSISG: 79.0
DBS PayLah! 80.8
Mobile Banking Apps
79.6
(Scan & Pay)
Grab 76.4
Other e-payment apps 78.0
(E.g. FavePay, Singtel Dash, Apple Pay, etc.)
70 75 80 85
49Credit Card Benefits - Cashback, Rewards Catalogue, Promotions
Cashbacks Rewards Catalogue Promotions
50e-Payments Offering Rewards Systems Similar to Credit Cards
e-Payments Rewards - Cashback, Rewards Catalogue, Promotions
Cashbacks Rewards Catalogue Promotions
51Comparing Credit Cards & e-Payments Attributes
e-Payments
Credit Cards
Has a good reputation
Ease of accessing transaction information
or account balance
Makes you feel comfortable and safe
when using the e-Payment/card
Ease of reward redemption
Is innovative and forward-looking
Redemption catalogue that meet your needs
Brand image complements your personality
Merchant tie-ups that meet your needs
Benefits such as cashback, reward points, privileges
6.5 7.5 8.5
Attribute Rating (Scale of 1 to 10) 52Comparing Credit Cards & e-Payments Attributes
e-Payments
Credit Cards
Has a good reputation
e-Payments
Ease of accessing transaction information
or account balance
statistically higher
Makes you feel comfortable and safe
when using the e-Payment/card
Ease of reward redemption
e-Payments
Is innovative and forward-looking
statistically higher
Redemption catalogue that meet your needs
Brand image complements your personality
Merchant tie-ups that meet your needs e-Payments
statistically lower
Benefits such as cashback, reward points, privileges
6.5 7.5 8.5
Attribute Rating (Scale of 1 to 10) 53Brand-related Attributes Have High Impact On Loyalty For Both
(Credit Cards vs e-Payments - Impact on Loyalty)
Top 5 Loyalty Drivers
Credit Cards e-Payments
Ease of accessing card balance and transaction
Payment process
information
Increasing Positive Impact on Loyalty
Brand image complements your personality Has a good reputation
Flexibility of policies such as waiver of charges Is innovative and forward-looking
Ease of reward redemption Brand image complements your personality
Is innovative and forward-looking Merchant tie-ups that meet your needs
54Several Loyalty Drivers For Credit Cards Underperformed e-Payments
(Top 5 Drivers of Loyalty For Credit Cards: Credit Cards vs e-Payments)
Credit Cards
e-Payments
Ease of accessing transaction information Credit Cards
or account balance statistically lower
Increasing Positive Impact on Loyalty
Brand image complements your personality
For Credit Cards
Flexibility of policies such as waiver of charges
Not measured for e-payments
Ease of reward redemption
Credit Cards
Is innovative and forward-looking
statistically lower
6.5 7.5 8.5
Attribute Rating (Scale of 1 to 10)
55BANKS
Drivers & Outcomes of Satisfaction Declined For Banks Sub-Sector
             Perceived
              Quality
                                               Complaints
                                                             Customer                      Perceived
                                                            Expectations                    Quality                         Perceived                                                          Customer
                                                                                                                                                                 CSISG
                           Perceived
                             Value     CSISG
                                                            (Predicted Quality
             Customer
            Expectations
                                                 Customer
                                                  Loyalty     Before Recent
                                                                                           (After Recent                      Value                                                             Loyalty
                                                                                            Experience)
                                                               Experience)

                           Banks                                 73.6 ▼                         75.9 ▼                           76.6 ▼                           74.0 ▼                            67.3 ▼
                                                                 (-1.4%)                        (-1.9%)                          (-1.5%)                          (-1.7%)                          (-7.0%)

                 Credit Cards                                    72.2                           75.2                             75.6                             72.7                             71.9
                                                                 (-0.5%)                        (-0.4%)                          (-0.4%)                          (-0.1%)                          (-0.6%)

                     Insurance*                                  75.5                           74.9                             72.2                             73.8                             71.4

                   e-Payments
                                                                 77.0                           78.6                                  NA                          79.0                             80.2
                      (New)
                                                                   ▲▼ Statistically significant year-on-year increase/drop at 90% confidence
                                                                      No statistically significant year-on-year change at 90% confidence                                                                       57
         * Note: Data collection for Insurance sub-sector was done online with locals only, as opposed to face-to-face interviews in 2019. Life and Health & Medical Insurance were merged as one sub-sector
◼︎
Banks: Marginal Movement in CSISG Score
CSISG CSISG
2019 2020
Citibank 75.7
DBS 75.6
OCBC 75.1
74.7 OCBC
74.7 UOB
UOB 74.3 74.5 Maybank
HSBC 74.2 74.5 HSBC
Maybank 74.0 73.8 DBS
73.8 Standard Chartered
Standard Chartered 73.6 73.6 Citibank
73.3 Other banks
Other banks 72.5
E.g. of other banks includes
Bank of China, CIMB, RHB.
Note: To qualify as a bank respondent, they must have an active CASA in their own name in which they carry most of their 58
monthly transactions with, and have interacted with at least one of the touchpoints in the last 3 months.Closing the Gap: Score Difference Between Highest and Lowest Ranked Bank
Narrowed In 2020
Highest Scoring Bank Lowest Scoring Bank
76
75.7
75.3
Gap of 74.7
74.5 Gap of
CSISG Score (0 to 100 scale)
74 3.2-pts 1.4-pts
Gap of Gap of
2.5-pts 4.0-pts 73.3
73.1
Gap of 72.5
72
2.3-pts 72.0
71.3
70.8
70
Citibank
Citibank
Banks
Banks
Banks
Banks
Banks
OCBC
Other
Other
Other
Other
Other
DBS
DBS
68
2016 2017 2018 2019 2020
59Loyalty Score Declined Significantly in 2020
76
Customer Loyalty 70 71.5
72.4
70.3 70.9
(Score: 0-100 scale)
67.3▼
64
2016 2017 2018 2019 2020
▲▼ Statistically significant increase/drop between the 2020 and 2019 scores at 90% confidence
60
No statistically significant change between the 2020 and 2019 scores at 90% confidence
◼︎Decline in Customer Loyalty Stem from A Fall In Price Tolerance
76
Customer Loyalty 70 71.5
72.4
70.3 70.9
(Score: 0-100 scale)
67.3▼
64
2016 2017 2018 2019 2020
The next time you are choosing Repurchase How much can your main bank raise its
a BANK, how likely will it be Price Tolerance fees and charges before you definitely
Intention (Percentage)
your main bank again? (Rating: 1 -10 scale) would not choose them again?
(All Bank Respondents) (For bank respondents who rated repurchase intention from 6 -10)
8.5 15.0%
7.87 7.78 9.9%
7.64 7.67 9.3% 9.4% 9.4%
7.49
7.5 7.5% 5.0%▼
6.5 0.0%
2016 2017 2018 2019 2020 2016 2017 2018 2019 2020
▲▼ Statistically significant increase/drop between the 2020 and 2019 scores at 90% confidence
61
No statistically significant change between the 2020 and 2019 scores at 90% confidence
◼︎
◼︎Banks Attributes - YOY Movements
2020 Avg Rating
Brand image of the bank complements your personality ▲
Branding
Is innovative and forward-looking ▲ 77.0
Has a good reputation
Has your best interests at heart ▲ Empathy
Gives you individual attention ▼ 76.6
Has products and services available when you want it
Fulfils its promises at the promised time
Reliability
76.5
Performs services right the very first time ▼
Makes you feel assured that things will be taken care of ▲
Products and services are presented in a way that is Assurance
clear and easy to understand 76.3
Makes you feel comfortable and safe when banking ▼
Range of products that meet your needs ▼ Product
Products appeal to you ▼ 76.0
Provides prompt service Responsiveness
Proactively helps you when needed ▼ 75.3
7.0 7.6 8.2
▲▼ Statistically significant increase/drop between the 2020
and 2019 ratings at 90% confidence Attribute Rating (Scale of 1 to 10) 62Banks Attributes: Both Product-related Attributes Saw Declines
2020 Avg Rating
Brand image of the bank complements your personality ▲
Branding
Is innovative and forward-looking ▲ 77.0
Has a good reputation
Has your best interests at heart ▲ Empathy
Gives you individual attention ▼ 76.6
Has products and services available when you want it
Fulfils its promises at the promised time
Reliability
76.5
Performs services right the very first time ▼
Makes you feel assured that things will be taken care of ▲
Products and services are presented in a way that is Assurance
clear and easy to understand 76.3
Makes you feel comfortable and safe when banking ▼
Range of products that meet your needs ▼ Product
Products appeal to you ▼ 76.0
Provides prompt service Responsiveness
Proactively helps you when needed ▼ 75.3
7.0 7.6 8.2
▲▼ Statistically significant increase/drop between the 2020
and 2019 ratings at 90% confidence Attribute Rating (Scale of 1 to 10) 63Timeline of Industry-Wide Decline In Interest Rates For CASA
• OCBC 360, OCBC Bonus+
Savings, OCBC Premier
Dividend+ Savings, OCBC Child
Development, OCBC Plus! • OCBC 360 • Standard Chartered Current
Savings, NTUC-OCBC Starter, • HSBC Advance, HSBC & Savings Account
• Standard Chartered JumpStart, Everyday Global • DBS Multiplier
SCB Bonus$aver,
• DBS Multiplier
• UOB One Start of CSISG End of CSISG
Q4 fieldwork Q4 fieldwork
period period
May 2020 Jul 2020 Aug 2020 Oct 2020 Dec 2020 Jan 2021 Feb 2021
• DBS Multiplier • UOB One • Maybank iSAVvy, • OCBC 360
• OCBC 360 • BOC Smart Saver Maybank Prestige,
• UOB One Maybank Privilege Plus
Sources:
(1) https://www.straitstimes.com/business/banking/banks-here-cut-deposit-rates-in-line-with-global-markets
(2) https://mothership.sg/2020/12/dbs-multiplier-interest-rates/
(3) https://www.straitstimes.com/business/banking/ocbc-again-cuts-interest-rates-on-flagship-savings-account
(4) https://blog.seedly.sg/best-savings-accounts-singapore/
(5) https://blog.seedly.sg/uob-one-savings-account-review/
(6) https://blog.seedly.sg/ocbc-360-savings-account-review/ 64
(7) https://cutt.ly/AzSS18BANK CHANNEL USAGE
Significant Decline In Branch Interactions

                                                                                                                         2017            2018    2019        2020
                              100%
Interacted With Channel (%)

                              75%

                              50%

                              25%

                               0%
                                            ATM or          Mobile App          Internet Banking           Contact Centre               Branch    Personal Banker
                                     Self-Service Machine

                                                                                                                                                                    66
                                                              Statistically significant increase/drop between 2020 and 2019 at 90% confidence
Impact of COVID-19: Branch Closure & Reopening With Safe Management
Self-disinfecting coating being applied to ATMs (Image:
UOB)
Branch Status During Circuit Breaker
DBS Closed 29 - 28 remained open Reopening of Branches
• Full bank operations resume (OCBC -25June, UOB-20 Aug,
UOB Closed 24 - 38 remained open DBS - Prioritised services for elderly and vulnerable
OCBC Closed 22 - 24 remained open customers)
• Safe Entry check-ins, increased frequency in cleaning at
Maybank Closed 8 - 9 remained open branches, ATMs & auto lobbies
SCB Closed 8 - 8 remained open • Commercial grade self-disinfecting coating at high-touch
areas including branch counters and meeting areas
HSBC Closed 7 - 6 remained open
Citi Closed 4 - 4 remained open
Sources:
(1) https://milelion.com/2020/04/06/which-bank-branches-will-still-be-open-during-the-circuit-breaker/
(2) https://www.straitstimes.com/business/banking/uob-to-resume-full-branch-operations-in-singapore-most-ocbc-and-dbs-branches-reopen 67
(3) https://www.finews.asia/finance/31918-banks-practice-caution-as-singapore-exits-circuit-breaker-uob-dbs-ocbcCOVID-19 Accelerated Growth of Digital Channels
100% Used Internet Banking/Mobile App
Digital Channels 80%
76.9%
Interacted With Channel (%)
75%
% of Bank Respondents
75%
50% 72.1%
70% 69.4%
25%
67.3%
2017
2018
2019
2020
0% 65%
ATM or Mobile App Internet Banking Contact Centre 2017Branch 2018 Personal2019
Banker 2020
Self-Service Machine
6860 Years & Above: Increase in Usage For Both Mobile App & Internet Banking
Digital Channels Staff Channels
18 to 34 Years
100%
50%
2017
2018
2019
2020
0%
35 to 59 Years
100%
50%
0%
60 Years & Above
100%
50%
0%
Mobile App Internet Banking Contact Centre Branch
69
Statistically significant increase/drop between 2020 and 2019 at 90% confidenceBANK CHANNEL SATISFACTION
Satisfaction With Several Channels Declined
                                                                                           2020
         Personal banker/                               7.75                               2019
       Relationship manager                                  7.86

                                                     7.70
                     Branch                                                   Statistically
                                                            7.85
                                                                               Significant
                                                   7.65                       Decline from
                 Mobile App                                                       2019
                                                           7.82

                                            7.51
 ATM or Self-Service Machine
                                            7.50

                                       7.40
            Internet Banking                                                  Statistically
                                                          7.79                 Significant
                                     7.37                                     Decline from
              Contact Centre                                                      2019
                                                          7.80

                               7.0       7.5                       8.0               8.5
                                     Satisfaction Rating (Scale of 1 to 10)
                                                                                                  71
Contact Centre Reported The Lowest Satisfaction Scores & Had Biggest
Decline
2020
Personal banker/ 2019
Took long to get connected to the staff on the line Staff has lack of patience when assisting me on the
Relationship manager
and staff was unable to resolve the matter. They can line, seems to be rushing to get the information I
install callback system so we don’t need to wait so need and end the call. Being a customer service
long on the line, canBranch
be more responsive as well by personnel, they need to improve on their service
having a call back from a staff that is able to handle standard and always ready to handle difficult
my matter be it going to be successful or not customers if there is a need
Mobile App Called the customer service hotline to clarify my
Need to wait very long until I get connected on the
products with them, staff was not knowledgeable with
line, a bit too much from them. Feel that if they have
the bank's products and even being rude to me. I
a callback system with a waiting time given will be
ATM or Self-Service Machine think that they need to make sure customer services
better so customers don’t need to wait on the line to
are up to standard with close monitoring to prevent
get connected
this kind of things to happen
Internet Banking
-5.5%
Contact Centre
7.0 7.5 8.0 8.5
Satisfaction Rating (Scale of 1 to 10)
72Satisfaction Ratings Across Age Groups
2020 2019
18 to 34 Years 35 to 59 Years 60 Years & Above
7.62 7.71 ▼ 7.38
Digital Channels
Mobile App
7.73 7.87 NA: Small Sample
7.42 ▼ 7.34 ▼ 7.74
Internet Banking
7.93 7.68 7.65
7.56 ▼ 7.70 ▼ 8.04 ▲
Staff Channels
Branch
7.86 7.89 7.65
7.49 7.33 ▼ 7.19
Contact Centre
7.74 7.79 NA: Small Sample
7.0 7.6 8.2 7.0 7.6 8.2 7.0 7.6 8.2
▲▼ Statistically significant increase/drop between
2020 and 2019 ratings at 90% confidence
Satisfaction Rating (Scale of 1 to 10) 7360 Years & Above: Higher Satisfaction with Branch
2020 2019
18 to 34 Years 35 to 59 Years 60 Years & Above
7.62 7.71 ▼ 7.38
Digital Channels
Mobile App Mobile App
7.73 7.87 NA: Small Sample
7.42 ▼ 7.34 ▼ 7.74
Internet Banking Internet Banking
7.93 7.68 7.65
7.56 ▼ 7.70 ▼ 8.04 ▲
Staff Channels
Branch Branch
7.86 7.89 7.65
7.49 7.33 ▼ 7.19
Contact Centre Contact Centre
7.74 7.79 NA: Small Sample
7.0 7.6 8.2 7.0 7.6 8.2 7.0 7.6 8.2
▲▼ Statistically significant increase/drop between
2020 and 2019 ratings at 90% confidence
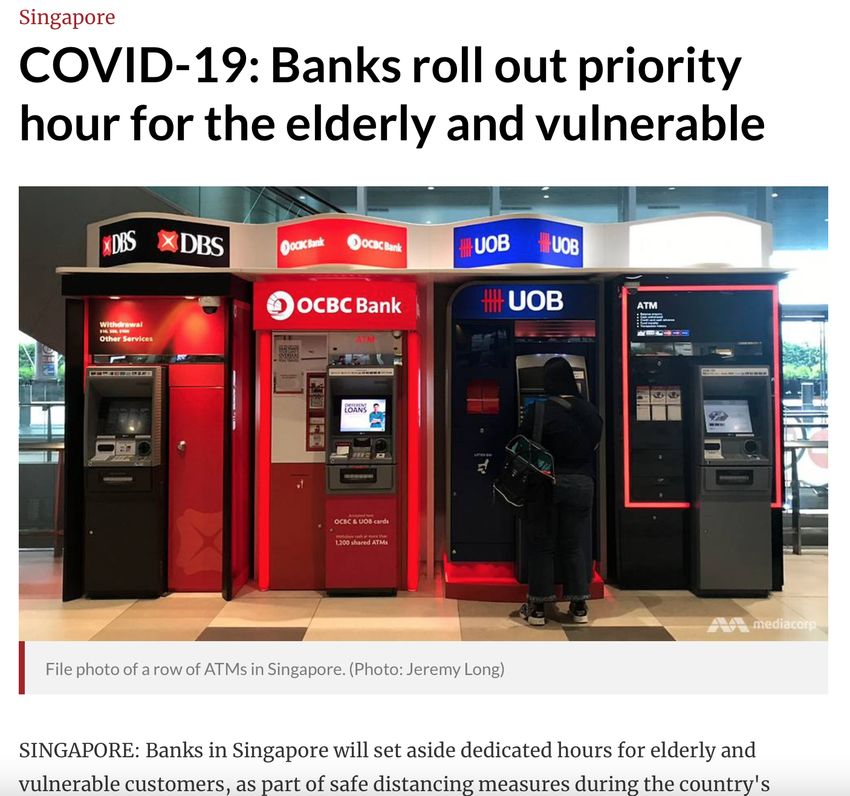
Satisfaction Rating (Scale of 1 to 10) 74“UOB announced on Tuesday (Apr 7) that the first hour of
operations at its branches would be reserved for customers
deemed "vulnerable", such as those above 60 years old, who
have disabilities or are pregnant.”
“DBS will roll out a similar initiative on Thursday, with the
first hour of banking operations set aside for the elderly,
pregnant mothers and customers with disabilities.”
“In addition to the temporary closures, banks have also been
implementing the recommended measures in light of the
COVID-19 pandemic.
These include limiting the number of customers allowed in a
branch at any point in time, making sure customers stand at
least a metre apart, as well as temperature screenings and
health declarations before entry.”
Sources: 75
(1) https://www.channelnewsasia.com/news/singapore/covid-19-banks-announce-priority-hour-elderly-vulnerable-12617880Drivers of Satisfaction & Loyalty: Shift In Drivers for Banks
Impact on CSISG Impact on Loyalty
2020 2019 2020 2019
Products and services are
Makes you feel assured that Has your best interests at
Provides prompt service presented in a way that is
things will be taken care of heart
clear and easy to understand
Performs services right the Proactively helps you when
Provides prompt service Provides prompt service
very first time needed
Products and services are
Proactively helps you when Proactively helps you when Has your best interests at
presented in a way that is
needed needed heart
clear and easy to understand
Gives you individual Gives you individual Makes you feel assured that
Has a good reputation
attention attention things will be taken care of
Brand image of the bank
Makes you feel comfortable Makes you feel comfortable Is innovative and forward-
complements your
and safe when banking and safe when banking looking
personality
Legend: Assurance Responsiveness Empathy Reliability Branding
76WILLINGNESS TO TRY DIGITAL BANKS
Full Digital Bank Licenses Have Been Award
                    The Monetary Authority of Singapore (MAS) announced on 4 December 2020 the four successful digital
                    bank applicants. Two Were Awarded Digital Full Banks and the other two Digital Wholesale Bank.

                                                                                                     Full digital bank license — Awarded

                                                                                                   Full digital bank license — Shortlisted

Sources:                                                                                                                                        78
(1) https://www.mas.gov.sg/news/media-releases/2020/mas-announces-successful-applicants-of-licences-to-operate-new-digital-banks-in-singapore
Willingness To Apply for Products Through New Digital Banks
Banking customers are less willing to apply products with new Digital Banks in 2020 as opposed
to the year before
Question on Willingness to Apply for Products on Digital Banks
“Now, which of the following products would you be
willing to apply for through a digital bank?
▲
62.7% ▲ 37.3%
Not Willing To Apply Willing To Apply
For Any Products For Products
2019 2019
56.7% 43.3%
▲ Statistically significant increase from 2019
▲ 79
Statistically significant decrease from 2019Whilst Most Segments Are Less Willing To Apply for Products Through a Digital Bank,
60 Years & Above Are Now More Willing Compared to 2019
Not Willing To Apply Willing To Apply
For Products For Products
2019 2020 2019 2020
▲
56.7% ▲ 62.7% 43.3% 37.3%
18 to 34 Years 44.1% ▲ 56.0% 55.9% ▲ 44.0%
▲
Age 35 to 59 Years 56.6% ▲ 66.0% 43.4% 34.0%
▲
60 Years & Above 82.9% 64.7% 17.1% ▲ 35.3%
% Within Each Demographic Sub-Group
(Row Percentage)
80What Were They Willing To Try:
Willingness to apply for credit cards and loans have dropped from 2019 however, willingness to apply for
savings account has increased
Which of the following products would you be
willing to apply for through a digital bank? n=1550
Not Willing To Apply Any Product Willing To Apply
62.7% 37.3%
59.2%
Credit Cards 99.7%
36.2%
Current or Savings Account 18.5%
11.7%
Insurance 18.7%
7.3%
Investment 14.5% 2020
6.4% 2019
Loans 48.2%
0% 50% 100%
% of Respondents
(2020 n=578)
(2019 n = 619)
Multiple responses allowed, hence percentages may not add up to 100%
81Why Were They Willing To Try:
Curiosity is the key reason in willing to try Digital Banks. It is then followed with elements of convenience
and processes
Which of the following were your reasons for your
willingness to use digital banks? n=1550
Not Willing To Apply Any Product Willing To Apply
62.7% 37.3%
Try something new 82.2%
Greater convenience 42.6%
More simplified processes 38.3%
Better customer service that meet my needs 26.8%
Better products that cater to my needs 20.1%
Better security 17.8%
More attractive rates 12.4%
0% 50% 100%
% of Respondents (n=578)
Multiple responses allowed, hence percentages may not add up to 100%
82Why Were They NOT Willing To Try:
While being used to visiting branch and security are key reasons not to try Digital Banks, preference for
human interaction has seen the biggest increase from 2019
Which of the following products would you be
willing to apply for through a digital bank? Why not? n=1550
Not Willing To Apply Any Product Willing To Apply
62.7% 37.3%
32.7%
Used to visiting the branches 36.4%
Feel that online transaction 30.4%
is not secure or is risky 32.4%
21.9%
Prefer human interaction 13.3%
14.4%
Do not know how to use 18.0%
Not familiar with digital 9.7% 2020
2019
banking companies NA
0% 25% 50%
% of Respondents
(2020 n=972)
(2019 n=811)
Multiple responses allowed, hence percentages may not add up to 100% 83Key Takeaways
• National Trending: National CSISG marginal decline in scores, led by fall in Banks.
• Banks: Decline across various metrics, as well as digital and non-digital touchpoints.
Digitisation trends accelerated with more older customers using digital channels. Assurance
and Reliability now more critical.
• Credit Cards & e-Payment: Credit cards declined in service quality and shift in usage
especially towards food delivery. Card issuers should consider how best to compete with the
rise of e-payments, which outperformed Credit Cards in various areas including its key loyalty
drivers.
• Insurance: Digital channels key in terms of usage and information search. Continue to invest
in digital channels as users are more loyal. Work on empathy and product related attributes.
84Q&A
ISE Industry Forum
CSISG 2020 Q4 Results Announcement

Finance & Insurance Sector
You can also read