NFI:TSX INVESTOR PRESENTATION - March 2019 - New Flyer's Xcelsior H2 fuel-cell electric heavy-duty bus - NFI Group
←
→
Page content transcription
If your browser does not render page correctly, please read the page content below
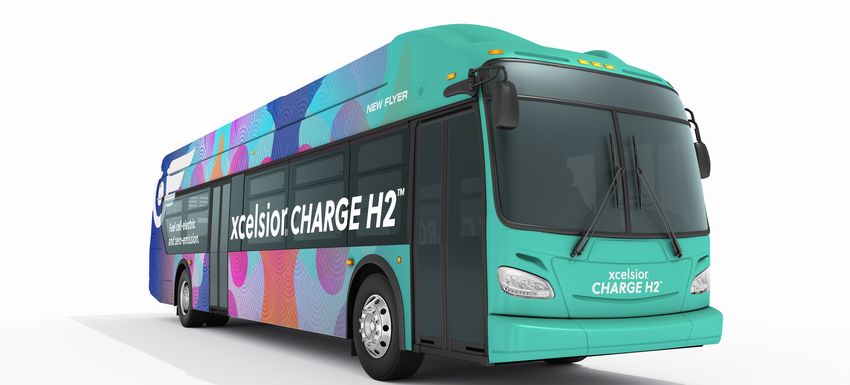
NFI:TSX
INVESTOR PRESENTATION
March 2019

New Flyer’s Xcelsior H2
fuel-cell electric heavy-duty bus
Leader in Transit Buses, Motor Coach & Aftermarket

             FY2018 Equivalent Units (EUs) Deliveries                                                                                FY2018 Revenue by Product

                                                             1,030
                                                                                                                                                            $584                 Motor coach
                                                                                  Motor coach
                                                                                                            Heavy-duty transit bus

                                             4,313 EU                                                                                         $2,519M*
                                                                                                                                     $1,502                      $42
                                                                     502
                          2,781                                                                                                                                                   Low-floor cutaway and
                                                                                                                                                                                    medium duty bus
                                                                                                                                                            $377
                                                                                    Low-floor cutaway and
                                                                                      medium duty bus
                                                                                                                                                    $15
                                                                                                                                                                            Aftermarket parts

    Heavy-duty transit bus                                                                                                                          Fiberglass reinforced
                                                                                                                                                          polymer

    All figures are in U.S. dollars unless otherwise noted
    See Appendix for Forward Looking Statements and Financial Terms, Definitions and Conditions

2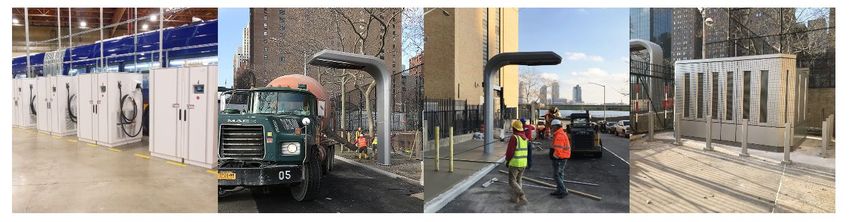
Strategically

    •   Proven LEAN operations track record                                                                                                                            Acquired US OEM of low-floor

    •   Demonstrated margin expansion                                                                                                                                 cutaway and medium-duty buses

    •   Accretive acquisitions
    •   Exceptional ability to integrate                                                                                                                                   Acquired assets of US
                                                                                                                                                                            Fiberglass supplier

    •   Strategic part fabrication
                                                                         Acquired US manufacturer of HD
                                                                          transit buses & parts distributor                                                                 Acquired Can/US
                                                                                                                                                                             FRP Supplier
                                                                                                                                                                                                      $2,519
                                                                                                                                                                               $2,382
                                                                                                                                                          $2,274
                                                                           Acquired Orion (transit bus
                                                                          parts business) from Daimler                      Acquired North America’s
                                                                                                                          leading manufacturer of motor
                                                                                                                              coach & parts/service

                                                                        Global bus body manufacturer
                                                                                                                                   $1,539
                                                                           equity investment in NFI           $1,451
               Acquired US part       NFI converted from
               fabricator in 2010   IDS to Common Share                          $1,199
                   $984                   $926             $865

                                                                                                                                                               $289                     $318               $315
                            $97                                                             $95                    $107                     $151
                                                  $80             $61

                       2010                  2011           2012                      2013                      2014                    2015                2016                    2017                2018
                                                                                               Revenue ($M)        Adj. EBITDA ($M)

3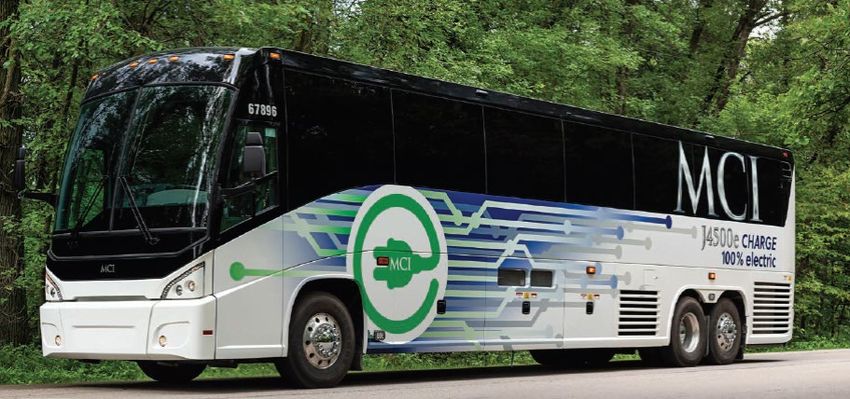
Why Invest In NFI?
North American leader in heavy-duty transit, motor coach, low-floor cutaway and aftermarket parts
Trusted business partner for over 87 years delivering and standing behind reliable products. Focused on total cost
of ownership
Five year revenue compound annual growth rate of 16.0% driven by accretive acquisitions, organic growth and
vertical integration
Leading Adjusted EBITDA margin within its public company peer group(1)
Peer leading dividend yield with history of growing dividends
Vertically integrated fabrication processes (where NFI owns the drawings) to control Cost-Time-Quality
Propulsion agnostic on proven common platforms: clean diesel, natural gas, hybrid and zero-emission (trolley,
battery and fuel-cell)
Solid backlog with multi-year visibility
Track record of innovation – electric trolleys, low-floor transit buses, CNG propulsion, battery-electric, low-entry
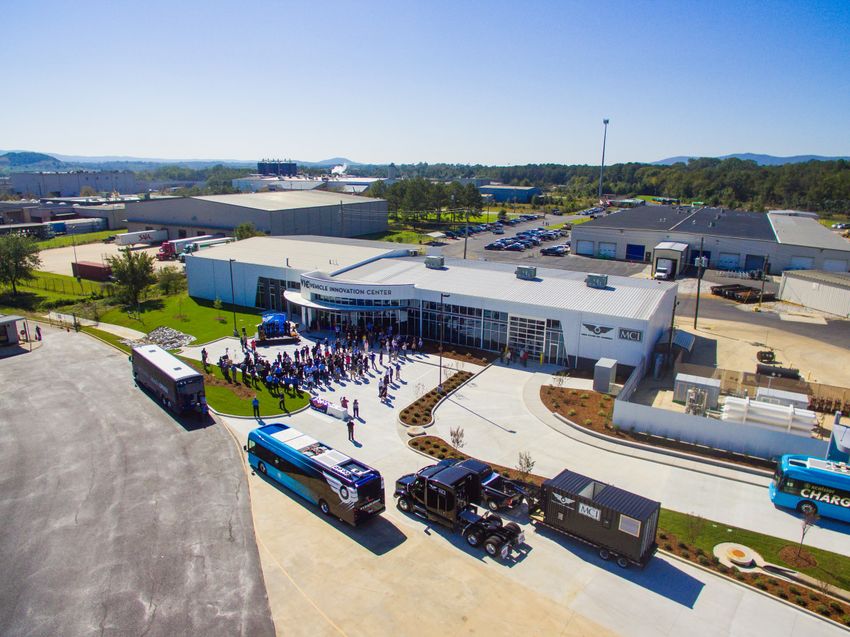
motor coach, Vehicle Innovation Center, Infrastructure Solutions
Providing leading solutions to move groups of people safely, efficiently, responsibly, and in style
(1) Public company peer group includes: REV Group Inc., Spartan Motors Inc., Blue Bird Corporation, Grande West Transportation Group Inc., Oshkosh Corporation, Thor Industries Inc., Winnebago Industries Inc.
4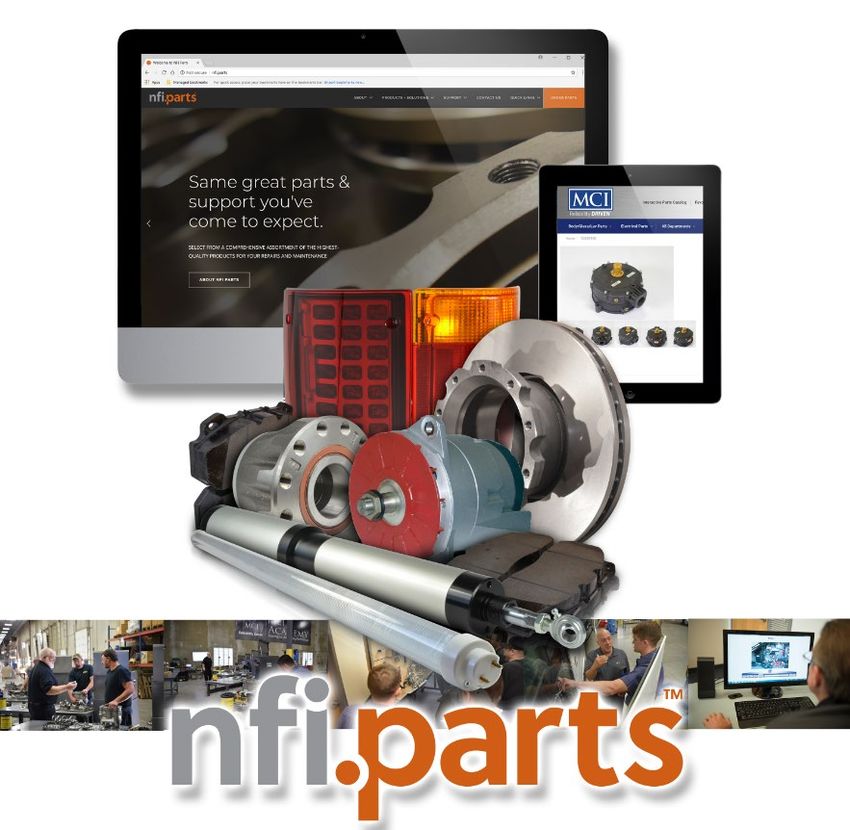
Financial Performance

                Revenue by Segment 2014 - 2018                                 Revenue by Segment 2014 - 2018
                                                                                                        13.4%
                                                                                            12.7%                     12.5%
                                                          $2,519
                                                 $2,382                                                 $318           $315
                                $2,274
                                                          $377
                                                                                  9.8%
                                                  $369
                                 $383                                                                   $72            $74
                                                                                            $289

                                                                   7.4%
               $1,539                                                                        $76
      $1,451
               $322
       $319                                                                       $151
                                                          $2,142
                                                 $2,013
                                $1,891                             $107            $61                  $246           $242
                                                                                            $181
               $1,217                                              $50
      $1,132
                                                                                   $90
                                                                   $57

       2014    2015              2016             2017    2018     2014           2015      2016        2017           2018

                      Manufacturing      Aftermarket                      Manufacturing   Aftermarket    Adj. EBITDA Margin

5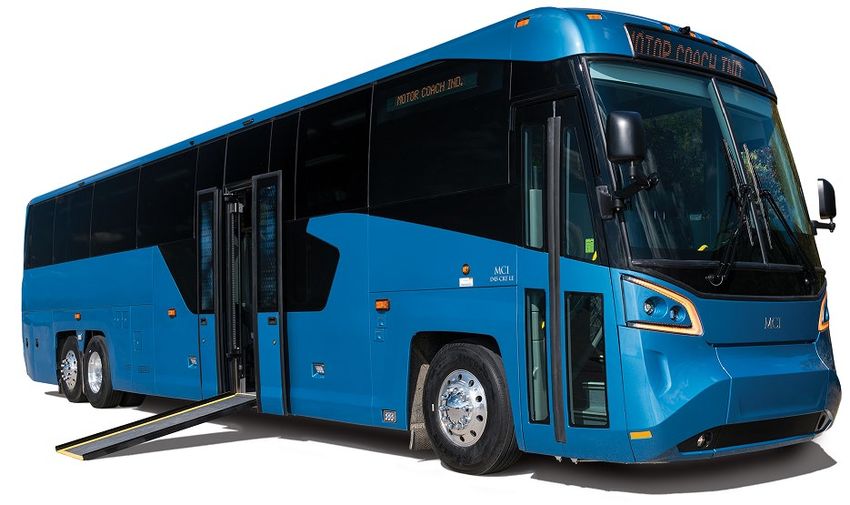
Heavy Duty Transit and Motor Coach Markets
HD Transit Bus Market – EUs delivered and New Flyer Market Share* Motor Coach Market – Units Delivered in Can/US and MCI Share*
6,504
7,000 7,000
6,236
74%
6,336
6,032
5,933
69%
5,816
5,795
5,533
6,000
5,347
6,000
5,284
5,388
62% 63% 63% 62%
5,154
5,212
5,109
5,009
5,128
5,010
5,055
60% 57% 56%
4,723
5,000 5,000
51% 52%
4,333
4,047 50%
56%
46% 45%
44% 42% 43%
4,000 4,000
48% 39%
3,001
38% 37%
2,819
44%44% 43%43%
42% 41%
2,385
2,324
2,470
3,000
2,305
3,000
2,357
38% 37% 36% 37% 37% 37%
2,274
2,092
2,048
35% 34% 35%
1,918
1,852
1,825
1,783
1,756
32%
1,648
1,581
1,510
30%
1,479
1,341
2,000 2,000
1,184
26% 25%
20%
1,000 1,000
- -
Metropolitan Urban Municipal Limo Employee
20 operators 200 operators 900+operators
Public Transit Line Haul/Fixed Route Tour & Charter
19% 27% 41% 6% Shuttle
39% 33% 28%
3%
New Flyer’s Core Markets
* Sourced from New Flyer databases and Management estimates
6 ** Sourced from MCI database and Management estimates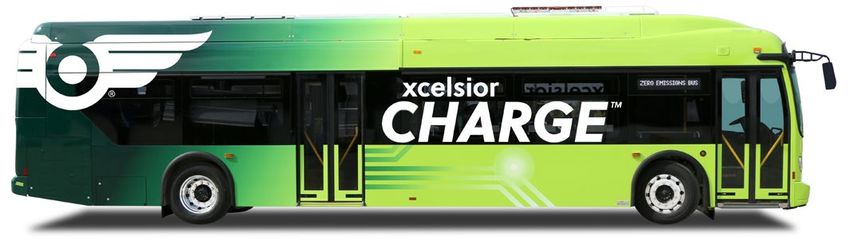
North American Transit Leader
HD Transit Bus Market Share – 2018 Deliveries Public Bid Universe & Active Opportunities (EUs)*
25,000
20,000
20%
4% 15,000
4%
10,000
6,504 EU
43% 5,000
29%
-
Q4 2011
Q1 2012
Q2 2012
Q3 2012
Q4 2012
Q1 2013
Q2 2013
Q3 2013
Q4 2013
Q1 2014
Q2 2014
Q3 2014
Q4 2014
Q1 2015
Q2 2015
Q3 2015
Q4 2015
Q1 2016
Q2 2016
Q3 2016
Q4 2016
Q1 2017
Q2 2017
Q3 2017
Q4 2017
Q1 2018
Q2 2018
Q3 2018
Q4 2018
Estimated active North America Transit Bus Fleet* Bids in Process Bids Operator
Submitted Forecasted 5 year
buy**
EUs 670 2,061 20,694
54% 31% 12% 3% Others
Orion Parts and NABI acquired by NFI in 2013
80,000 BUSES IN SERVICE
* Bid universe is primarily applicable to New Flyer, but MCI also sells to public transit agencies that would be included in totals above
** Management estimate of future expected industry procurement in the next five years based on discussions directly with individual
U.S. and Canadian transit authorities
^ Sourced from APTA Public Transportation Factbook 2016
7 * Sourced from New Flyer database and Management estimates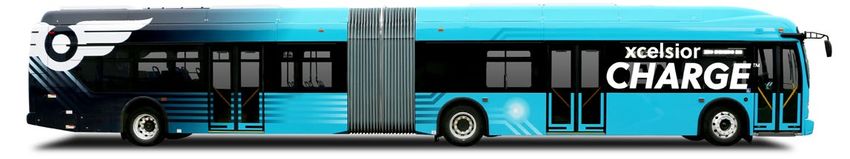
The Motor Coach Leader
    Motor Coach Market Share – 2018 Deliveries                                              Motor Coach 2018 Market Deliveries By Segment

                                                                                                                 Limo
                                     30%                                                                         11%

                                                                                                                                      Tour/Chart
                         2%                                                                         Public/Tra                            er
                                                                                                      nsit                              35%
                                  2,305 Units                                                         19%        2,305 Units
                        24%
                                                      45%         MCI Share increased                 Employee
                                                                  by 4% in 2017
                                                                                                       Shuttle
                                                                                                        9%              Line Haul /
                                                            Negligible Deliveries to date
                                                                                                                           Fixed
                                                                                                                           Route
                                                                 Spain         US
                                                                                                                           26%

     Active North American Motor Coach Fleet

                    51%                           24%            19%         6%

                                55,000 UNITS
    * Source: MCI Database and Management estimates
8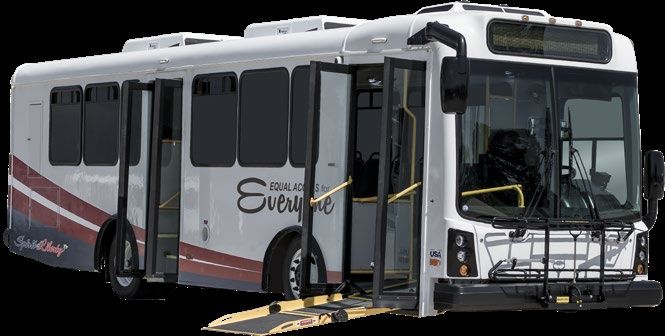
Innovator in Low-Floor Cutaway & Medium Duty Buses
           North American Cutaway Market (2018 ~16,000 units)*                              North American Cutaway, Medium Duty and Trolley
                                                                                                    Annual Demand ~16,000 Units*

        Overall Cutaway Market                     Low Floor Cutaway Market                    9,100

                16,000 EU

                                                          20%    5%
                            30%                                                                                    5,175
                                                                                                                                    Equess
                                                          ~670 Units                                                               targeting
                                                                                                                                   growth in
                                    4%                                                       ARBOC opportunity
              64%                                                                                                                     this
                                           2%                                                  to gain share with
                                                                                                                                    market
                                                                75%                           customer transition
      Disruption opportunity for                                                             to low-floor cutaway
               ARBOC                                                                                                                  1,270
                                                                                                                                                           300

                                                                                Vehicle
     High-floor with lift     High-floor without lift                                       Small Cutaway     Medium Cutaway Medium Duty Transit         Trolley
                                                                                 Type

                                                                               Bus Life         4 year            5 to 7 year      7 to 10 year          7 years
     Low floor cutaway        Low floor – other
                                                                               ARBOC            Spirit of      Spirt of Freedom   Spirt of Liberty   Spirit of America
                                                                               Models        Independence        and Mobility      and Equess

                                                                              Competition      Champion, StarCraft, Goshen,       Vicinity, ADL,     Hometown Trolley
                                                                                                  Ekhart Coach, Glaval             El Dorado

    * Source: ARBOC Management estimates
9
Industry’s Most Comprehensive Parts Offering
Largest parts and service provider in the industry, providing nearly $400
million in parts annually to major U.S. transit agencies
Added value through unique offerings (Kits, Mid-life upgrade programs,
Vendor Managed Inventory (VMI), KanBan, etc.)
Secured six vendor managed inventory programs during 2018 YTD.
Expected to provide positive benefit to NFI Parts business in 2019 and
beyond
Expertise and direct access to over 250 bus and coach engineers, which is
critical to cost-effective and timely parts procurement, quality and availability
Website offering state of the art on-line sales and distribution features
Best-in-class training and publications – MCI Academy accredited by the
Automotive Service Excellence (ASE) & recipient of Grand National
Excellence in Training Award from ASE Training Managers Council (ATMC)
10Significant Backlog – Solid Foundation, Position of Strength
Book-to-Bill (new firm plus option orders divided by deliveries
7,000 180%
10,833 EU 87% ~2.4x
6,000 160%
140%
5,000
120%
4,000 100% Total Backlog at Dec. 31, 2018 Q4-18 LTM Total Backlog EUs to
80%
3,000 (Firm Orders and Options) Book to Bill ratio Annual Production
60%
2,000
40%
1,000 20%
- 0%
2014 2015 2016 2017 2018
LTM New Orders (EUs) LTM Deliveries (EUs) LTM Order Intake / Deliveries
Total Backlog Firm and Option EUs Option History, Conversion and Current Status (EUs)
ARBOC Public backlog
added in Q4-17 2,500 79% 81%
Firm = 3,649 EUs Options = 7,184 EUs
12,000 MCI Public backlog 73% 71%
added in Q4-15
10,000 2,000
54%
8,000 1,500
6,000
1,000
4,000
500
2,000
0 -
2014 2015 2016 2017 2018 2019 2020 2021 2022
Firm Option Options expired Options exercised Current option expiry Annual conversion rate
11Strong Balance Sheet and Cash Flow Generation
FY2018 Adjusted EBITDA to Free Cash Flow Reconciliation ($M) Free Cash Flow and Dividends (C$M)
$216.3
49.6% $206.9 $210.5
42.9%
36.8%
31.2%
$108.3 25.0%
$90.3
$76.1
$65.5
Total Leverage Ratio^ vs Credit Covenant $54.0
4.0 4.0
3.75 3.75 $32.5 $33.8
3.25
NFI Target
2.91 leverage
2.0x – 2.5x
2014 2015 2016 2017 2018
1.94 2.09
1.84
1.65 Free Cash Flow Dividends Payout Ratio
2014 2015 2016 2017 2018
Credit Covenant Total Leverage
12 ^Under NFI Senior Credit Agreement, Total Leverage Ratio did not include Convertible Debentures as debt.Capital Allocation: 2012 to 2018
business and growth
Capital Expenditures Maintenance capital, facility upgrades, LEAN implementation,
Invest in current
$245 USD IT harmonization, insourcing and parts fabrication
Acquistions $676 USD
Dividends increased by 39.5% in May 2017, by 15.4% in May 2018 and 13.3% in
Return capital to
Dividends C$418 March 2019. Now $1.70/share paid quarterly.
Shareholders
NCIB launched in June 2018 allowing for repurchase of up to 5,549,465 NFI shares.
NCIB C$89 797,800 shares purchased year to date in 2018*
13Leader in Zero Emission Buses
Battery-Electric
Fuel Cell Electric
Trolley Electric
Electric Coach (testing)
• Common Xcelsior Platform available in 35-foot, 40- • Support mobility projects from start to finish,
foot and 60-foot lengths • Focus on energy management optimization,
• Industry leading range capability of 100kWh to • Provide infrastructure planning and development
818kWh of electricity • Provide cohesive transition of bus fleets to zero-
• Range of up to 260 miles (418 km) emission electric technology
• Completed FTA Altoona test program
14Investing for Growth and Margin Improvement
New Products Technology
New MCI D Models
60’ fuel cell and battery electric
webstore
Spirit of Equess
Optimize
Defend
Diversify
Grow
KMG Fabrication (Shepherdsville)
Winnipeg / Anniston Expansion
Part Fabrication
15Proud of our History, Excited About our Future
1. Execute on 2019 Annual Operating Plan focusing on customer satisfaction, market share & EBITDA
performance
2. Invest in IT Harmonization (Oracle) at MCI
3. Continue investing in MCI recovery, new models and common line (D and J coach) production
4. Assist ARBOC with sourcing, fabrication, optimization and growth. Assess electrification
5. Complete commissioning of KMG part fabrication facility (Shepherdsville, KY)
6. Drive electrification and autonomous agenda for Bus and Coach
7. Continue facility rationalization.
- Anniston expansion allows for insourcing and welding move from leased building
- Announced TCB closure in Q1-19 (Elkhart, IN) to combine with Shepherdsville, KY
8. Generate strong free cash flow and return cash to shareholders through dividends and NCIB
9. Continue investigating further M&A to diversify and grow
16Appendix 17
Forward Looking Statements
 FORWARD LOOKING STATEMENTS

 •   Certain statements in this presentation are “forward looking statements”, which reflect the expectations of management regarding the Company's future growth, results of operations, performance and business prospects and opportunities. The words “believes”,
     “anticipates”, “plans”, “expects”, “intends”, “projects”, “forecasts”, “estimates” and similar expressions are intended to identify forward looking statements. These forward-looking statements reflect management's current expectations regarding future events and operating
     performance and speak only as of the date of the Financial Statements and associated Management’s Discussion and Analysis dated March 13, 2019. Forward-looking statements involve significant risks and uncertainties, should not be read as guarantees of future
     performance or results, and will not necessarily be accurate indications of whether or not or the times at or by which such performance or results will be achieved. A number of factors could cause actual results to differ materially from the results discussed in the forward-
     looking statements. Such differences may be caused by factors which include, but are not limited to, availability of funding to the Company's customers to purchase transit buses and coaches and to exercise options and to purchase parts or services at current levels or at
     all, aggressive competition and reduced pricing in the industry, material losses and costs may be incurred as a result of product warranty issues and product liability claims, changes in Canadian or United States tax legislation, the absence of fixed term customer contracts
     and the suspension or the termination of contracts by customers for convenience, the current U.S. federal "Buy-America" legislation may change and/or become more onerous, inability to achieve U.S. Disadvantaged Business Enterprise Program requirements, local
     content bidding preferences and requirements under Canadian content policies may change and/or become more onerous, trade policies in the United States and Canada (including USMCA, tariffs, duties, surtaxes and the Canadian federal Duties Relief Program) may
     undergo significant change, potentially in a manner materially adverse to the Company, production delays may result in liquidated damages under the Company's contracts with its customers, inability of the Company to execute its planned production targets as required for
     current business and operational needs, currency fluctuations could adversely affect the Company's financial results or competitive position in the industry, the Company may not be able to maintain performance bonds or letters of credit required by its existing contracts or
     obtain performance bonds and letters of credit required for new contracts, third party debt service obligations may have important consequences to the Company, the covenants contained in the Company’s senior credit facility could impact the ability of the Company to fund
     dividends and take certain other actions, interest rates could change substantially and materially impact the Company's profitability, the dependence on limited or unique sources of supply, the timely supply of materials from suppliers, the possibility of fluctuations in the
     market prices of the pension plan investments and discount rates used in the actuarial calculations will impact pension expense and funding requirements, the Company's profitability and performance can be adversely affected by increases in raw material and component
     costs, the availability of labor could have an impact on production levels, new products must be tested and proven in operating conditions and there may be limited demand for such new products from customers, the Company may have difficulty selling pre-owned coaches
     and realizing expected resale values, inability of the Company to successfully execute strategic plans and maintain profitability, development of competitive products or technologies, catastrophic events may lead to production curtailments or shutdowns, dependence on
     management information systems and risks related to cyber security, dependence on a limited number of key executives who may not be able to be adequately replaced if they leave the Company, employee related disruptions as a result of an inability to successfully
     renegotiate collective bargaining agreements when they expire, risks related to acquisitions and other strategic relationships with third parties, inability to successfully integrate acquired businesses and assets into the Company’s existing business and to generate accretive
     effects to income and cash flow as a result of integrating these acquired businesses and assets. NFI cautions that this list of factors is not exhaustive. These factors and other risks and uncertainties are discussed in NFI’s press releases and materials filed with the
     Canadian securities regulatory authorities which are available on SEDAR at www.sedar.com.

 •   Although the forward-looking statements contained in this presentation are based upon what management believes to be reasonable assumptions, investors cannot be assured that actual results will be consistent with these forward-looking statements, and the differences
     may be material. These forward-looking statements are made as of March 13, 2019 and NFI assumes no obligation to update or revise them to reflect new events or circumstances, except as required by applicable securities laws.

 FINANCIAL TERMS, DEFINITIONS AND CONDITIONS

 •   References to “Adjusted EBITDA” are to earnings before interest, income taxes, depreciation and amortization after adjusting for the effects of certain non-recurring and/or non-operations related items that do not reflect the current ongoing cash operations of the Company
     including: gains or losses on disposal of property, plant and equipment, unrealized foreign exchange losses or gains on non-current monetary items, fair value adjustment for total return swap, non-recurring transitional costs or recoveries relating to business acquisitions,
     equity settled stock-based compensation, gain on bargain purchase of subsidiary company, fair value adjustment to acquired subsidiary company's inventory and deferred revenue, past service costs, costs associated with assessing strategic and corporate initiatives and
     proportion of the total return swap realized. “Free Cash Flow” means net cash generated by operating activities adjusted for changes in non-cash working capital items, interest paid, interest expense, income taxes paid, current income tax expense, effect of foreign
     currency rate on cash, defined benefit funding, non-recurring transitional costs relating to business acquisitions, past service costs, costs associated with assessing strategic and corporate initiatives, defined benefit expense, cash capital expenditures, proportion of the total
     return swap realized, proceeds on disposition of property, plant and equipment, gain received on total return swap settlement, fair value adjustment to acquired subsidiary company's inventory and deferred revenue and principal payments on capital leases. References to
     "ROIC" are to net operating profit after taxes (calculated as Adjusted EBITDA less depreciation of plant and equipment and income taxes at the expected effective tax rate) divided by average invested capital for the last twelve month period (calculated as to shareholders’
     equity plus long-term debt, obligations under finance leases, other long-term liabilities, convertible debentures and derivative financial instrument liabilities less cash). References to "Adjusted Net Earnings" are to net earnings after adjusting for the after tax effects of certain
     non-recurring and/or non-operational related items that do not reflect the current ongoing cash operations of the Company including: gains or losses on disposal of property, plant and equipment, unrealized foreign exchange losses or gains on non-current monetary items,
     fair value adjustment for total return swap, non-recurring transitional costs or recoveries relating to business acquisitions, equity settled stock-based compensation, gain on bargain purchase of subsidiary company, fair value adjustment to acquired subsidiary company's
     inventory and deferred revenue, past service costs, costs associated with assessing strategic and corporate initiatives and proportion of the total return swap realized. References to "Adjusted Earnings per Share" are to Adjusted Net Earnings divided by the average
     number of Shares outstanding.

 •   Management believes Adjusted EBITDA, ROIC, Free Cash Flow, Adjusted Net Earnings and Adjusted Earnings per Share are useful measures in evaluating the performance of the Company. However, Adjusted EBITDA, ROIC, Free Cash Flow, Adjusted Net Earnings and
     Adjusted Earnings per Share are not recognized earnings measures under IFRS and do not have standardized meanings prescribed by IFRS. Readers of this presentation are cautioned that ROIC, Adjusted Net Earnings and Adjusted EBITDA should not be construed as
     an alternative to net earnings or loss or cash flows from operating activities determined in accordance with IFRS as an indicator of NFI’s performance, and Free Cash Flow should not be construed as an alternative to cash flows from operating, investing and financing
     activities determined in accordance with IFRS as a measure of liquidity and cash flows. Reconciliations of net earnings and cash flows to Adjusted EBITDA, Free Cash Flow to cash flows from operations and net earnings to Adjusted Net Earnings are provided in the MD&A

 •   NFI's method of calculating Adjusted EBITDA, ROIC, Free Cash Flow, Adjusted Net Earnings and Adjusted Earnings per Share may differ materially from the methods used by other issuers and, accordingly, may not be comparable to similarly titled measures used by other
     issuers. Dividends paid from Free Cash Flow are not assured, and the actual amount of dividends received by holders of Shares will depend on, among other things, the Company's financial performance, debt covenants and obligations, working capital requirements and
     future capital requirements, all of which are susceptible to a number of risks, as described in NFI’s public filings available on SEDAR at www.sedar.com.

                                                                                                                                                                                                                                     •   All figures are in U.S. dollars unless otherwise noted.

18
NFI’s 2018 Q4 and Fiscal 2018 Results
Quarterly Analysis:
Revenue up $7.4M or 1.1% with growth in manufacturing from higher average transit bus selling price, offset by lower transit and coach volumes and
lower aftermarket volumes
Adjusted EBITDA down $10.6M, or 11.7%, improved transit margins were offset by lower volumes, pricing pressure on new and pre-owned coach
and startup losses incurred for Shepherdsville parts facility, also impacting EBITDA was the termination of the Setra Distribution Rights Agreement
Net earnings decreased by $33.3M, or 43.8% primarily from higher income tax expense, interest and depreciation. Tax variance impacted by U.S. tax
reform in December 2017 which resulted in a $9 million income tax recovery in Q4 2017
Adjusted Earnings per Share down by $0.59 primarily from items impacting Net earnings
Total backlog down 1,324 EUs driven by slower bid activity in the second half of 2018
Fiscal 2018:
Revenue up $129.7M or 5.8%
Adjusted EBITDA down $2.6M or 0.8%
Adjusted EPS down $0.16 or 13.3%
Revenue ($M) Adj. EBITDA ($M) Adj. EPS (basic) Backlog (EU)
12,157
-0.8% -13.3% -10.9%
+5.8% $2,519 $318 $3.09 10,833
$315
$2,382
$2.68
2017 2018 2017 2018 2017 2018 2017 2018
19Operating Performance Metrics
Adjusted EBITDA per new EU delivered ($000 US) Aftermarket EBITDA Margin %
21.9%
21.8%
(2) 20.6%
69.9 20.6% 20.9%
20.5% 20.3%
65.1 20.2%
65.5 19.9%
62.4 62.3
59.8 19.5%
56.0 57.4 56.5 55.6
54.3 18.6% 18.6%
18.6% 18.8% 18.5%
(1) 51.2
45.3
17.3%
37.7
16.3% 16.2%
34.1 34.6
16.0%
25.8
23.9
20.2 14.2%
14.0
Adjusted EBITDA/Revenue 4 per. Mov. Avg. (Adjusted EBITDA/Revenue)
Adjusted EBITDA/EU 4 per. Mov. Avg. (Adjusted EBITDA/EU)
(1) MCI acquired in December 2015
(2) ARBOC acquired in December 2017
20Environmental Leadership with Propulsion Options
Clean Diesel Natural Gas Electric Trolley Hybrid Electric Battery Electric/
Fuel Cell
Xcelsior
35’, 40’, 60’
D Model 40’, 45’
J Model 45’ with 35’
MCI eCoach
launching Q1 2019 Currently Testing
Low- Floor Cutaway
Medium Duty
Transit/Shuttle
New Flyer Leadership in Zero Emissions Buses (ZEB)
NF has delivered >6,900 transit buses powered by electric motors (including hybrids, trolleys, battery-electric and fuel cell-electric)
Battery-electric J Model motor coach currently undergoing testing in U.S. markets
21Group Leadership
Paul Soubry
President and CEO
Joined in 2009
Janice Harper Chris Stoddart Ian Smart Brian Dewsnup
Executive Vice President Human Resources President President President
Joined in 1998 Transit Bus Motor Coach NFI Parts
Joined in 2008 Joined in 2011 Joined in 2006
Glenn Asham
Executive Vice President and
Chief Financial Officer
Joined in 1992
David White
Executive Vice President Supply Management
Joined in 1996
Colin Pewarchuk
Executive Vice President General Counsel
Joined in 2006
22You can also read