Barclays Global Consumer Staples Conference - Barclays 2020 Ravi Saligram - President and Chief Executive Officer Chris Peterson - Chief Financial ...
←
→
Page content transcription
If your browser does not render page correctly, please read the page content below

Barclays Global Consumer
 Staples Conference

Ravi Saligram – President and Chief Executive Officer
Chris Peterson – Chief Financial Officer and President, Business Operations

             Barclays 2020
Forward Looking Statements
Some of the statements in this presentation and its exhibits, particularly those anticipating future financial performance, business prospects, growth, operating strategies, the impact of the COVID-19 pandemic
and similar matters, are forward-looking statements within the meaning of the U.S. Private Securities Litigation Reform Act of 1995. These statements generally can be identified by the use of words or phrases,
including, but not limited to, “intend,” “anticipate,” “believe,” “estimate,” “project,” “target,” “plan,” “expect,” “setting up,” "beginning to,” “will,” “should,” “would,” “resume,” “are confident that,” "remains optimistic that,"
or similar statements. We caution that forward-looking statements are not guarantees because there are inherent difficulties in predicting future results. Actual results may differ materially from those expressed
or implied in the forward-looking statements. Important factors that could cause actual results to differ materially from those suggested by the forward-looking statements include, but are not limited to:

  •      our ability to manage the demand, supply and operational challenges due to the actual or perceived effects of the COVID-19 pandemic;
  •      our dependence on the strength of retail, commercial and industrial sectors of the economy in various countries around the world;
  •      competition with other manufacturers and distributors of consumer products;
  •      major retailers’ strong bargaining power and consolidation of our customers;
  •      risks related to our substantial indebtedness, a potential increase in interest rates or changes in our credit ratings;
  •      our ability to improve productivity, reduce complexity and streamline operations;
  •      future events that could adversely affect the value of our assets and/or stock price and require additional impairment charges;
  •      our ability to remediate the material weakness in internal control over financial reporting and to consistently maintain effective internal control over financial reporting;
  •      our ability to develop innovative new products, to develop, maintain and strengthen end-user brands and to realize the benefits of increased advertising and promotion spend;
  •      the impact of costs associated with divestitures;
  •      our ability to effectively execute our turnaround plan;
  •      changes in the prices of raw materials and sourced products and our ability to obtain raw materials and sourced products in a timely manner;
  •      the impact of governmental investigations, inspections, lawsuits, legislative requests or other actions by third parties;
  •      the risks inherent to our foreign operations, including foreign exchange fluctuations, exchange controls and pricing restrictions;
  •      a failure of one of our key information technology systems, networks, processes or related controls or those of our service providers;
  •      the impact of U.S. and foreign regulations on our operations, including the escalation of tariffs on imports into the U.S. and exports to Canada, China and the European Union, environmental remediation
         costs and data privacy regulations;
  •      the potential inability to attract, retain and motivate key employees;
  •      the impact of new Treasury and tax regulations and the resolution of tax contingencies resulting in additional tax liabilities;
  •      product liability, product recalls or related regulatory actions;
  •      our ability to protect intellectual property rights;
  •      significant increases in funding obligations related to our pension plans; and
  •      other factors listed from time to time in our filings with the Securities and Exchange Commission, including, but not limited to, our Annual Report on Form 10-K and our Quarterly Reports on Form 10-Q.

The information contained in this presentation and the tables is as of the date indicated. The company assumes no obligation to update any forward-looking statements as a result of new information, future
events or developments.

This presentation and the accompanying remarks contain non-GAAP measures. An explanation of most directly comparable GAAP measures, if available, and reconciliations are contained in the Appendix after
slide 27.
      © Newell Brands                                                                                                                                                                                                                      2
Key Messages

                  Strong progress on restoring top line growth potential

                          Closing margin gaps vs. benchmarks

                      Significantly improving cash flow generation

                  Strong and experienced leadership team now in place

© Newell Brands                                                            3
Newell at a Glance

© Newell Brands      4

Priorities We Have Been Executing On

              Address COVID-19 Related Challenges               Drive Turnaround Agenda Forward

                                              Preserve
                       Keep Plants                                                        Focus on Cash,
Safety and                                    Financial   Build a          Restart
                        and DC’s                                                           Productivity,
Wellbeing of                                 Health and   Winning          Growth
                       Open, Where                                                         Complexity &
Employees                                      Strong      Team            Engine
                        Possible                                                            Overheads
                                              Liquidity

   © Newell Brands                                                                                   5
New Appointments Strengthen Leadership Team

                                                                   Kristine Malkoski                           Lisa McCarthy                            Michael McDermott
                     Mike Hayes                                                                                  President
                                                                    Business Unit CEO                                                                     Business Unit CEO
                  Chief Customer Officer                                                                       Home Fragrance
                                                                          Food                                                                              Commercial

                                            Steven Parsons                                 Jim Pisani                           Christine Robins
                                           Chief Human Resources                         Business Unit CEO                        Business Unit CEO
                                                   Officer                              Outdoor & Recreation                    Appliances & Cookware

© Newell Brands                                                                                                                                                               6
Laser Focused on Reigniting Core Sales Growth
1                            Innovation                                2           eCommerce and Social Marketing
    •    Build on momentum in growth businesses                            •   Achieve towering competitive advantage in
    •    Continue improvement in Food and Commercial                           eCommerce and Social Marketing
    •    Rebuild A&C and O&R innovation foundations                        •   Improve digital IQ of businesses and become a
                                                                               truly omni-channel player
    •    Rejuvenate brands for today’s consumer
                                                                           •   Accelerate retail.com growth
    •    Capitalizing on emerging consumer needs and trends
    •    Enabling cross-business platforms

3                     U.S. Distribution Gaps                           4        Customer Collaboration and Execution
    •    Close gaps in non-mass channels (e.g. Grocery,                    •   Become an exemplary business partner through
         Dollar, Drug)                                                         joint business planning and excellent customer
    •    Leverage Newell’s scale vs. individual business units                 service / fulfillment accuracy
                                                                           •   Top to top relationships

5                                                         International
    •     Focus on key drive countries and categories to build scale
    © Newell Brands                                                                                                             7
Green Shoots of Underlying Progress

                                                                    Capitalizing on consumer
   Restoring growth                 Fortifying innovation             trends to accelerate
 momentum of Food and             funnel and fast-tracking          recovery in Appliances &
Commercial business units           new ideas to market             Cookware and Outdoor &
                                                                           Recreation

                        Elevating                    Strengthening customer
                       omni-channel                  collaboration and closing
                        capability                       distribution gaps

    Underlying progress temporarily masked by ~9pt sales headwind from COVID-19 in 1H’20

© Newell Brands                                                                                8
Expanding eCommerce Penetration Off a Solid Base
                                                  1H’20 vs. 1H’19
                                      % of Net Sales from eCommerce, Global
                                Commercial

                  Connected Home & Security

                                                                              21%
                                      Food

                                    Writing
                                                                              eCommerce
                       Outdoor & Recreation                                    NWL Global

                      Appliances & Cookware

                            Home Fragrance

                                      Baby

                                                   1H'19    1H'20
© Newell Brands                                                                             9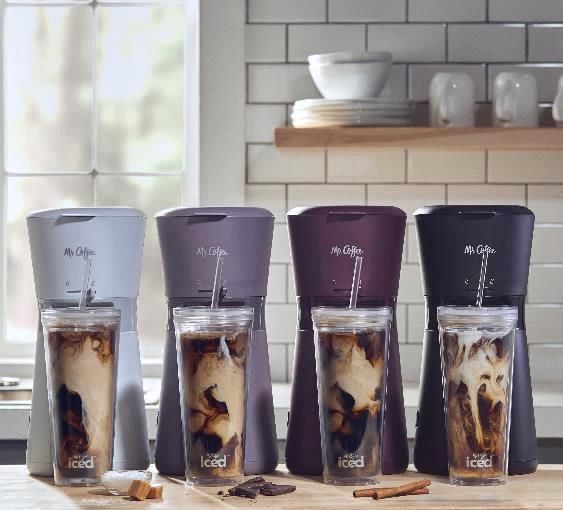
Well Positioned for Emerging Consumer Trends
Cooking, Baking & Grilling   Consuming Food at Home       Hygiene          Outdoor Activities

       Arts & Crafts           Coffee Consumption     Local Road Trips   Spending Time at Home
                                     NWL

                               NWL

    © Newell Brands                                                                             10
Leaning Into Innovation to Build on Strong Growth
Momentum in Food
Food Rubbermaid® BrillianceTM Glass Rubbermaid® EasyFindLidsTM
Silvershield® for Antimicrobial Product Protection
Food has
maintained core
growth momentum
since Q4’19
Driving market
share gains
Strengthened new
product pipeline
and accelerated
time to market Antimicrobial properties are built in to inhibit the growth of odor-causing bacteria on the
product. This product does not protect users or others against foodborne bacteria.
Always clean and wash this product thoroughly before and after each use.
© Newell Brands 11Commercial Business Off to a Strong Start in 1H’20 and
Rapidly Capitalizing on Emerging Trends
Commercial Building a $100M Sanitizer Business Over the Next Few
Years & Scaling Supply Capacity for Global Growth
2 consecutive quarters
of core sales growth in
Q1 and Q2’20
Improved innovation
funnel and strong
execution driving
distribution wins
Expected to be one of the fastest organic growth businesses for
Newell Brands
© Newell Brands 12Appliances & Cookware Leveraging the Rise of the
‘Home Chef’ and Increased Coffee Consumption
Appliances & Cookware
Oster® Blend Active
Oster® DiamondForceTM Appliances Rechargeable Portable Blender Mr. Coffee® Iced™ Coffeemaker
Appliances & Cookware business returned to core sales growth in Q2’20 and is well positioned to
capitalize on prevailing consumer trends, while populating the innovation funnel
© Newell Brands 13Writing Managing Through Temporary Disruption,
As Innovation Delivers
Writing
NWL’s share in gel pens Writing Business - Writing Business -
+7.2 pts YOY in Q2’20 Pre-COVID Performance Post-COVID Disruption
Strong footing with 6 Uncertainty about school
straight quarters of core and office re-openings
sales growth through driving significant
Q4’19 category softness
Proven strategies and Core sales in Writing
Best-in-Class Business Gel Pen execution temporarily under
Hero item from ‘Year of the Pen’ Strong innovation pressure in 2020
lineup pipeline Have full confidence in
Sharpie® S GelTM captured 6.9% underlying health of the
share in Q2’20 business
© Newell Brands Source: NPD. 14Enhanced Customer Collaboration Driving Early
Progress on Business Wins
ELEVATE PARTNERSHIP COLLABORATION CONTINUOUS IMPROVEMENT
Expanding distribution in dollar channel for Writing and Food businesses
Increasing distribution and Awards of Category Advisorship in the home center
channel for Commercial and Connected Home & Security businesses
Enhanced Joint Business Planning framework driving 2021 line reviews
© Newell Brands 15Encouraging Consumption Trends
L4 L13 L26 YTD
U.S. POS
Company returned to core sales growth
in June through August 2020
© Newell Brands U.S. Point Of Sale (POS) through August 2020. 16Driving Operational Improvements
Productivity Overhead Costs
Cash Flow Complexity
© Newell Brands 17Building Blocks for Gross Margin Expansion
Opportunity Actions
37% – 38%
35%
34%
Note: 2019 figures are normalized; 2018 Baseline as presented at CAGNY 2019, prior to reclassification of Rubbermaid Commercial Products, Mapa/Spontex and Quickie to continuing operations; Benchmark based on representative peer group of
consumable and durables companies.
© Newell Brands 18FUEL Off to a Strong Start in 2020
FUEL Outlook for 2020
Cross-functional and cross-business unit
+24% partnership on savings opportunities in:
Planning
Product Value Engineering
Manufacturing
Procurement
Distribution and Transportation
2019 2020 Forecast
© Newell Brands 19SKU Rationalization Moving At a Rapid Pace
Greater focus on high velocity SKU’s further enabled by COVID-19
Driving more efficient purchasing, operations, and demand planning
50% Targeted SKU Reduction by 2021
# of SKUs
Average Revenue/Active SKU
102K ~42% >50%
SKUs taken
increase since
out through
74K 2018
Aug ‘20
59K
~50K
2018 2019 Aug ‘20 2021
2018 LTM Aug '20
Target
© Newell Brands 20
Note: Revenue/Active SKU excludes Commercial.Meaningful Opportunity on Overheads
Opportunity Actions
21%
19%
16% - 17%
Note: 2019 figures are normalized; 2018 Baseline as presented at CAGNY 2019, prior to reclassification of Rubbermaid Commercial Products, Mapa/Spontex and Quickie to continuing operations; Benchmark based on representative peer group of
consumable and durables companies.
© Newell Brands 21On Track for Substantial Progress on Overhead
and Complexity Reduction
ZBB Review Restructuring ERP Office Applications
Locations Legal Entities
~5% reduction
Tightened ~4% 2 ERP ~33% reduction ~9% reduction
in office
discretionary professional conversions to in applications in legal entities
locations
spending and headcount be executed in anticipated in expected in
expected in
T&E impacted 2020 2020 2020
2020
In 1H’20 drove $100M+ Reduction in Overhead Costs Despite
Top Line Pressure, With More to Come Going Forward
© Newell Brands 22Digital Tech Re-Platforming Progressing Well
New platform enables significantly improved Showcasing new product innovation
social listening, consumer insights & analytics,
content management, and DTC websites Brand storytelling focused on consumer
path to purchase
290
Converted ~60% of our U.S. websites to a
U.S. new platform
>100M Expect to have all U.S. websites on the
sessions/ new platform by mid 2021
# of U.S. websites year Early evidence of improvement in page
load time, bounce rate and checkout
completion rate
82
DTC
40 Marketing
Catalog
Ongoing work to replicate
2018 2019 2020 Plan model outside the U.S.
© Newell Brands 23Driving Cash Conversion Improvement
In 2019:
2018
2019 Benchmark Extended payable terms on 170
Baseline
strategic suppliers and over
2,000 “tail suppliers”
+ Days Sales 78 69 -
Faster deduction resolution and
process improvements
+ Days Inventory 103 92 - Reduced excess and obsolete
inventory by 28%
- Days Payables 66 63 - Cut 28K SKUs
Roll out of integrated business
planning and advanced analytics
Cash Conversion 115 98 70
Portfolio choices: over 10 days
improvement on LFL basis
Note: 2018 Baseline as presented at CAGNY 2019, prior to reclassification of Rubbermaid Commercial Products, Mapa/Spontex and Quickie to continuing operations; Benchmark based on representative peer group of consumable and durables companies.
© Newell Brands 24Building on Strong Operating Cash Flow Progress from
2019 in 1H'20, With Significant Opportunity Ahead
$132 M
+54% $1,044 M +$141M
$680 M >20-day
improvement in cash
conversion cycle
($9) M
2018 2019 1H'19 1H'20
© Newell Brands 25Long-Term Aspirational Targets
Core Sales Growth
Low single-digits
Operating Income Margin
50 bps annual increase
FCF Productivity
>100%
Leverage Ratio
3X
© Newell Brands 26Key Messages
Strong progress on restoring top line growth potential
Closing margin gaps vs. benchmarks
Significantly improving cash flow generation
Strong and experienced leadership team now in place
© Newell Brands 27Appendix
Non-GAAP Reconciliations
Non-GAAP Financial Measures 28Barclays 2020 Non-GAAP Financial Measures This presentation contains non-GAAP financial measures within the meaning of Regulation G promulgated by the U.S. Securities and Exchange Commission and includes a reconciliation of these non-GAAP financial measures to the most directly comparable financial measures calculated in accordance with GAAP. The company uses certain non-GAAP financial measures that are included in this press release and the additional financial information both to explain its results to stockholders and the investment community and in the internal evaluation and management of its businesses. The company’s management believes that these non-GAAP financial measures and the information they provide are useful to investors since these measures (a) permit investors to view the company’s performance and liquidity using the same tools that management uses to evaluate the company’s past performance, reportable business segments, prospects for future performance and liquidity, and (b) determine certain elements of management incentive compensation. The company’s management believes that core sales provides a more complete understanding of underlying sales trends by providing sales on a consistent basis as it excludes the impacts of acquisitions, planned and completed divestitures, retail store openings and closings, certain market exits, and changes in foreign exchange from year-over-year comparisons. The effect of changes in foreign exchange on reported sales is calculated by applying the prior year average monthly exchange rates to the current year local currency sales amounts (excluding acquisitions and divestitures), with the difference between the 2020 reported sales and constant currency sales presented as the foreign exchange impact increase or decrease in core sales. The company’s management believes that “normalized” gross margin, “normalized” SG&A expense, “normalized” overhead expense, “normalized” operating income, “normalized” operating margin, “normalized” net income, “normalized” diluted earnings per share, “normalized” income from continuing operations, “normalized” depreciation and amortization, “normalized” EBITDA, “normalized” interest and “normalized” tax benefits, which exclude restructuring and restructuring-related expenses and one-time and other events such as costs related to the extinguishment of debt, certain tax benefits and charges, impairment charges, pension settlement charges, divestiture costs, costs related to the acquisition, integration and financing of acquired businesses, amortization of acquisition-related intangible assets, inflationary adjustments, expenses related to certain product recalls and certain other items, are useful because they provide investors with a meaningful perspective on the current underlying performance of the company’s core ongoing operations and liquidity. On a pro forma basis, "normalized" items give effect to the company's decision not to sell the Commercial, Mapa and Quickie businesses. “Free cash flow productivity” is calculated as the ratio of free cash flow (calculated as net cash provided by operating activities less capital expenditures) to normalized net income, and the company believes that free cash flow productivity is an important indicator of liquidity realized from the company’s core ongoing operations. “Normalized EBITDA” is an ongoing liquidity measure (that excludes non-cash items) and is calculated as pro forma normalized earnings before interest, tax depreciation, amortization and stock-based compensation expense. “Leverage ratio” is a liquidity measure calculated as the ratio of total debt less cash and cash equivalents to normalized earnings before interest, tax, depreciation, amortization and stock-based compensation expense. The company determines the tax effect of the items excluded from normalized diluted earnings per share by applying the estimated effective rate for the applicable jurisdiction in which the pre-tax items were incurred, and for which realization of the resulting tax benefit, if any, is expected. In certain situations in which an item excluded from normalized results impacts income tax expense, the company utilizes a “with” and “without” approach to determine normalized income tax benefit or expense. The company will also exclude one-time tax expenses related to a change in tax status of certain entities and the loss of GILTI tax credits as a result of utilizing the 50% IRC Section 163(j) limit resulting from the CARES Act to determine normalized income tax benefit. While the company believes these non-GAAP financial measures are useful in evaluating the company’s performance and liquidity, this information should be considered as supplemental in nature and not as a substitute for or superior to the related financial information prepared in accordance with GAAP. Additionally, these non-GAAP financial measures may differ from similar measures presented by other companies. The company has presented forward-looking statements regarding long-term aspirational targets for core sales growth, operating income margin, FCF productivity and leverage ratio. These non–GAAP financial measures are derived by excluding certain amounts, expenses or income from the corresponding financial measures determined in accordance with GAAP. The determination of the amounts that are excluded from these non-GAAP financial measures is a matter of management judgment and depends upon, among other factors, the nature of the underlying expense or income amounts recognized in a given period. We are unable to present a quantitative reconciliation of the aforementioned forward-looking non-GAAP financial measures to their most directly comparable forward-looking GAAP financial measures because such information is not available and management cannot reliably predict all of the necessary components of such GAAP measures without unreasonable effort or expense. In addition, we believe such reconciliations would imply a degree of precision that would be confusing or misleading to investors. The unavailable information could have a significant impact on the company’s expectations. These non-GAAP financial measures are preliminary long-term estimates and are subject to risks and uncertainties. Any variation between the company’s actual results and preliminary financial data set forth above may be material. © Newell Brands 29
Barclays 2020

Reconciliation of Gross Margin in 2018
                                                                  NEWELL BRANDS INC.
                                                                 GROSS MARGIN
                                                      FOR THE YEAR ENDED DECEMBER 31, 2018

        Net sales (1)                                                                                    $       8,631
        Adjust for the inclusion of Commercial Business, Mapa/Spontex and Quickie business (2)                   1,523
        As recasted (2)                                                                                     $   10,154

        Gross profit (1)                                                                                 $       3,009
        Normalization adjustments (2) (3)                                                                          (11)
        Normalized gross profit and margin (3)                                                                   2,998                             34.7%

        Adjustments for the inclusion of Commercial Business, Mapa/Spontex and Quickie business (2)                509
        Proforma adjustments (2) (4)                                                                                (27)
        As recasted, proforma gross profit and margin (2)                                                   $    3,480                             34.3%

        (1) As reported on the Company's Annual Report on Form 10-K for the year ended December 31, 2018.

        (2) As recasted on the Company's Form 8-K furnished on February 10, 2020.

        (3) As presented at CAGNY in 2019 and on the Company's Form 8-K for the quarter and year ended December 31, 2018, furnished on February 15, 2019.

       (4) Depreciation and amortization expense related to the Commercial Business, and the Mapa and Quickie businesses that would have been recorded
       had they been continuously classified as held and used.
© Newell Brands                                                                                                                                             30
Barclays 2020
Reconciliation of Gross Margin in 2019
NEWELL BRANDS INC.
GROSS MARGIN
FOR THE YEAR ENDED DECEMBER 31, 2019
Net sales (1) $ 9,715
Gross profit (1) $ 3,219 33.1%
Normalization adjustments (2) 89
Adjustments for the inclusion of Commercial Business, Mapa/Spontex and Quickie business (3) (21)
Proforma adjustments (2) (3) 68
As recasted, proforma gross profit and margin (2) $ 3,287 33.8%
(1) As reported on the Company's Annual Report on Form 10-K for the year ended December 31, 2019.
(2) As reported on the Company's Form 8-K furnished on February 14, 2020.
(3) Depreciation and amortization expense related to the Commercial Business, and the Mapa and Quickie businesses that
would have been recorded had they been continuously classified as held and used.
© Newell Brands 31Barclays 2020
Reconciliation of Overhead in 2019 and 2018
NEWELL BRANDS INC.
OVERHEAD RECONCILIATION
FOR THE YEARS ENDED DECEMBER 31, 2019 AND 2018
For the year ended December 31, 2018:
Net sales (1) $ 8,631
Adjust for the inclusion of Commercial Business, Mapa/Spontex and Quickie business (2) 1,523
As recasted (2) $ 10,154
Selling, general and administrative expenses - as adjusted (1) $ 2,217
Less: Advertising and promotion costs (3) (374)
OVERHEAD (AS ADJUSTED) (3) $ 1,843 21.3%
Selling, general and administrative expenses - as adjusted (1) $ 2,217
Adjust for the inclusion of Commercial Business, Mapa/Spontex and Quickie business (2) 213
Proforma adjustments for the inclusion of Commercial Business, Mapa/Spontex and Quickie business (2) 3 130 bps
Proforma selling, general and administrative expenses (2) 2,432 from portfolio
Less: Advertising and promotion costs (3) (374) decisions
Less: Advertising and promotion costs related to Commercial Business, Mapa/Spontex and Quickie business (23)
OVERHEAD (AS ADJUSTED) $ 2,035 20.0%
For the year ended December 31, 2019:
Net sales (4) $ 9,715
Selling, general and administrative expenses - as reported (4) $ 2,451 100 bps
Proforma adjustments (4) (213) operating
Proforma selling, general and administrative expenses (4) 2,238 improvement
Less: Advertising and promotion costs (388)
OVERHEAD (AS ADJUSTED) $ 1,850 19.0%
IMPROVEMENT 231 bps
(1) As presented on the Company's Form 8-K for the quarter and year ended December 31, 2018, furnished on February 15, 2019.
(2) As recasted on the Company's Form 8-K furnished on February 10, 2020.
(3) As presented at CAGNY in 2019.
© Newell Brands 32
(4) As presented on the Company's Form 8-K for the quarter and year ended December 31, 2019, furnished on February 14, 2020.You can also read