Union Bank and North American Strategy Update - April 2011

Page created by Antonio Parker
 
CONTINUE READING
Union Bank and North American Strategy Update - April 2011
Mitsubishi UFJ Financial Group

Union Bank and North American
Strategy Update

                                 April 2011
Union Bank and North American Strategy Update - April 2011
This document contains forward-looking statements in regard to forecasts, targets and
   plans of Mitsubishi UFJ Financial Group, Inc. (“MUFG”) and its group companies
   (collectively, “the group”). These forward-looking statements are based on information
   currently available to the group and are stated here on the basis of the outlook at the
   time that this document was produced. In addition, in producing these statements
   certain assumptions (premises) have been utilized. These statements and assumptions
   (premises) are subjective and may prove to be incorrect and may not be realized in the
   future. Underlying such circumstances are a large number of risks and uncertainties that
   could cause actual results to differ materially. Please see other disclosure and public
   filings made or that will be made by MUFG and the other companies comprising the
   group, including the latest kessantanshin, financial reports, Japanese and U.S. securities
   reports and annual reports and filings, for additional information regarding such risks
   and uncertainties. The group has no obligation or intent to update any forward-looking
   statements contained in this document.
   In addition, information on companies and other entities outside the group that is
   recorded in this document has been obtained from publicly available information and
   other sources. The accuracy and appropriateness of that information has not been
   verified by the group and cannot be guaranteed.

Bank of America Corp, JP Morgan Chase, Citigroup, Wells Fargo Co., U.S. BanCorp, PNC Financial Services Group, Inc.,
SunTrust Banks, Inc., BB&T Corp, Regions Financial Corp, Fifth Third Bancorp, KeyCorp, M&T Bank Corp, Comerica, Inc.,
Huntington Bancshares Inc., Marshall & Ilsley Corp, Zions Bancorporation, First Horizon National Corp, Associated
Banc-Corp, City National Corporation
                                                                                                                        1
Union Bank and North American Strategy Update - April 2011
Contents

     Current
     Current State
             State of
                   of Union
                      Union Bank
                            Bank

z Overview of Union Bank
   (1) Company profile and history            5      (9) Capital position               21
   (2) Footprint                              6      (10) FDIC assisted transactions    22
   (3) Ranking in the U.S.                    7    z Business environment for FY2011    24
   (4) Corporate governance                   8
   (5) Management team                        9
                                                         North
                                                         North American
                                                               American Strategy
                                                                        Strategy
   (6) Business characteristics              10
  (7) Strategy                               11
                                                   z Weight of North America business   26
z Financial results for FY2010                       within BTMU
   (1) Income statement summary              13    z Overview of Headquarters for       27
   (2) Outline of results by business segment 14     the Americas, BTMU
   (3) Balance sheet summary                 15    z North American Management          28
   (4) Loans                                 16     Committee
   (5) Credit quality                        17    z NAMCO initiatives                  29
   (6) Deposits                              18    z Alliance with Morgan Stanley       30
   (7) Net interest margin                   19    z Non-organic growth                 31
   (8) Liquidity                             20

                                                                                             2
Current State of Union Bank

   North American Strategy

                              3
z Overview of Union Bank

z Financial results for FY2010

z   Business environment for FY2011

                                      4
Company profile and history
zOne of the largest regional banks headquartered in
 California, with approximately 150 years of history

         UB Company Profile                                                             History

     Head office                           San Francisco       1864: The Bank of California established as the first commercial
                                                                    bank in the west coast of the USA
                                                    400
       Branches                                                1883: First National Bank of San Diego (later changed its name to
                                  (mainly in California)            Southern California First National Bank) established

      Employees                                       10,686   1914: Kaspare Cohn Commercial and Savings Bank (later changed
                                                                    name to Union Bank) established

     Total assets              $79 billion / ¥6.5 trillion     1975: Bank of Tokyo California acquired Southern California First
                                                                    National Bank to form California First Bank

     Total loans               $48 billion / ¥3.9 trillion     1984: The Mitsubishi Bank acquired The Bank of California

                                                               1988: California First Bank acquired Union Bank (Union Bank name
    Total deposits             $60 billion / ¥4.9 trillion          retained)

                                                               1996: As a result of the merger of The Mitsubishi Bank and The
    Net business
                           $985 million / ¥80.8 billion             Bank of Tokyo, The Bank of California and Union Bank
       profits                                                      merged to form Union Bank of California

     Net Income            $573 million / ¥47.0 billion        2008: Became a wholly owned subsidiary of BTMU and Bank name
                                                                    was changed to Union Bank
  *Figures are for FY2010 or as of the end of 2010,
   converted at 82 yen to a dollar
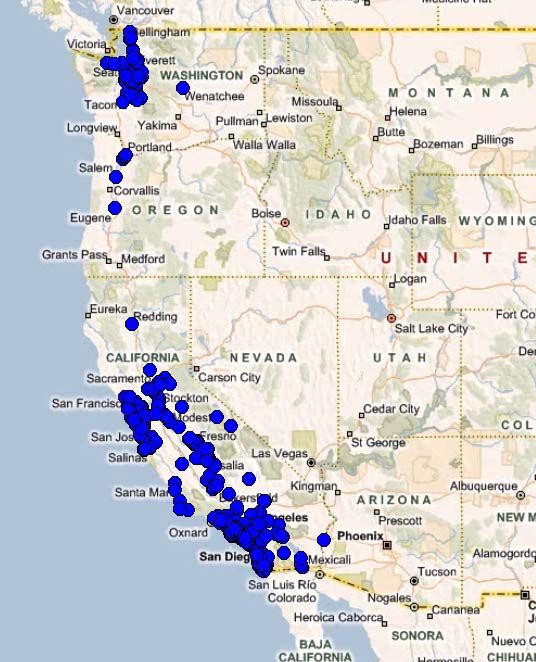
                                                                                                                                   5
Footprint
z400 branches, mainly in California, provide a solid foundation
zGood coverage in many desirable west coast markets, including San
 Diego, Los Angeles, San Francisco, and Seattle

          Note: UB owns corporate banking offices in Texas, New York and Illinois
                                                                                    6
Ranking in the U.S.
z Ranked 18th in the U.S. and 3rd in California in terms of total deposits
 as of June 2010 (most recent data available)

            Ranking in the U.S.                         Ranking in California
                               Total deposits                                Total deposits
                   Bank name                                     Bank name
                                  ($ bn)                                        ($ bn)

  1    Bank of America              829         1    Bank of America              222

  2    Wells Fargo Bank             719         2    Wells Fargo Bank             163

  3    JPMorgan Chase Bank          633         3    Union Bank                   61

  4    Citibank                     255         4    JPMorgan Chase Bank          61

  5    PNC Bank                     177         5    Citibank                     48

  6    U.S. Bank                    169         6    U.S. Bank                    31

  ・                      ・          ・           7    Bank of the West             23

  10   Regions Bank                 96          8    City National Bank           17

  ・                      ・          ・           9    East West Bank               13

  18 Union Bank                     64          10   Comerica Bank                13

                                                                                              7
Corporate governance
z UnionBanCal’s Board of Directors has 15 members, 11 of which are independent
z Established 4 committees under the Board, all chaired by independent directors
z Committed to good disclosure, including voluntarily issuing quarterly earnings
  releases and filing quarterly and annual financial statements with the SEC

                                             MUFG                                                        Shareholder
                                                                                                         Shareholder
                                             MUFG
                                            100%

                                             BTMU                                                    Board
                                                                                                     Board of
                                                                                                           of Directors
                                                                                                              Directors
                                             BTMU
                                            100%
                                                                                                                     Audit
                                                                                                                     Audit && Finance
                                                                                                                              Finance
                                         UnionBanCal
                                         UnionBanCal                                                                   Committee
                                                                                                                       Committee
                                         Corporation
                                          Corporation
                                       (Holding
                                        (Holding company)
                                                  company)                                                           Risk
                                                                                                                     Risk Committee
                                                                                                                          Committee
                                                      100%
                 Other
                 Other subsidiaries
                        subsidiaries             Union
                                                 Union Bank,
                                                       Bank, N.A.
                                                             N.A.                                              Executive
                                                                                                               Executive Compensation
                                                                                                                          Compensation
                  (Leasing,
                   (Leasing, etc.)
                             etc.)                 (Bank
                                                    (Bank subsidiary)
                                                           subsidiary)                                          && Benefits
                                                                                                                   Benefits Committee
                                                                                                                            Committee
                                                   Other
                                                   Other subsidiaries
                                                          subsidiaries                                              Nominating
                                                                                                                    Nominating &&
                                                   (Securities,
                                                    (Securities, etc.)
                                                                 etc.)                                          Governance
                                                                                                                Governance Committee
                                                                                                                           Committee
Directors                               Independent Directors
„ Nobuo Kuroyanagi (Chairman of         ‡ Aida Alvarez (former Administrator, Small Business   ‡ Christine Garvey (former global head of Corporate Real
  BTMU)(*)                                Administration)                                        Estate & Services, Deutsche Bank AG)
„ Tatsuo Tanaka (Chairman,              ‡ David Andrews (retired SVP, Governmental Affairs,    ‡ Takeo Hoshi (Professor, University of California, San
  Deputy president of BTMU)               General Counsel & Secretary, PepsiCo, Inc.)            Diego)
„ Masaaki Tanaka (Managing              ‡ Nicholas Binkley (Partner, Forest Binkley & Brown)   ‡ Fernando Niebla (President, International Technology
  executive officer, BTMU)              ‡ Dale Crandall (President, Piedmont Corporate           Partners, LLC)
„ Masashi Oka (President & CEO)           Advisors, Inc.)                                      ‡ Barbara Rambo (CEO, Taconic Management Services)
                                        ‡ Murray Dashe (retired Chairman, CEO & President,     ‡ Dean Yoost (retired Partner, PriceWaterhouseCoopers)
     (*) Director of Union Bank only
                                          Cost Plus, Inc.)
                                        ‡ Mohan Gyani (Vice Chairman, Roamware, Inc.)                                                                     8
Management team
zA U.S.-based management team of mostly American executives
zExecutive Committee members:
                               Vice
                                ViceChairman
                                     Chairman&&Chief        Commercial
                                                 Chief       CommercialBanking
                                                                        Banking
      President               Corporate
                               CorporateBanking
                                          BankingOfficer
       President&&CEO
                   CEO                            Officer    R. Dawson, SEVP
                                                              R. Dawson, SEVP
          M. Oka                    J.J.Erickson
                                         Erickson
           M. Oka
                                                               Global
                                                                GlobalTreasury
                                                                       Treasury
                                Vice
                                 ViceChairman
                                      Chairman&&CFO
                                                 CFO             Management
                                                                  Management
                                                             J.J.Bourne,
                                                                  Bourne,SEVP
                                                                          SEVP
                                    J.J.Woods
                                        Woods
                                                            Real
                                                             RealEstate
                                                                  EstateIndustries
                                                                         Industries
                                   Vice
                                    ViceChairman
                                         Chairman&&
                                   Chief                    M.
                                                             M.Stedman,
                                                                Stedman,SEVP
                                                                           SEVP
                                    Chief RiskOfficer
                                         Risk  Officer
                                    M.
                                    M.Midkiff
                                       Midkiff
                                                            Community
                                                             CommunityBanking
                                                                        Banking
                                Vice
                                 ViceChairman
                                      Chairman&&Chief
                                                  Chief       P.
                                                               P.Habis,
                                                                 Habis,SEVP
                                                                        SEVP
                                 Retail
                                  RetailBanking
                                         BankingOfficer
                                                 Officer
                                    T.
                                     T.Wennes
                                       Wennes               Human
                                                            HumanResources
                                                                    Resources
                                                            P.
                                                             P. Fearer,SEVP
                                                               Fearer,  SEVP

                                                             Deputy
                                                              DeputyCFO
                                                                      CFO&&Chief
                                                                              Chief
                                                                Liaison
                                                                 LiaisonOfficer
                                                                         Officer
                                                            M.
                                                            M.Yasuda,
                                                               Yasuda,SEVP
                                                                       SEVP

                                                            General
                                                             GeneralCounsel
                                                                     Counsel
                                                            M.
                                                            M.Hirsch,
                                                               Hirsch,SEVP
                                                                       SEVP

                                                              Independent
                                                               IndependentRisk
                                                                            Risk
                                                                  Monitoring
                                                                   Monitoring
                                                              J.J.Wied,
                                                                  Wied,SEVP
                                                                        SEVP
                                                                                      9
Business characteristics

zPortfolio is well balanced between corporate and retail segments

  Revenue breakdown (FY10)                        Business characteristics

                                              ¾Corporate banking segment:
                      【By segment】
                Other                              ¾ Serves middle market and corporate
                 5%                                   businesses headquartered throughout the
                                                      U.S., with particular strength in California
                                Corporate
                                                      small & mid-sized companies
                                  55%
                  Retail                           ¾ Commercial real estate
                  40%
                                                   ¾ Examples of specialized corporate
                                                      industries nationwide:
                                                          • Highly competitive power & utilities
                                                             player in the North America, MUFG
                      【By account type】                      ranked No. 1 in North America
                                                             project finance
      Trading, etc.                                       • Corporate Cash Management
          11%
                                                             Services
    Fees &
                               Net interest        ¾ Wealth management services
  commissions
                              income 73%
     16%                                      ¾Retail banking segment:
                                                   ¾ Serves approximately 1 million households
                                                   ¾ High-touch, high-quality customer service
                                                   ¾ High-quality residential mortgage portfolio

                                                                                                     10
Strategy
           Strategic Goals
zUnion Bank’s strategic goal is to be a high profitability relationship bank,
 with national niches
zFY2011 Strategic focus is franchise optimization:

   Optimize Revenue:                            Optimize Expense:                     M&A driven growth:
   Improved focus & execution in                Transform processes &                 Additional revenue growth through
   regional relationship banking and            infrastructure, with “funding”        bank & non-bank M&A to improve
   national niche businesses                     from productivity initiatives        geographic penetration &
                                                                                      diversification

        Corporate Banking                                                        Retail Banking

 ¾ Infill within Existing Core Geographies                       ¾ Jumbo Lending Business
   - Expand presence in Pacific North West                          - Profitable, market share leader, high credit quality
   - Leverage existing presence in Texas                            - Continue to grow jumbo California residential mortgages
 ¾ Wealth Management Expansion                                   ¾ Consumer credit offerings
   - Leverage existing commercial relationships                     - Expand product set, business line, and geographies
   - Align product offerings and balance revenue mix
                                                                 ¾ Business Banking
 ¾ Niche and Product Expansion                                      - Restructure the group for growth and scale
   - Expansion in existing niche business lines as well
     as development of new niche business lines                  ¾ Distribution Channels
                                                                   - Investing in alternative channels (online, mobile, ATM)
                                                                                                                                11
z Overview of Union Bank

z Financial results for FY2010

z   Business environment for FY2011

                                      12
Income statement summary
                                                                                                 ($ mn)
z Pre-tax, pre-provision income
 „ Net interest income increased primarily due to:                                                        FY2009     FY2010
                                                                                                                               Change
   - Balance sheet optimization and securities portfolio
     re-balancing strategy adopted in FY2010                     1 Total revenue                            2,987      3,357      370
 „ Noninterest income increased primarily due to:
                                                                 2     Net interest income                  2,260      2,434      174
   - Higher gains from securities sales in FY2010 (related to
      securities portfolio re-balancing)                         3     Noninterest income                     727       923       196
   - Higher Capital Markets and Commercial Banking fee           4
                                                                         Service charges on deposits
                                                                                                              291       250       (41)
                                                                         accounts
     income
                                                                         Trust and investment
   - Partially offset by declining deposit fees from lower       5       management fees                      135       133        (2)
     rates & regulatory pressures, an industry-wide challenge    6       Merchant banking fees                 65        83        18
 „ Operating expenses increased primarily due to:                7
                                                                         Brokerage commissions and
                                                                                                               34        40         6
                                                                         fees
   - Higher FTE from acquisitions
                                                                 8       Card processing fees, net             32        41         9
   - Significant one-time charges in the 4th quarter due to
     certain reserves for contingencies and an asset             9       Trading account activities            74       111        37
     impairment charge                                          10       Securities gains, net                 24       105        81
 „ Pre-tax pre-provision income up 10% over FY2009              11 Noninterest expense                      2,088      2,372      284
                                                                12       Salaries and employee benefits       972      1,230      258
z Provision for loan losses                                     13       Other than above                   1,116      1,142       26
„ Significant reduction (84%) in provision due to               14 Pre-tax, pre-provision income              899       985        86
  improvement in credit environment, resulting in               15   Provision for loan losses             (1,114)     (182)      932
  improved credit quality throughout the portfolio                   Income (loss) before income
                                                                16 taxes and including                      (215)       803      1,018
z Net income                                                         noncontrolling interests
 „ Strong return to profitability in FY2010 with net income     17 Net income (loss)                         (65)       573       638
   of $573 mn
                                                                                                                                        13
Outline of results by business segment
zTotal revenue increased for corporate and retail segments from FY2009 to FY2010:
  ¾ Corporate revenue growth driven primarily by increased fee income and higher net interest income on deposits
  ¾ Retail revenue growth driven primarily by growth in average deposit and loan balances and an expansion in the
    margin on assets, slightly offset by a reduction in fee income driven by regulatory changes

                                                                        Breakdown
                                                                        Breakdown of of changes
                                                                                        changes
            Total
            Total revenue
                  revenue by
                          by segment
                             segment                                       in
                                                                           in total
                                                                              total revenue
                                                                                    revenue
($ mn)
                                                       ($ mn)

                                      3,347                                          Retail   Others
 3,500                                                                                                 3,347
                                                                                     190      (22)
              2,976                                                      Corporate
                                                                           203
 3,000
                           Retail
                                                                2,976
                                      1,327
 2,500
              1,137
 2,000

 1,500
                          Corporate

 1,000                                1,841
              1,638

  500

     0        201                     179                  0
                             Others
               FY09                    FY10
                                                                FY09                                    FY10

                                                                                                               14
Balance sheet summary

zLoans                                                                                                         ($ mn)

 „ Increased due to acquisitions and a return                                      End Dec. 09 End Dec. 10
   to loan growth across most loan categories                                                                Change
   in FY10H2                                     1 Total assets                           85,598    79,097    (6,501)
                                                 2    Loans                               47,220    48,094       874
zSecurities
                                                 3    Securities                          23,787    22,114    (1,673)
 „ Declined due to balance sheet optimization    4      Available for sale                22,559    20,791    (1,768)
   and securities portfolio re-balancing         5    Held to maturity                     1,228     1,323         95
   strategy                                      6 Total liabilities                      76,018    68,706    (7,312)
                                                 7 Deposits                               68,518    59,954    (8,564)
zDeposits
                                                 8      Noninterest bearing               14,559    16,343      1,784
 „ Deposit optimization strategy reduced
                                                 9      Interest bearing                  53,959    43,611   (10,348)
   higher-rate deposit accounts volumes,
                                                10 Total equity                            9,580    10,391       811
   supporting net interest margin expansion

zNon-performing assets                          11 Net interest margin
                                                                                         FY09
                                                                                           3.40%
                                                                                                   FY10
                                                                                                     3.24%    (0.16%)
 „ NPA levels improved as economy
   strengthened and asset quality improved      12 Nonperforming assets                    1,350     1,142      (208)
   across the board                             13
                                                   Nonperforming assets
                                                                                          1.58%     1.15%     (0.43%)
            *1                                     to total assets*1
 „ NPA ratio at low level of 1.15%, very
                                                      *1 Excluding FDIC covered assets
   favorable compared with peers

                                                                                                                  15
Loans
z Strong 5-year loan growth reflects franchise strength and balance
z Challenging economic environment in FY2010 made growth difficult, but UB held the
  portfolio nearly steady with acquisitions
z UB has a well-balanced loan portfolio with a relatively low concentration in CRE

                               Average loans                                                     Loan portfolio*1
                                                                                                               *1

      ($ bn)                     Annually←     →Quarterly
 55
                                                    Assets of the 2 banks
                                                    acquired through FDIC
                                                    assisted transactions are
                                                    included.
 50                            49.0                                                                        Lease financing
                                       47.7              47.8     48.1     48.0
                                                                                                Consumer        1.4%
                                                46.8
                       46.1                                                                       8.4%                                     Commercial,
                                                                                                                                           financial and
 45                                                                                                                                          industrial
                                                                                                                                               31.7%

               39.4
 40

      35.7
 35

                         CAGR+8%                                                                                                           Construction
                                                                                                                                              4.4%
 30
                                                                                                                             Commercial
                                                                                  Residential
                                                                                                                             real estate
                                                                                  mortgage
                                                                                                                               17.4%
 25                                                                                 36.8%

 20
       FY 06   FY 07   FY 08   FY 09   FY 10   FY 10Q1 FY 10Q2 FY 10Q3 FY 10Q4
                                                                                    *1 Average loans for FY10, excluding FDIC covered assets
                                                                                                                                                           16
Credit quality
z NPL ratio consistently lower than peers, due to differentiated business model, loan mix, and long-term
  commitment to conservative credit management
z UB manages risk through portfolio diversification, industry concentration limits, loan limits, geographic
  distribution, and type of borrower
z No subprime or option ARM residential mortgages loans
z Low residential mortgage delinquency rate due to focus on prime loans, high FICO scores, and low LTVs

                    NPL/total
                    NPL/total loans
                              loans                                   Net
                                                                      Net Charge-offs/average
                                                                          Charge-offs/average loans
                                                                                              loans
 6.0%                     (at period-end)                      3.0%                      (year-to-date)
               UB                                                             UB                            2.80%
               Peer average                                                   Peer average
                                                                                                                     2.68%
 5.0%                                                          2.5%
                                               4.91%

 4.0%                                                  4.21%   2.0%

 3.0%                                                          1.5%                             1.53%
                                               2.79%
                                 2.46%

 2.0%                                                          1.0%                                          1.02%

                                                       1.82%
                                                                                                                     0.79%

 1.0%
                     1.10%                                     0.5%                 0.55%
                                 0.84%                                                           0.37%
                                                                          0.33%
           0.47%
           0.11%                                                          0.04%
                      0.14%                                                          0.03%
 0.0%                                                          0.0%
        FY06       FY07       FY08          FY09       FY10            FY06       FY07       FY08         FY09       FY10
    Source: SNL and company reports                                   Source: SNL and company reports                        17
Deposits
z UB benefited from depositor flight-to-quality beginning in FY2008
z Lack of quality, risk-appropriate opportunities to invest the large pool of deposits led to the
  balance sheet optimization project in FY2010
z Balance sheet optimization targeted right-sizing the balance sheet through runoff of higher-rate
  deposits and remixing the securities portfolio to enable NIM expansion

                   ($ bn)                  Average deposits
                    80                           Annually←     →Quarterly

                    70                                          67.8   68.1
                                                        65.6                  64.8
                                                                                     61.7
                    60
                                                 56.6

                    50

                                          43.1
                                   42.2

                    40 40.0

                    30

                    20
                            FY06   FY07   FY08   FY09   FY10   FY10Q1 FY10Q2 FY10Q3 FY10Q4
                                                                                                18
Net interest margin
z Annual net interest margin results on declining trend as fall in funding costs due to
  lower rates is largely complete, while decline in yield on earning assets continues
z Returned to NIM expansion in FY10Q2 as balance sheet optimization project
  succeeded

                                                   Net interest margin

              7%
                                                     Annually←             →Quarterly

              6%
                       5.45%                                                                  Yield on total earning assets
                                                                                              Net interest margin
              5%                                                                              Rate on total interest bearing liabilities
                                          4.21%
              4%
                                                        3.78%
                     3.76%
                                                                                                                               3.53%
              3%                  3.40%
                                                  3.24%                                          3.11%
                                                                                                              3.36%
                                                                                   2.98%

              2% 2.24%

              1%
                                      1.08%             0.72%

              0%
                        FY08          FY09          FY10                      FY10Q1        FY10Q2          FY10Q3            FY10Q4
            Source: 2010 10-K, Quarterly Earnings Releases
            Yield on total earning assets=Interest Income/ Total earning assets Net interest margin=(Interest Income-Interest expense)/Total earning assets
            Rate on total interest bearing liabilities=Interest Expense/ Total interest bearing liabilities
                                                                                                                                                         19
Liquidity
z UB maintains a robust liquidity profile anchored by a strong deposit base
  with diverse wholesale funding capacity
z Portfolio of high-quality securities, mainly U.S. government bonds and
  Agency RMBS, can be readily converted to cash or serve as collateral

 Deposits
 Deposits &
          & Wholesale
            Wholesale Funding
                      Funding                                     Securities available for sale

                              Commercial
                                                                                                                    ($ mn)
                       FHLB
        Negotiable     $3.0     Paper
                                           Fed Funds                                  Amortized      Gross          Fair Value
           CDs                  $0.7
          $2.6                             Purchased                                    cost       Unrealized
                                              $0.4                                                  Gains &
                                           Medium-and                                               Losses
                                            Long-term
                                              Debt      Total                            20,726             65         20,791
                                              $2.6
                                                            U.S. Treasury and other
                                                            U.S. government
                                                                                          6,839             75           6,914
                Deposits
                 $57.4                                      RMBS-agency                  12,743             13         12,756

                                                            RMBS-non agency                 710           (28)             682

                                                            State and municipal               25                1            26

             $66.7 billion                                  ABS and debt securities         369                 4          373
        At December 31, 2010
                                                            Equity securities                 40                0            40

                                                                                                                                 20
Capital position
z Tier 1 common and TCE ratios compared very favorably with peers at December 31, 2010
z At December 31, 2010: BIS Tier 1 ratio 12.44%, total capital ratio 15.01%
z No government funds in capital structure
z Sizable capital cushion, available to support organic growth and acquisitions

            Select Capital Ratios                        Comparison
                                                         Comparison of
                                                                    of Capital
                                                                       Capital Ratios
                                                                               Ratios with
                                                                                      with Peers
                                                                                           Peers

                                                ($ mn)
                                                                       As of end Dec. 10
                         End Dec.   End Dec.
                            09         10      Change
                                                          16%
 1 Total capital ratio    14.54%     15.01%     0.47%                     12.42%
                                                          12%                       9.08%   9.67%
 2    Tier 1 ratio        11.82%     12.44%     0.62%
                                                                                                7.22%
 3
      Tangible common
                           8.29%      9.67%     1.38%
                                                           8%
      equity ratio
                                                           4%
 4 Tier 1 capital           7,485      8,029       544     0%
 5 Tier 2 capital           1,718      1,656      (63)                 Tier 1 common      Tangible
                                                                         capital ratio common equity
 6 Total capital            9,203      9,685       482
                                                                                            ratio
                                                                     UnionBanCal            Peers Average
     Risk-weighted
 7                         63,298     64,516     1,218
     assets                                               Source: Company disclosures

                                                                                                            21
FDIC assisted transactions
z Completed integration of Tamalpais bank in January 2011
z On track to complete integration of Frontier bank in April 2011

                Tamalpais
                Tamalpais Bank
                          Bank                                         Frontier
                                                                       Frontier Bank
                                                                                Bank
 „ Assets and deposits acquired                        „ Assets and deposits acquired
   ・Assets: approx. US$0.6 bn                            ・Assets: approx. US$3.2 bn
    (including loans of approx. US$0.5 bn)                (including loans of approx. US$2.8 bn)
   ・Deposits: approx. US$0.4 bn                          ・Deposits: approx. US$2.5 bn
 „ Network                                             „ Network
   ・7 branches in Marin County, California               ・47 branches in Washington State, 3 branches and
                                                          1 loan production office in Oregon
 „ Strategic implication
   ・Expand branch network and customer base in Marin   „ Strategic implication
    County, home to many high-income individuals         ・Washington State is a growing market, highly ranked
                                                          by market size and population growth among all 50
   ・More efficient than de novo expansion                 U.S. states
                                                         ・Achieved strong coverage in Seattle, creating
                                                          stronger footprint on west coast

                                                                                                                22
z Overview of Union Bank

z Financial results for FY2010

z   Business environment for FY2011

                                      23
Business environment for FY2011

  z   Economic environment
      9 Economy/Interest rates
        ~Clear signs of improvement but FRB cautious about early
        termination of monetary easing
         ~Fed Funds rate expected to remain near zero in FY2011

  z Regulatory environment
      9 Dodd Frank
        ~Durbin amendment, Volcker rule, Regulation Q repeal, enhanced
        risk management
      9 Regulation E
        ~Prohibit charging overdraft fees unless customers expressly opt-in
      9 Basel III
        ~Need to address liquidity regulations (LCR ratio)

                                                                              24
Current state of Union Bank

   North American Strategy

                              25
Weight of North America business within BTMU
zNorth America gross profits approx. 60% of BTMU’s overseas total
zNorth America accounts for one third of global revenue pool

Gross
Gross profits
      profits breakdown
              breakdown (FY09)
                        (FY09)                                                     Global
                                                                                   Global revenue
                                                                                          revenue pool
                                                                                                  pool
   MUFG             BTMU              Overseas
   total         consolidated         business                                        Other Asia
                                                                                         9%
(Yen 3,605.1 bn) (Yen 2,373.3 bn)   (Yen 564.6 bn)
                                                                          China
                                                                                                                     North
                                                                           9%
                                                                                                                    America
                                       •Europe
                                                                                                                     33%
                        17%

                        •17%

                                                                   Japan
                                        •Asia
                                                                    9%
                                                      Latin
                                                     America
                                         North
                                        America                   Middle East
                                         14%                      and Africa
     BTMU                                                            3%
                                                       North America
     66%
                        49%

                         •49%
                                                       approx. 60%                                                 Latin
                                         UNBC             of total                                                America
                                         45%                                                                        7%
                     Overseas                                                           Europe
                     business                                                            30%
                       24%
                                                                                Source: Boston consulting group
                                                                                                                            26
Overview of Headquarters for the Americas, BTMU
Business,
Business, customers
          customers and
                    and management
                        management                                                                        Business lines
                                                                               Corporate Banking Division ・・・ Promote Japanese & Asian corporate business
Business:        Commercial banking in the Americas                              for the Americas No.1        (current NY branch)

Customers:      Japanese and non-Japanese                                      Corporate Banking Division ・・・ Promote Japanese & Asian corporate business
                                                                                 for the Americas No.2        (current Chicago branch)
Management: Masaaki Tanaka, CEO for the Americas                               Corporate Banking Division ・・・ Promote Japanese & Asian corporate business
                                                                                 for the Americas No.3        (current LA and SF branch)
                   Y. Nishio, Head of Asian Corporate Banking                  Corporate Banking Division ・・・ Promote business with blue-chip Non-Japanese
                                                                                 for the Americas No.4        companies mainly included in Fortune 500
                   R. Chafetz, Head of Corporate and Investment
                                                                                  Investment Banking         ・・・
                                                                                                                   Promote syndicated loans, asset finance and
                   Banking for the Americas                                     Division for the Americas          structured finance in the Americas
                                                                               Global Markets Division for ・・・ Promote market business including foreign currency
                   C. Trunz, Chief Risk Officer for the Americas                      the Americas             treasury & exchange
                                                                                      Overseas branches      ・・・ Promote Japanese & Non-Japanese corporate business

 Gross
 Gross revenue
       revenue in
               in the
                  the Americas,
                      Americas, BTMU
                                BTMU                                                                              Network
(¥ bn)                                                                 North America                                                       South America

100                                                                              Vancouver
                                                                                                                  Montreal
                                                                            Seattle                          Toronto                               Caracas
                                                                                               Minnesota                Boston
 80                                                                                                                   New York
                                                                                                    Chicago
                                                                      San Francisco                                  Washington               Bogota
                                                                                                    Kentucky
 60                                                                       Los Angeles          Dallas             Atlanta
                                                                                                        Houston
                                                                                                                                           Lima
 40                                                                                                                                                          Rio de Janeiro
                                                                                                                  Cayman                               Sao Paulo
                                                                                            Mexico City
 20
                                                                                                                                            Santiago
                                                                                                                                                          Buenos Aires
  0
            FY07            FY08             FY09         FY10 H1
             Loans     Deposits    Fees & commissions   Forex   CIB

                                                                                                                                                                       27
North American Management Committee

  Name:        North American Management
               Committee (NAMCO)
  Established: August 2009
  Role:        Creation of integrated business
               strategies and pursuit of group
               synergies among all U.S. units
  Members:
  •   Tatsuo Tanaka, Chief Executive, Global Business Unit, BTMU (Chairman)
  •   Masaaki Tanaka, CEO for the Americas, BTMU
  •   Masashi Oka, President and CEO, Union Bank
  •   D. Andrews, Lead Director, UnionBanCal & UB Board
  •   P. Kelly, President, Knox & Co.
  •   B. Rambo, Strategy Designated Director, UnionBanCal & UB Board
  •   E. Ludwig, Founder and CEO, Promontory Financial Group

                                                                              28
NAMCO initiatives

  •Integrated North America strategy
     • Shared aspiration of becoming a top 10 US bank
     • Strengthen non-organic growth

  • Strengthen overlapping businesses
     • Introduce a unified model in Power & Utility business and become
     No. 1 in North America
     • Start to incorporate P&U model in other overlapping business areas

  • Enhance Cross Sell
     • Deposits and Cash Management Services, Investment banking products

  • Promote cooperation of administration functions
     • Harmonize processes in risk management and financial control
     • Strengthen staff exchange program
                                                                            29
Alliance with Morgan Stanley

            Alliance with Morgan Stanley in the Americas

  BTMU and Morgan Stanley collaborate through Morgan Stanley MUFG Loan
  Partners, LLC, a joint marketing company, to leverage the expertise of MUFG and
  Morgan Stanley in corporate finance and securities underwriting to provide first
  class financial services to corporate customers in the Americas.

  -An example of a successful deal
  ・Large acquisition by a Chemical fertilizer producer (April 2010)
  Acted as Joint Lead Arrangers and fully underwrote a $4.05 bn syndicated loan
  facility for this large acquisition finance.

  UB and Morgan Stanley promote collaborative business through corporate and
  personal trust businesses and asset management (sales of UB investment
  products through Morgan Staley’s distribution channels).

  -An example of a successful progress
  ・Started sales of Union Bank’s Market Linked CDs and trust products to Morgan
   Stanley customers.
                                                                                     30
Non-organic growth

  z In order to become a top 10 U.S. bank, actively pursue
    quality acquisition opportunities that meet key strategic and
    financial criteria
  (Examples of investment criteria)
     • Strategic fit
         • Expand geographic reach
         • Improve market share in existing markets
         • Diversify revenue and profit streams
         • Scale benefits
         • Business model fit
     • Cost synergies
     • Revenue synergies
     • Investment return
                                                                    31
No.1
      Service

  No.1       No.1
Reliability Global
           Coverage

                      32
You can also read