ICICI Bank: Performance and Strategy
←
→
Page content transcription
If your browser does not render page correctly, please read the page content below
ICICI Bank:
Performance and
Strategy
July 2020
The information in this presentation has been prepared by ICICI Bank Limited (the “Bank”) for use at a non-deal road show presentation by the Bank and does not constitute a
recommendation regarding the securities of the Bank.
This presentation does not constitute a prospectus, a statement in lieu of prospectus, offering circular or offering memorandum, private placement offer letter, an advertisement,
and should not be construed as an offer, or a solicitation of any offer, or invitation of any offer to purchase, subscribe for or sell any securities of the Bank in any jurisdiction. This
presentation should not be considered as a recommendation that any investor should subscribe for or purchase any securities of the Bank nor shall it or any part of it or the fact of
its distribution form the basis of, or be relied on in connection with, any contract or commitment. This presentation is for general information purposes only, without regard to any
specific objectives, financial situations or informational needs of any particular person. This presentation should not be used as a basis for any investment decision or be relied
upon in connection with, any contract, commitment or investment decision whatsoever. This presentation does not constitute financial, legal, tax or other product advice. You will
be solely responsible for your own assessment of the market and the market position of the Bank and you will conduct your own analysis and be solely responsible for forming
your own view of the potential future performance of the business of the Bank. It should be understood that subsequent developments may affect information contained in this
Presentation, which neither the Bank, nor its affiliates, advisors or representatives are under an obligation to confirm.
No representation or warranty, express or implied, is made as to, and no reliance should be placed on, the fairness, accuracy, completeness or correctness of the information or
the opinions contained herein. Neither the Bank nor any of the Bank’s advisors or representatives shall have any responsibility or liability whatsoever (for negligence or otherwise)
for any loss howsoever arising from any use of this presentation or its contents or otherwise arising in connection with this presentation. The information set out herein may be
subject to updating, completion, revision, verification and amendment and such information may change materially.
This presentation is based on the economic, regulatory, market and other conditions as in effect on the date hereof. It should be understood that subsequent developments may
affect the information contained in this presentation, which neither the Bank nor its advisors or representatives are under an obligation to update, revise or affirm.
The information communicated in this presentation contains certain statements that are or may be forward-looking. These statements typically contain words such as “will,”
“expects” and “anticipates” and words of similar import. By their nature forward-looking statements involve risk and uncertainty because they relate to events and depend on
circumstances that will occur in the future. Any investment in the Bank will also involve certain risks. There may be additional material risks that are currently not considered to be
material or of which the Bank and its advisors or representatives are unaware. Accordingly, you should not rely on these forward-looking statements. The Bank assumes no
responsibility to update forward-looking statements or to adapt them to future events or developments.
This presentation is not an offer of securities for sale in the United States. Any securities referred to herein have not been and will not be registered under the United States
Securities Act of 1933, as amended (the “Securities Act”) or any United States state securities laws, and may not be offered or sold in the United States except pursuant to an
exemption from, or in a transaction not subject to, the registration requirements of the Securities Act and in accordance with any applicable United States state securities laws.
There is no intention to register any securities referred to herein in the United States or to make a public offering of the securities in the United States.
This presentation and the information contained herein is being furnished to you solely for your information and may not be reproduced or redistributed by you to any other
person, in whole or in part. Neither the information contained herein nor any copy hereof may be, directly or indirectly, transmitted into or distributed in the U.S. or to any U.S.
person (as defined in Regulation S under the Securities Act), including their U.S. branches or affiliates, except (i) to “qualified institutional buyers” as defined under Rule 144A of
the Securities Act (“U.S. QIBs”) or (ii) in compliance with applicable securities laws, or transmitted into or distributed in Canada, Australia, Japan or any other jurisdiction which
prohibits such transmission or distribution. Any failure to comply with this restriction may constitute a violation of the securities laws of the United States or other jurisdictions. No
money, securities or other consideration is being solicited, and, if sent in response to this presentation or the information contained herein, will not be accepted.

            1.    USD amounts represent convenience translations at USD1= ` 75.51                                                                                                       2
ICICI Bank at a glance
                   ` 8.0 trillion at June 30, 2020
                                                                                        ` 264.62 billion in FY2020
                   5.4% market share1,2,3
                                                                               Core
                                                           Total           operating
                                                        deposits              profit6
 ` 3.4 trillion at June 30, 2020
 5.9% market share1,2,3          CASA5                                                                      13.29%7 at June 30, 2020
                                                                                      CET18 ratio
                                deposits

                                                                                        Distribution
` 6.3 trillion at June 30, 2020 Advances                                                   network
                                                                                                     5,324 branches and 15,661
                                                                                                     ATMs at Jun 30, 2020
 6.0% market share1,2,4

                                                                                             6.   Includes net interest income, commission, exchange and
     1.   At March 31, 2020                                                                       brokerage, income from exchange/derivative transactions,
     2.   Relating to domestic branches                                                           dividend income from subsidiaries and other income less
     3.   Source: Statement No. 4B : District wise and Type-wise Distribution of Aggregate        operating expenses
          Deposits with Scheduled Commercial Banks, published by the Reserve Bank of India   7.   Excludes profit after tax of ` 25.99 billion for Q1-2021 which is
     4.   Source: Basic statistical return published by the Reserve Bank of India                 34 basis points of risk weighted assets
     5.   Current account and savings account                                                8.   Common equity Tier 1                                         3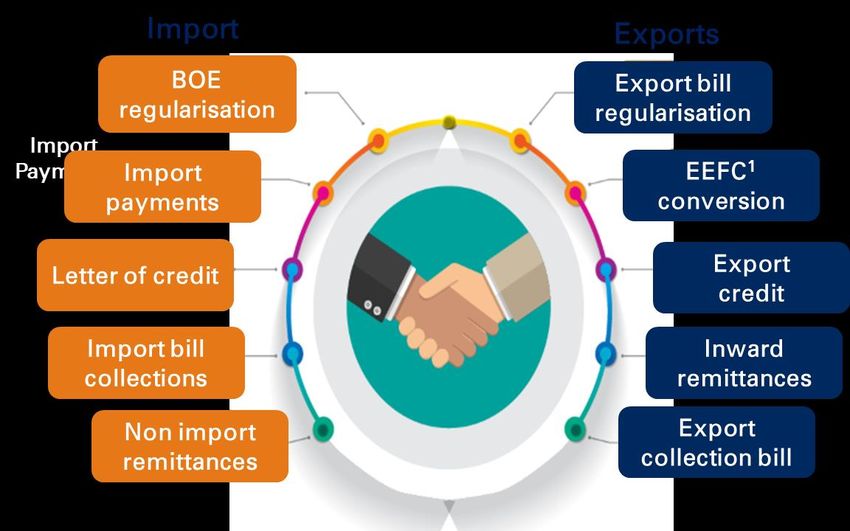
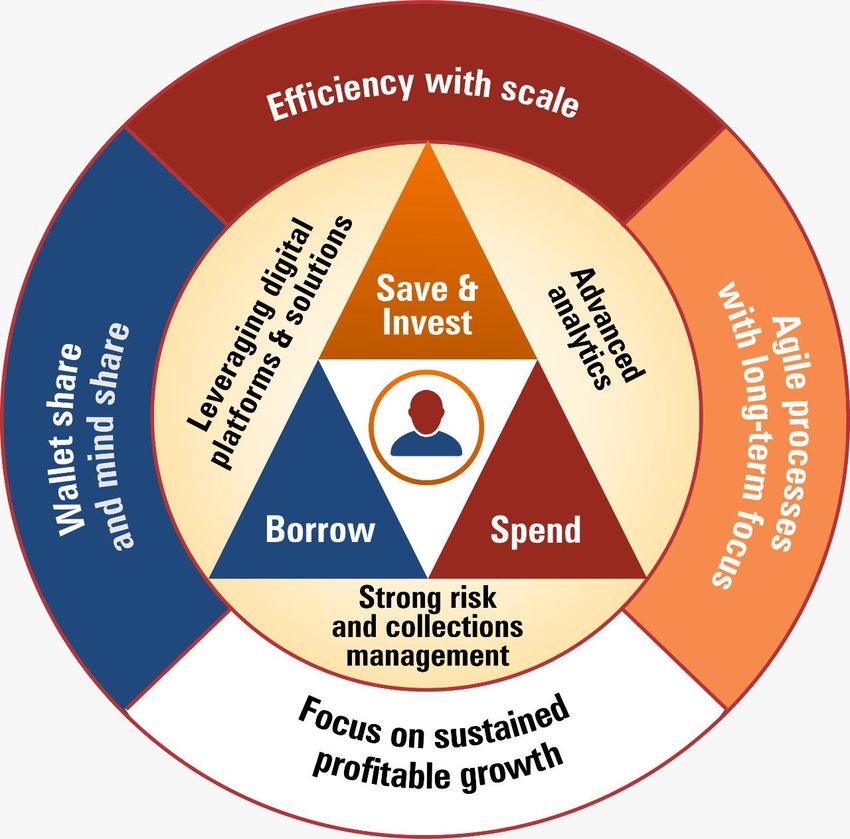
Approach

                                                   Decongest        Operating profit
                 Capture         Leverage                           aspiration linked
 360 degree                                        processes,
              opportunities       internal                             to market
  Customer                                        flexibility to
                 across       synergies, build                     potential, increase
   centric                                       operate within
               ecosystems      partnerships                         in market share
  approach                                       the guardrails

                                                                                    4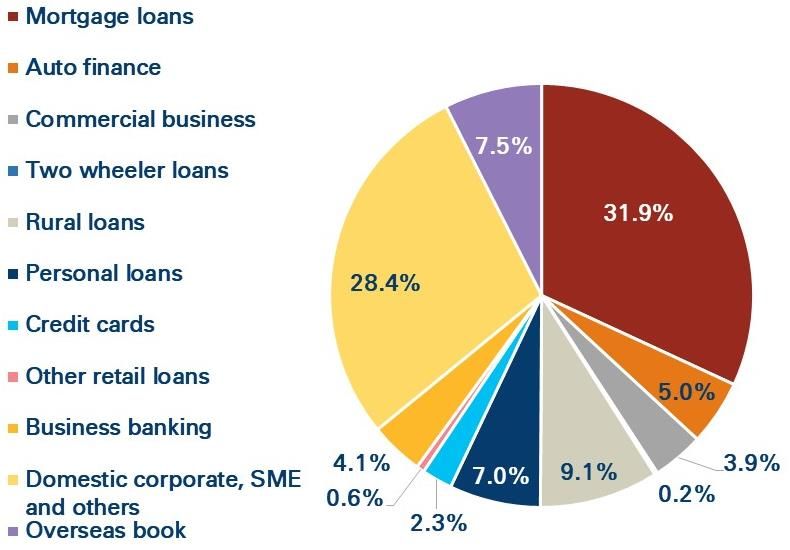
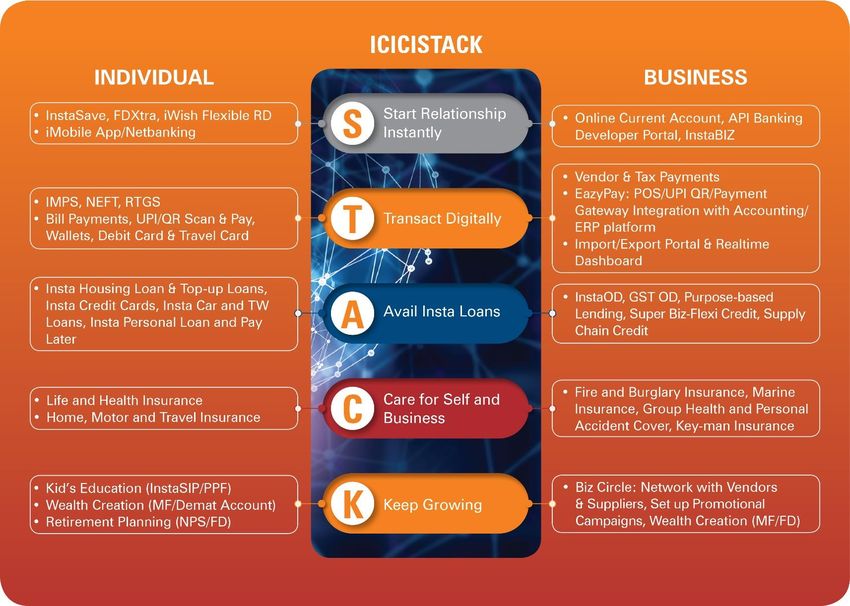
Approach to retail banking

                                   Micro market based approach

                             Create offerings based on ecosystems and
                                expand distribution as per potential

                                Digital onboarding and engagement

                               Use power of digital to decongest loan
                             process and follow rule based underwriting

                                 Use payments technology to build
                                          partnerships

                                 To build customer level models for
                                     optimised decision-making

                                                                        5
SME and business banking strategy
        Segmentation                                                    Product
 • Micro market based                                          • Industry specific customised
                                                                 solutions
 • Customer profile and
   risk categorisation
                                  1                        2   • Market, customer and
                                          Digital                employee insights based
                                                                 product innovation
                                          as force
                                          multiplier

        Distribution                                                    Partnership
  • Investment in distribution        4                3       • Collaboration with fintechs:
    aligned to current account                                   on-boarding, payments,
    deposit                                                      lending, cross border

  • Skill and capacity building                                • Ecosystem led approach to
                                                                 capture money-in-motion

                                                                                                6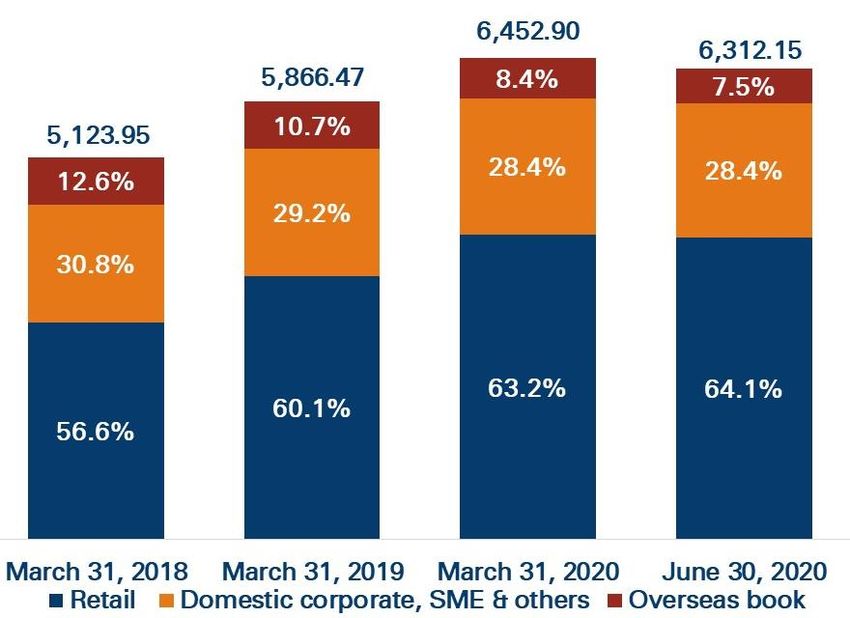
Wholesale banking approach

               Return of Capital                            Return on Capital

       Originating high quality assets             Ecosystem banking

       Continuous monitoring &
                                                   Transaction banking
       portfolio management

       Reduce concentration                        Focus on non-credit income

 Maximising risk calibrated operating profit by leveraging technology & analytics

                                                                                7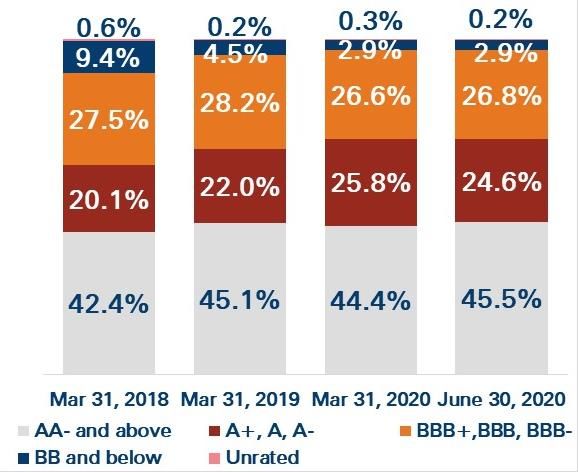
Engagement with partners
  Co-create products with partners to drive transformation aligned with ICICI
                           Bank’s digital roadmap

                                                          ₹
                  Innovation                         Investments
                    projects        Initiatives

         1 Interaction of partners, business groups and technology groups

         2 Equity investment into high growth and disruptive fintech startups

         3 Active engagement with startups

         4 Experiment with internal team of techno-preneurs

                                                                                8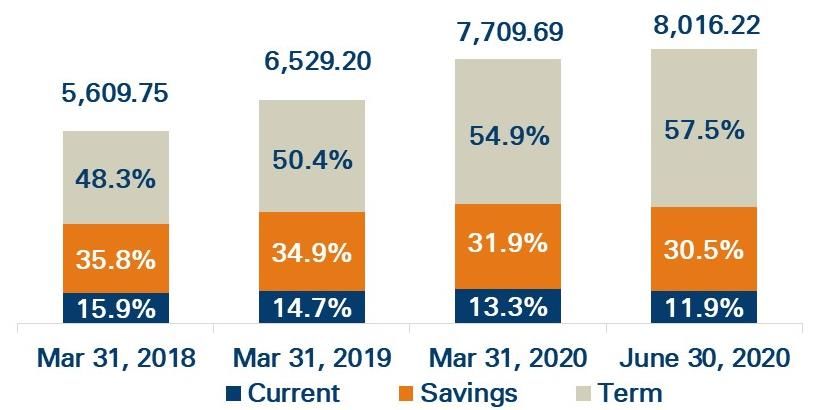
Core operating profit1 growth is our primary focus…

                (` billion)
                                 Y-o-Y                                       19.7%
                                growth                16.6%
                                6.1%

                                                                                                   16.5%

 Grow the core operating profit in a risk-calibrated manner through the focused
 pursuit of target market segments

    1.   Core operating profit includes net interest income, commission, exchange and brokerage, income from exchange/derivative
         transactions, dividend income from subsidiaries and other income less operating expenses                                9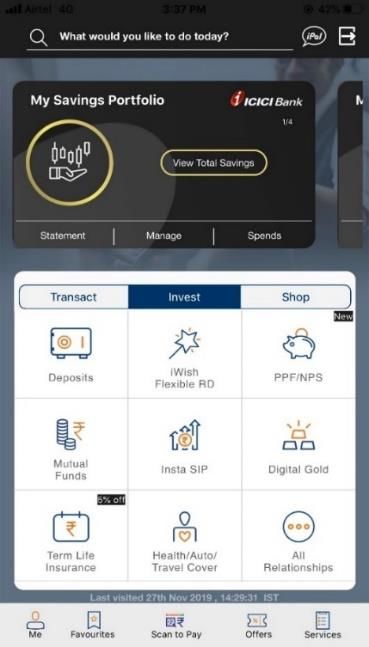
…driven by our robust deposit franchise…
                Total deposits                                Increase in deposits
 (` billion)
                                            (` billion)

Average CASA ratio and cost of deposits                   Liquidity coverage ratio

          Digital platforms and efforts towards process decongestion play an
          important role in growth of deposit franchise                              10
…diversified loan book (1/2)
Total advances
(` billion)
Including non-fund outstanding, the proportion of retail loans was 54.4% at June 30, 2020
Grow loan portfolio in a granular manner with a focus on risk and reward
11…diversified loan book (2/2)…
Composition of total loan book at June 30, 2020
1 Retail loan book
comprises 64.1%
Retail portfolio largely secured and built on proprietary data and analytics in
addition to bureau checks and well-priced in relation to risk
1. Includes dealer funding, loan against shares and others 12…with reducing overseas portfolio…
Total overseas loan book of USD 6.2 billion at
June 30, 2020
Approach to overseas portfolio
Total outstanding1 at June 30, 2020: USD 6.4 billion
• Focus on NRIs for deposits, wealth
and remittance businesses
• Deepening relationships with Indian
corporates in international markets
and MNCs present in global and
Indian markets, for maximising
India-linked trade, transaction
banking and lending opportunities
The overseas non-India linked corporate portfolio reduced by about 40.4% y-o-y and 16.1%
sequentially at June 30, 2020
Progressively exiting exposures that are not linked to India, in a planned
manner
1. Includes corporate fund and non-fund outstanding of overseas branches, net of cash/bank/insurance backed lending 13…improving portfolio quality…
Rating profile1,2 of overall loan book Corporate and SME BB and Reduction in concentration risk
below outstanding1,2
(` billion)
3
1
1. Fund and non-fund based outstanding
1. Based on internal rating of the Bank 2. Excludes banks, investments and
2. For retail loans, ratings have been fund-based outstanding to NPAs 1. Includes banks
undertaken at portfolio level Meaningful change in the profile
3. BB and below includes NPAs
of exposures to top borrowers
and groups
14…backed by our digital capabilities (1/7)
15…backed by our digital capabilities (2/7)
Reliable, modern and secure platforms
Frictionless insta
Retail internet banking iMobile
products
Wide range of higher engagement
Customised recommendations
•59% SIPs initiated digitally1
products
Personalised and native dashboard
based on user persona, •63% of fixed deposits sourced
machine learning digitally1
n=1
90%+ of savings accounts transactions1,2 done through digital channels3
1. In Q1-2021
2. Financial and non-financial transactions
16
3. Includes internet, mobile, POS, touch banking, phone banking and debit cards e-commerce transactions…backed by our digital capabilities (3/7)
Platforms offering seamless services to small business customers
InstaBIZ API1 Banking Portal
Online account opening
Instant overdraft
Seamless vendor payments
and bank reconciliation
Enabling partners to integrate
Easy collection via multiple various payment and product
modes solutions in few days; APIs
available across an arrays of
Online foreign trade categories including payments &
transactions collections
17
1. Application Programme Interface…backed by our digital capabilities (4/7)
Trade and payment solutions
UPI2 merchant acquiring
Trade online
and toll collections
CASA
Cross Richer
UPI
Sell Data
Acquire
Market share of 28% in UPI P2M3
transactions in June 2020;
ranked 2nd in the industry 5
Pioneer in FASTag4 program by
onboarding state highways
1.
2.
EEFC: Exchange Earner's Foreign Currency
United Payment Interface Market leader with share
3. Payments to merchants of 38% by value in June 20205
4. Electronic toll collection system 18
5. Source: National Payments Corporation of India…backed by our digital capabilities (5/7)
Digital financial supply chain
Diverse corporate needs
Supply chain One stop
Multiple
payment
Faster
access to
Real time
solution realisation
solutions methods finance
1 SAP Integrated solution1 2 Non-ERP integrated digital model
Automatic integration with corporates’ ERP Dealer level solution for corporates
Suppliers Distributors Suppliers Distributors
API based seamless automation Upstream and downstream journey
Value delivered to corporate
Seamless Reduced
banking Digital and Intelligent Better risk
working
experience paperless reporting control
capital
19
1. Partnership with SAP Technologies and Arteria…backed by our digital capabilities (6/7)
Bespoke solutions for corporate customers
Transaction banking platforms Industry specific solutions
e-SOFTEX for IT/ITES: Digital & Digi-Commodity: Digital collection of
paperless process for export settlement auction proceeds and auto reconciliation of
outstanding invoices, allowing for deal-wise
iXpress Connect: Enables corporate settlement across multiple stakeholders
clients to remotely design, develop, test, use
and integrate their systems with the Bank
through APIs
eTendering: Platform to digitize
procurement using API based system integrations
Corporate internet banking:
Integrated & paperless next-gen platform for all
corporate banking needs
20…backed by our digital capabilities (7/7)
Partnerships and recent initiatives
Partnerships Video KYC WhatsApp Banking
Co-branded credit cards with
Amazon Pay, MakeMyTrip
• To on board salary account,
• Providing frictionless on- personal loan and Amazon Pay
boarding experience with Credit Card customers
instant credit card generation • the whole process is digital via a
• Leveraging artificial video call, frictionless, fast and
intelligence & machine zero physical contact
learning with partners to
enhance customer experience
1 million+ users
21Gross NPA additions have declined and provision coverage
ratio has improved substantially
Gross NPA additions1 Provision coverage ratio3 NPA ratios1
(` billion)
2
4
1. Based on customer assets
2. Lower gross NPA additions in Q1-2021 reflect the asset classification standstill benefit on loans under moratorium
3. Excluding technical write-offs 22
4. Gross NPA additions as a percentage of opening gross customer assets, annualised for Q1-2021Loans under moratorium
• Moratorium is a policy and regulatory support to customers facing sudden
cashflow depletion or potential future uncertainty
• The Bank’s approach to moratorium has been to permit the same for
customers seeking it, after due engagement
• From about 30.0% of total loans being under moratorium at end-April, the
loans to customers where moratorium was effected for June repayments was
about 17.5% of total loans at June 30, 2020; in line with expectations and the
gradual resumption of economic activities in June 2020
• About 90% of the portfolio under moratorium at end-June 2020 comprises
loans that were also under moratorium at end-May 2020
23Collections strategy
Pre-delinquency management engine Strengthened the collections
• Using artificial intelligence infrastructure
• Re-organized sales, credit, operations
• Uses more than multiple variables to
and customer service teams
create various microsegments
• Connected to over 400,000
• Accurately forecasts most of the customers on a daily basis using
bounces for the right intervention at Cloud Telephony and Voicebots to
the right time counsel on moratorium
• In view of the current environment • Using API based integrations with
additional markers such as zones under large payment channels to ensure
lockdown, industries directly impacted timely credit of the overdue amount
by Covid-19 and salary uploads added
24Approach to asset quality and provisioning
• Construct the portfolio in a manner that does not deliver concentrated
shocks
• Build an operating profit base that can absorb required provisions
• Remain proactive in provisioning with the objective of ensuring that the
balance sheet is robust and the impact on earnings is recognized on a
prudent basis
Provisions of ` 143.68 billion (2.3% of advances) not considered in computation
of PCR1 at June 30, 2020
1. Provision coverage ratio 25Maintain a strong capital base
1 Capital adequacy ratios well above the
minimum regulatory requirement of CET1
1 ratio of 7.58%, Tier I ratio of 9.08% and
total capital adequacy ratio of 11.08%
Capital position after making the further Covid-19 related provisions continued
1
to be healthy with a CET-1 ratio of 13.29% at June 30, 2020
26
1. Excludes profit after tax of ` 25.99 billion for Q1-2021 which is 34 basis points of risk weighted assetsOur subsidiaries have extended our franchise…
• Leading private life insurer in India • Leading private non-life insurer in
with a comprehensive and diverse India with a comprehensive and
savings and protection products diverse product portfolio (motor,
(linked, non-linked, retail and group) crop, fire, marine, health, travel)
• Leading equity broker in India • Leading AMC with average assets
powered by ICICIdirect: 3-in-1 under management of ₹ 3.3 trillion
proprietary electronic brokerage as of Q1-20211
platform offering wide range of
products
…and also provided us opportunities for value unlocking
1. Based on Average Assets Under Management (AAUM) based on Association of Mutual Funds in India (AMFI) data for 27
quarter ending June 30, 202028
Thank you
Additional financial information

                                   30
Standalone operating performance
31Profit & loss statement
(` billion) FY2020 Q1-2020 Q1-2021 Q1-o-Q1
growth
Net interest income1 332.67 77.37 92.80 19.9%
Non-interest income 148.10 30.90 23.02 (25.5)%
- CEB 2and income from exchange/derivative
134.52 28.77 20.83 (27.6)%
transactions
- Dividend income from subsidiaries 12.73 1.91 1.87 (2.1)%
- Other income 0.85 0.22 0.32 -
Core operating income 480.77 108.27 115.82 7.0%
Operating expenses 216.15 48.74 46.46 (4.7)%
- Employee expenses 82.71 19.53 21.66 10.9%
- Non-employee expenses 133.44 29.21 24.80 (15.1)%
Core operating profit 264.62 59.53 69.36 16.5%
1. Includes interest on income tax refund of ` 0.24 bn in Q1-2021 (FY2020: ` 2.70 bn, Q1-2020: ` 1.84 bn)
32
2. Commission, exchange and brokerageProfit & loss statement
(` billion) FY2020 Q1-2020 Q1-2021 Q1-o-Q1
growth
Core operating profit 264.62 59.53 69.36 16.5%
Profit on sale of investments 16.39 3.36 38.411 -
Operating profit 281.01 62.89 107.77 71.4%
Covid-19 related provisions 27.25 - 55.50 -
Other provisions 113.28 34.96 20.44 (41.5)%
Profit before tax 140.48 27.93 31.83 14.0%
Tax 61.17 8.85 5.84 (34.0)%
Profit after tax 79.31 19.08 25.99 36.2%
1. Includes profit of ` 30.36 billion from sale of 1.5% shareholding in ICICI Life and 4.0% sale of shareholding in ICICI General 33Key ratios
Percent FY2020 Q1-2020 Q1-2021
Net interest margin1 3.73 3.61 3.69
Provisions/core operating profit 42.83 58.7 29.53
Provisions/average advances 1.863 2.40 1.303
Core operating profit/average assets 2.72 2.53 2.55
Return on average assets2 0.81 0.81 0.95
Standalone return on equity2 7.1 7.0 8.9
Consolidated return on equity2 8.1 8.7 10.0
Weighted average EPS (`)2 12.3 11.9 16.1
Book value (`) 180.0 171.1 183.2
1. Includes interest on income tax refund of ` 0.24 bn in Q1-2021 (FY2020: ` 2.70 bn, Q1-2020: ` 1.84 bn)
2. Annualised for all interim periods
3. Excluding Covid-19 related provisions 34Yield, cost and margin
Movement in yield, costs & FY2020 Q1-2020 Q1-2021
margins (Percent)1
Yield on total interest-earning 8.38 8.40 7.93
assets
- Yield on advances 9.45 9.36 9.30
Cost of funds 5.09 5.23 4.61
- Cost of deposits 4.96 5.08 4.53
Net interest margin 3.73 3.61 3.69
- Domestic 4.01 3.93 3.91
- Overseas 0.35 0.33 0.33
1. Annualised for all interim periods 35Unconsolidated segment-wise PBT
Profit before tax (` billion) FY2020 Q1-2020 Q1-2021
Retail 89.93 19.68 27.59
Wholesale 9.27 (5.06) 10.16
Treasury 50.55 10.77 48.89
Others 5.83 2.54 0.69
Unallocated (15.10)1 - (55.50)1
Total 140.48 27.93 31.83
1. Represents Covid-19 related provision 36Standalone balance sheet
37Balance sheet: liabilities
(` billion) Jun 30, 2019 Mar 31, 2020 Jun 30, 2020
Net worth 1,104.00 1,165.04 1,186.19
- Equity capital 12.91 12.95 12.95
- Reserves 1,091.09 1,152.09 1,173.24
Deposits 6,607.32 7,709.69 8,016.22
- Current 804.01 1,022.28 957.80
- Savings 2,184.76 2,455.91 2,448.36
- Term 3,618.55 4,231.51 4,610.07
Borrowings1 1,567.20 1,628.97 1,649.18
Other liabilities 359.01 479.95 534.54
Total liabilities 9,637.53 10,983.65 11,386.13
1. Including impact of rupee depreciation 38Composition of borrowings
(` billion) Jun 30, Mar 31, Jun 30,
2019 2020 2020
Domestic 890.01 1,029.43 1,124.52
- Capital instruments 255.01 218.17 193.41
- Other borrowings 635.00 811.26 931.11
- Long term infrastructure bonds 194.97 194.77 194.92
Overseas borrowings1 677.19 599.53 524.66
Total borrowings 1,567.20 1,628.97 1,649.18
1. Including impact of rupee depreciation 39Funding profile
(` billion) Jun 30, Mar 31, Jun 30, Y-o-Y % share at
2019 2020 2020 growth Jun 30, 2020
CASA 2,988.77 3,478.18 3,406.16 14.0% 42.5%
- Current 804.01 1,022.27 957.80 19.1% 11.9%
- Savings 2,184.76 2,455.91 2,448.36 12.1% 30.5%
Term 3,618.55 4,231.51 4,610.07 27.4% 57.5%
Total deposits 6,607.32 7,709.69 8,016.22 21.3% 100.0%
40Balance sheet: assets
(` billion) Jun 30, Mar 31, Jun 30,
2019 2020 2020
Cash & bank balances 657.48 1,191.56 1,212.51
Investments 2,199.96 2,495.31 3,018.50
- SLR investments 1,533.75 1,883.20 2,258.36
- Equity investment in subsidiaries 98.03 98.03 97.63
Advances 5,924.15 6,452.90 6,312.15
Fixed & other assets 855.94 843.88 842.96
- RIDF 1and related 291.41 287.57 282.18
Total assets 9,637.53 10,983.65 11,386.13
• Floating rate loan book was ~69.0% of total domestic loans at Jun 30, 2020; of
which ~71.0% is linked to MCLR and ~19.0% is linked to repo rate
1. Rural Infrastructure Development Fund 41Loan portfolio
(` billion) Jun 30, Mar 31, Jun 30, Y-o-Y % share at
2019 2020 2020 growth Jun 30, 2020
Advances 5,924.15 6,452.90 6,312.15 6.5% 100.0%
- Domestic book 5,327.75 5,913.23 5,841.87 9.6% 92.5%
- Retail 3,635.96 4,080.03 4,045.76 11.3% 64.1%
- Corporate, SME and
others 1,691.79 1,833.21 1,796.11 6.2% 28.4%
- Overseas book1 596.40 539.67 470.27 (21.1)% 7.5%
• Including non-fund based outstanding, the share of retail portfolio was 54.4% of the
total portfolio at Jun 30, 2020 (Mar 31, 2020: 53.3%)
1. Includes impact of exchange rate movement
42Retail portfolio
(` billion) Jun 30, Mar 31, Jun 30, Y-o-Y % share at
2019 2020 2020 growth Jun 30, 2020
Mortgage loans 1,839.30 2,002.24 2,011.11 9.3% 49.7%
Vehicle loans 560.58 583.31 575.32 2.6% 14.2%
- Auto finance 314.78 322.17 313.41 (0.4)% 7.7%
- Commercial business 232.61 246.50 247.96 6.6% 6.1%
- Two wheeler loans 13.19 14.63 13.96 5.8% 0.3%
Business banking 193.45 265.63 258.72 33.7% 6.4%
Rural loans 500.33 568.50 571.77 14.3% 14.1%
Personal loans 344.42 452.88 439.80 27.7% 10.9%
Credit cards 136.94 156.54 147.29 7.6% 3.6%
Others 60.94 50.93 41.75 (31.5)% 1.0%
- Dealer funding loans 42.84 33.53 26.95 (37.1)% 0.7%
- Loan against shares and others 18.10 17.39 14.80 (18.2)% 0.4%
Total retail loans1 3,635.96 4,080.03 4,045.76 11.3% 100.0%
1. Includes buyouts of ` 71.76 billion at Jun 30, 2020 (Jun 30, 2019: ` 84.27 billion; Mar 31, 2020: ` 75.13 billion) 43Equity investment in subsidiaries
(` billion) Jun 30, Mar 31, Jun 30,
2019 2020 2020
ICICI Prudential Life Insurance 32.97 32.97 32.75
ICICI Bank Canada 18.74 18.74 18.74
ICICI Bank UK 18.05 18.05 18.05
ICICI Lombard General Insurance 13.49 13.49 13.31
ICICI Home Finance 11.12 11.12 11.12
ICICI Securities Limited 1.28 1.28 1.28
ICICI Securities Primary Dealership 1.58 1.58 1.58
ICICI AMC 0.61 0.61 0.61
ICICI Venture Funds Mgmt 0.05 0.05 0.05
Others 0.14 0.14 0.14
Total 98.03 98.03 97.63
44Asset quality
45NPA trends
(` billion) Jun 30, 2019 Mar 31, 2020 Jun 30, 2020
Gross NPAs1 457.63 414.09 403.86
Less: cumulative provisions1 339.06 312.95 317.11
Net NPAs1 118.57 101.14 86.75
Gross NPA ratio1 6.49% 5.53% 5.46%
Net NPA ratio1 1.77% 1.41% 1.23%
Provision coverage ratio2 74.0% 75.7% 78.6%
• Net restructured loans were ` 2.94 billion at June 30, 2020
(March 31, 2020 : ₹ 2.87 billion)
1. Based on customer assets
2. Excluding technical write-offs 46Retail NPAs
Retail NPAs (` billion) Jun 30, Mar 31, Jun 30,
2019 2020 2020
Gross retail NPAs 69.73 83.32 83.71
- as a % of gross retail advances 1.90% 2.02% 2.04%
Net retail NPAs 29.61 36.80 30.40
- as a % of net retail advances 0.81% 0.90% 0.75%
47NPA addition trends
NPA movement1 (` billion) FY2020 Q1-2020 Q1-2021
Opening gross NPA 462.92 462.92 414.09
Add: gross additions 142.95 27.79 11.60
- Retail 57.85 15.112 6.02
- Corporate, SME and others 85.10 12.68 5.58
Less: recoveries, upgrades & others 76.73 9.31 7.57
- Retail 27.20 5.09 4.17
- Corporate, SME and others 49.53 4.22 3.40
Net additions 66.22 18.48 4.03
Less: write-offs 113.00 22.00 14.26
: sale of NPAs 2.05 1.77 -
Closing gross NPAs 414.09 457.63 403.86
1. Based on customer assets
2. Includes slippages from the kisan credit card portfolio of ` 4.52 billion in Q1-2020 48Corporate and SME: BB and below
` billion Jun 30, 2019 Mar 31, 2020 Jun 30, 2020
BB and below outstanding1,2,3 153.55 166.68 171.10
- Fund and non-fund o/s to restructured loans 2.42 1.80 1.68
- Non-fund o/s to non-performing loans4 36.27 50.63 48.29
- Borrowers under RBI resolution schemes5 40.03 15.33 14.60
- Other borrowers with o/s greater than ` 1.00 bn5 31.86 65.98 70.69
- Other borrowers with o/s less than ` 1.00 bn5 42.97 32.94 35.84
1. Excludes banks
2. Excludes investments
3. Excludes fund-based outstanding to NPAs
4. Provisions of ` 13.98 billion were held against non-fund o/s to non-performing loans at Jun 30, 2020 (Jun 30, 2019: `
13.51 billion; Mar 31, 2020: ` 11.82 billion)
5. Fund-based and non-fund based outstanding 49Movement in Corporate and SME BB and below in Q1-2021
(` billion)
1,2,3,4 5,6 1,2,3,4
5
1. Fund-based and non-fund based outstanding
2. Excludes banks
3. Excludes investments
4. Excludes fund-based outstanding to NPAs
5. Excludes fund-based outstanding to accounts downgraded from investment grade during Q1-2021 and classified as
non-performing during the same quarter
6. Includes devolvement of non-fund based outstanding to existing NPAs 50Provisions not considered in provision coverage ratio
• Provisions of ` 143.68 billion (2.3% of outstanding loans) not considered in
the computation of provision coverage ratio at Jun 30, 2020
• Provision of ` 82.75 billion related to Covid-19
• General provision of ` 41.85 billion on standard assets (other than Covid-19
related)
• Provision of ` 13.98 billion on non-fund based outstanding to NPAs
• Other provisions of ` 5.10 billion on standard assets
51NBFCs, HFCs and builder portfolio
Outstanding (` billion) Jun 30, Mar 31, Jun 30,
2019 2020 2020
NBFCs1 264.85 273.08 300.65
HFCs1 155.16 124.47 140.97
Builder portfolio (construction finance, lease rental 202.49 223.18 218.48
discounting, term loans and working capital loans)
1. Includes loans, investment and non-fund based outstanding 52Sector-wise exposures
Top 10 sectors1: % of total Mar 31, Mar 31, Mar 31, Jun 30,
exposure of the Bank 2018 2019 2020 2020
Retail finance 34.2% 37.3% 40.5% 41.0%
Services – finance 7.0% 7.3% 8.4% 8.5%
Crude petroleum/refining & 5.6% 5.7% 5.9% 6.3%
petrochemicals
Banks 8.4% 7.9% 6.4% 6.2%
Electronics & engineering 6.7% 6.6% 6.0% 5.4%
Road, port, telecom, urban 4.2% 4.6% 4.3% 3.8%
development & other infra
of which: Telecom 1.5% 2.0% 1.7% 1.4%
Power 4.6% 3.3% 3.1% 2.9%
Wholesale/retail trade 2.8% 3.1% 3.3% 2.9%
Services - non finance 3.3% 3.1% 2.7% 2.7%
Construction 3.2% 2.9% 2.5% 2.4%
Total (` billion) 10,265 11,207 12,446 12,319
53
1. Top 10 based on position at Jun 30, 2020Capital
54Strong capital position
Mar 31, 2020 Jun 30, 20201
(` billion) % (` billion) %
Total capital 1,223.85 16.11% 1,222.33 16.00%
- Tier I 1,117.85 14.72% 1,115.88 14.61%
- of which: CET1 1,016.65 13.39% 1,014.68 13.29%
- Tier II 106.00 1.39% 106.45 1.39%
Risk weighted assets 7,594.90 7,635.83
- On balance sheet 6,676.25 6,764.69
- Off balance sheet 918.65 871.14
• Capital adequacy ratios well above the minimum regulatory requirement of CET1
ratio of 7.58%, Tier I ratio of 9.08% and total capital adequacy ratio of 11.08%
1. Excludes profit after tax of ` 25.99 billion for Q1-2021 which is 34 basis points of risk weighted assets 55Consolidated capital adequacy
Basel III (%) Mar 31, Jun 30,
2020 20201
Total capital 15.81% 15.62%
- Tier I 14.41% 14.24%
- of which: CET 1 13.21% 13.05%
- Tier II 1.40% 1.38%
1. Excludes profit after tax of ` 31.18 billion for Q1-2021 which is 37 basis points of risk weighted assets
56Consolidated financials
57Consolidated profit & loss statement
(` billion) FY2020 Q1-2020 Q1-2021 Q1-o-Q1
growth
Net interest income 401.70 93.57 110.76 18.4%
Non-interest income 649.50 135.03 155.16 14.9%
- CEB 1and income from 158.85 34.87 28.15 (19.3)%
exchange/derivative transactions
- Premium income 455.01 92.67 85.25 (8.0)%
2
- Other income 35.64 7.49 41.76 -
Total income 1,051.20 228.60 265.92 16.3%
Operating expenses 715.18 150.93 143.00 (5.3)%
Operating profit 336.02 77.67 122.92 58.3%
1. Commission, exchange and brokerage
2. Includes profit of ` 27.16 billion from sale of 1.5% shareholding in ICICI Life and 4.0% sale of shareholding in ICICI General 58Consolidated profit & loss statement
(` billion) FY2020 Q1-2020 Q1-2021 Q1-o-Q1
growth
Operating profit 336.02 77.67 122.92 58.3%
Covid-19 related provisions 27.25 - 55.50 -
Other provisions 122.89 35.58 21.55 (39.4)%
Profit before tax 185.88 42.09 45.87 9.0%
Tax 73.63 12.95 10.00 (22.8)%
Minority interest 16.59 4.00 4.69 17.3%
Profit after tax 95.66 25.14 31.18 24.0%
59Key ratios (consolidated)
Percent FY2020 Q1-2020 Q1-2021
Weighted average EPS1 14.8 15.7 19.3
Book value (`) 190 181 195
1. Annualised for all interim periods
60Portfolio composition (consolidated)
Jun 30, 2019 Mar 31, 2020 Jun 30, 2020
Domestic 83.8% 85.8% 86.5%
International 16.2% 14.2% 13.5%
Total consolidated advances 6,529 7,062 6,926
(` billion)
61You can also read