Deutsche Bank - Strategy on Group's Covered Bond Platforms - Marco Zimmermann, Head of Issuance Thomas Rueckert, Treasury Markets - Issuance ...
←
→
Page content transcription
If your browser does not render page correctly, please read the page content below

Deutsche Bank

       Deutsche Bank -
       Strategy on Group’s Covered Bond
       Platforms

       Marco Zimmermann, Head of Issuance
       Thomas Rueckert, Treasury Markets – Issuance
       Philip Teuchner/Nikolaus Poehlmann, Investor Relations

       June 2018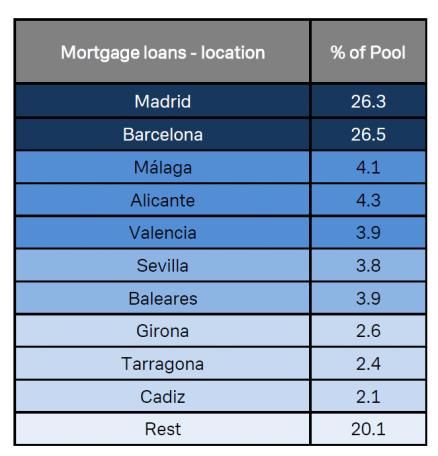
Agenda

    1           Deutsche Bank – Focus & Growth

    2           Deutsche Bank Covered Bond strategy

    3           Appendix

Deutsche Bank                                                                            2
Treasury                       Strategy on DB Group‘s Covered Bond Platforms June 2018
DB Group: A materially safer and more secure institution
In EUR bn, unless stated otherwise
2007 1Q 2018
Tier 1 capital 28 56
CET 1 capital ratio 8.6%(1) 13.4%
Total assets (IFRS) 2,020 1,478
Most stable funding(2) 30% 73%
(% of funded balance sheet)
Liquidity reserves 65 279
Level 3 assets 88 22
(1) 2007 ratio includes hybrid instruments as the definition of CET1 ratio did not exist under the previous Basel regimes (2) Most stable is defined as funds from Capital Markets & Equity, Retail, Transaction Banking and
Wealth Management deposits
Deutsche Bank 3
Treasury Strategy on DB Group‘s Covered Bond Platforms June 2018DB Group: Shifting towards a more stable revenue base
Our strategic priorities
1
Delivering on PCB and DWS to execute on communicated strategies
PCB and DWS
2
Reshaping Corporate & Investment Bank to focus on core strengths
CIB
3
Reducing cost Cut costs through a series of tactical and strategic measures
4 Shifting
towards more By 2021, ~65% of revenues are expected to come from
stable revenue stable businesses of PCB, DWS and GTB
profile
Deutsche Bank 4
Treasury Strategy on DB Group‘s Covered Bond Platforms June 20181 PCB: Delivering in the Private & Commercial Bank
Targeted
Key achievements Ongoing initiatives synergies Aspiration
Private — Sales channel optimisation
Clients and product consolidation
— Increase cross-sell and
— Legal entity merger and regulatory grow volumes in core 2022 synergy
Commercial
waiver approved segments run-rate
Clients
EUR 0.9 bn,
The — Successful transformation of our ~75%
Bank Digitali- Private- and Commercial Client — Combine DB / PB digital achieved by
for sation business in Germany programs 2021
2021:
Germany — Introduced new pricing models
One Bank — Single IT platform with RoTE >12%
EUR 1.9(1) bn
& Finance — Enhanced digital capabilities integrated operations CIR1 DWS: Delivering in DWS
Well diversified assets Strong investment performance DWS medium-term financial targets(3)
2017 AuM: € 700 bn % of DWS funds outperforming 2017 Medium-term targets
benchmarks(2)
Cash 8% 3% to 5%
Active multi-asset 8% 2.3%
78%
Active SQI
(1)
9%
74%
68% Net flows(3)
Alternatives 10%
Active equity 13% 31.5 bps ≥30bps
Management
Passive 17% fee margin
70%2 CIB: Reallocating leverage to higher return areas
In EUR bn, as of 31 March 2018, unless otherwise stated
Corporate & Investment Bank CRD4 leverage exposure
1,049
Pending settlements 52
Revenue/ Business Resource
Liquidity Reserve 243 Leverage allocation
(2017 in bps) intent Businesses
— GTB: Cash Management / payments
187 ~420 Grow — FIC: FX, Credit
— O&A: Debt origination
— GTB: Trade, Trust and Securities Services
Business Optimise / — O&A: Equity origination, Advisory
331 ~155
leverage Maintain — FIC: Rates ex-US
(EUR 754bn) — Equities: Trading, Derivatives
— Equities: Prime
Reduce /
237 ~42 — FIC: Repo / US Rates
Reprice
— Legacy assets
Note: Totals may not sum due to rounding
Deutsche Bank 7
Treasury Strategy on DB Group‘s Covered Bond Platforms June 20182 CIB: A resilient franchise
Global Transaction Banking FIC Sales & Trading
7.7
4.4 6.6
Rev. Share 3.9 Rev. Share
Trend Trend
Rev pool Rev pool
Trend Trend
2014-2016 Avg. 2017 DB 2019 rev. 2014-2016 Avg. 2017 DB 2019 rev.
expect vs 2017 expect vs 2017
— Build on strengths and invest in capabilities in Payments and Trade — Focus on capabilities in Financing & Treasury Solutions
— Cross-sell and coverage optimisation — Continue to invest in technology in FX
— Improve resource allocation — Redirect resources to higher return opportunities
— Upside from interest rate development — Optimise client coverage model
— Reduced impact from perimeter adjustments
Origination & Advisory Equity Sales & Trading
2.6 3.0
2.2
Rev. Share Rev. Share 2.1
Trend Trend
Rev pool Rev pool
Trend Trend 2014-2016 Avg. 2017 DB 2019 rev.
2014-2016 Avg. 2017 DB 2019 rev.
expect vs 2017 expect vs 2017
— Exit non-priority segments and re-allocate resources to core areas — Move away from high touch service model to focus on electronic
— Selective investments, especially in DCM and LDCM trading in Equity Trading
— Focus on European and multinational clients and cross-border — Increase use of our European hub in Derivatives
activity — 25% headcount reduction Equities
— 25% leverage reduction in Prime Finance
Deutsche Bank 8
Treasury Strategy on DB Group‘s Covered Bond Platforms June 20183 DB Group: Reducing costs
In EUR bn, unless stated otherwise
Adjusted costs(1)
(0.8)
24.7
(0.9)
23.9
(1.0)
23.0
22.0
2016 2017 2018 target 2019 target
(1) Adj. costs are calculated by deducting from noninterest expenses under IFRS (i) impairment of goodwill and other intangible assets, (ii) litigation, (iii) policyholder benefits and claims and (iv) restructuring & severance
Deutsche Bank 9
Treasury Strategy on DB Group‘s Covered Bond Platforms June 20183 DB Group: Cost reduction supported by FTE adjustments
Full-time equivalent (FTE) in thousands
97.1
Disposals
CIB ~1k reductions
PCB already completed
Infra-4 DB Group: Return on Tangible Equity trajectory
Post-tax RoTE, in %
93% 4%
2.9%(1)
2017 adj. Costs Revenues Other(2) 2019 target Costs Revenues Other(2) 2021
RoTE aspiration
Note: Totals may not sum due to rounding (1) Reported ROTE of (1.4)% adjusted to exclude EUR (513)m of DVA and movements in own credit spreads, EUR (570)m in restructuring & severance, EUR (213)m in litigation
and EUR (21)m in impairments assuming a 30% effective tax rate, as well as the EUR (1,437)m write-down in the carrying value of US deferred tax assets (2) Other includes provisions for credit losses and the impact of
higher capital
Deutsche Bank 11
Treasury Strategy on DB Group‘s Covered Bond Platforms June 2018Agenda
1 Deutsche Bank – Focus & Growth
2 Deutsche Bank Covered Bond strategy
3 Appendix
Deutsche Bank 12
Treasury Strategy on DB Group‘s Covered Bond Platforms June 2018Deutsche Bank Covered Bond strategy
Overview of DB Group’s covered bond platforms
Key Metrics of DB Group’s cover pools
Update on issuance strategy for covered bonds
Deutsche Bank 13
Treasury Strategy on DB Group‘s Covered Bond Platforms June 2018Overview of DB Group’s Covered Bond Platforms
Active platforms Other platforms with active collateral management
DB Privat- und
DB Mortgage Firmenkundenbank AG
DB SAE Cédulas DB SpA OBG
Pfandbrief (former Postbank AG)
covered bond programs
No future issuance out of DB
>88% prime residential Strong commitment to Strong commitment to Italian
Privat- und Firmenkundenbank AG
mortgage cover pool Spanish market(1) market(1)
planned
High quality cover pool (low
Currently only retained Replacement opportunities for
NPL ratio, high residential
100% German exposure issuances; no external market investors into DB Mortgage
share and strong risk
access yet Pfandbrief / Cédulas
controls)(2)
Outstanding: Outstanding: Three main cover pools(3):
Outstanding: €8.0 bn €2.5 bn (public placement) €3.5 bn (retained) - Residential mortgage: €3.7 / 5.5 bn
Cover Pool size: €10.5 bn €2.8 bn (retained) Cover Pool size: €4.4 bn - Public sector: €0.2 / 0.3 bn
Cover Pool size: €7.8 bn - Mixed(4): €8.4 / 9.3 bn
(1) Internationally, the Private & Commercial Bank intends to focus on growing markets like Italy and Spain while in Wealth Management, the bank will look to grow in Germany and in international markets. “We
intend to grow the business in our Private & Commercial Bank and at DWS,” Sewing said. Source: DB Investor Relations Media Release on 26 April 2018
(2) See Moody‘s Global Covered Bonds Monitoring Overview Q3 2017: https://www.moodys.com/researchdocumentcontentpage.aspx?docid=PBS_1113023; Among all Spanish peers, collateral score and cover
pool losses are one of the lowest. Both are Moody‘s metrics to assess quality of cover pool
(3) Outstanding bonds / cover pool size
(4) Former Deutsche Siedlungs- und Landesrentenbank AdöR now part of DB PFK AG pool; see more: https://www.postbank.de/postbank/wu_profil_marke_dsl_bank.html; DSL cover pool does not comply with
PfandBG but with DSLBUmwG
Deutsche Bank 14
Treasury Strategy on DB Group‘s Covered Bond Platforms June 2018DB Residential Mortgage Pfandbrief
Cover Pool – Key facts Cover Pool break down as of 31 Mar 2018(2)
Maturity Profile
Strong focus on residential mortgage loans > 88%; among the top group In EUR bn
of German peers 4.50
High quality mortgage book in cover pool (one of the lowest Moody‘s 4.00
Mortgage Pfandbriefe Cover Assets
collateral scores at 5.2% and one of the lowest cover pool losses at 3.50
15.9%(1))
3.00
Pure German mortgage, EUR only pool
2.50
Very granular loan portfolio: 74% with loan size EUR 0.3 mn or smaller
2.00
Pure German SSA additional cover assets as liquid overcollateralization
Highest Rating: Moody‘s Aaa 1.50
1.00
0.50
Mortgage Cover Pool – Key figures(2) 0.00
Cover Pool 4Q 2016 4Q 2017 1Q 2018
Pfandbrief Outstanding EUR 7.7 bn EUR 7.5 bn EUR 8.0 bn
Cover Pool Outstanding EUR 8.9 bn EUR 9.9 bn EUR 10.5 bn
OC(3) (as % of Outstanding Bonds) 16.30% 30.79% 30.80%
Number of loans 84,845 88,710 94,036 Mortgage Loans by type of use Mortgage Loans – Size by Nominal Value
VWA(4) in years of the maturity
that has passed since the loan 4.3 4.7 4.4 11.9% 7.8%
Residential ≤ 0.3mn EUR
was granted
Total pool weighted avg. Loan- Commercial 18.2%
53.84% 53.41% 53.38%
to-Value (LTV) ratio > 0.3mn and ≤ 1mn EUR
100% 100% 100%
Property Country
Germany Germany Germany > 1mn and ≤ 10mn EUR
Rating
Moody's Aaa Aaa Aaa
74.0%
88.1%
Note: Figures may not add up due to rounding differences
(1) See Moody‘s Global Covered Bonds Monitoring Overview Q3 2017: https://www.moodys.com/researchdocumentcontentpage.aspx?docid=PBS_1113023; Collateral score and cover pool losses are Moody‘s
metrics to assess quality of cover pool
(2) For details see: https://www.db.com/ir/en/mortgage-pfandbriefe.htm and PfandBG § 28 disclosure https://www.db.com/ir/en/mortgage-pfandbriefe.htm#tab_transparency-provisions-according-to-28-pfandbg
(3) Over-collateralization
(4) Volume weighted average
Deutsche Bank 15
Treasury Strategy on DB Group‘s Covered Bond Platforms June 2018DB SAE Cédulas
Cover Pool – Key facts Cover Pool break down as of 31 Mar 2018(2)
Mortgage Loans –
Maturity Profile Size by Nominal Value
Strong focus on residential mortgage loans > 95%
High quality mortgage book in cover pool (lowest collateral scores at In EUR bn
43%
6.7% and third lowest cover pool losses at 26.4%(1)) 1.0 1.0 0.9 37%
Very granular loan portfolio: 93% with loan size EUR 0.3 mn or smaller 0.8 Avg. EUR
Focus on economically resilient regions (Madrid / Barcelona) 0.5 98.6k
0.6
0.5
13%
4%
Mortgage Cover Pool – Key figures(2) 1% 2%
2018 2019 2020 2021 2022 2023 2024
Cover Pool 4Q 2016 4Q 2017 1Q 2018 Retained Public placement
Cédulas Outstanding EUR 5.3 bn EUR 5.3 bn EUR 5.3 bn
Cover Pool Outstanding(3) EUR 7.4 bn EUR 7.3 bn EUR 7.2 bn
OC(4) (as % of Outstanding Bonds) 40% 37% 36% Mortgage Loans by type of use Mortgage Loans by region
Number of loans 81,327 80,651 80,537
VWA(5) in years of the maturity
that has passed since the loan 6.9 7.2 7.3
was granted
Total pool weighted avg. Loan-to-
49.7% 49.3% 49.3%
Value (LTV) ratio
Spain Spain Spain
Property Country
100% 100% 100%
Rating
Moody’s/ S&P Aa2/A+ Aa2/A+ Aa2/A+(6)
Note: Figures may not add up due to rounding differences
(1) See Moody‘s Global Covered Bonds Monitoring Overview Q3 2017: https://www.moodys.com/researchdocumentcontentpage.aspx?docid=PBS_1113023;
Collateral score and cover pool losses are Moody‘s metrics to assess quality of cover pool
(2) For details see: DB SAE Cover Pool update as of 31st Mar 2018: https://www.db.com/ir/en/download/Q1_2018_Cedulas_Cover_Pool_update.pdf
(3) Considering only eligible collateral; cover pool in total EUR 7.8 bn as of 1Q 2018
(4) Over-collateralization
(5) Volume weighted average
(6) Moody’s rating upgrade by one notch from Aa2 to Aa1 on 17th April 2018
Deutsche Bank 16
Treasury Strategy on DB Group‘s Covered Bond Platforms June 2018DB SpA OBG
Cover Pool – Key facts Cover Pool break down as of 31 Mar 2018
Currently retained issuances only: Maturity Profile
In EUR bn
ISIN Rating Issue Date Maturity Notional Amount Currency
IT0005115024 Aa2 29-May-15 28-Jul-22 3,000 mn EUR 4.0 OBGs Cover Assets
IT0005115123 Aa2 29-May-15 28-Jul-21 500 mn EUR 3.5
3.0
Focus on residential mortgage loans = 100% 2.5
EUR 700mn Covered Pool replenishment executed in March 2018 2.0
1.5
1.0
0.5
Mortgage Cover Pool – Key figures 0.0
Cover Pool 4Q 2016 4Q 2017 1Q 2018
OBG Outstanding EUR 3.5 bn EUR 3.5 bn EUR 3.5 bn
Cover Pool Outstanding EUR 4.6 bn EUR 3.8 bn EUR 4.4 bn
OC(1) (as % of Outstanding Bonds) 30% 10% 25%
Number of loans 58,693 52,960 59,203
Mortgage Loans – Size by Nominal Value
VWA(2) in years of the maturity that
4.3 5.3 5.0
has passed since the loan was granted
3.0%
≤ 0.3mn EUR
Total pool weighted avg. Loan-to-
55.6% 54.3% 54.4%
Value (LTV) ratio > 0.3mn and ≤ 1mn EUR
Italy Italy Italy
Property Country
100% 100% 100%
Rating
Moody's Aa2 Aa2 Aa2
Note: Figures may not add up due to rounding differences
(1) Over-collateralization
(2) Volume weighted average 97.0%
Deutsche Bank 17
Treasury Strategy on DB Group‘s Covered Bond Platforms June 2018DB Privat-und Firmenkundenbank AG Covered Bonds (1/2)
Cover Pool – Key facts Cover Pool “C” break down as of 31 Mar 2018(2)
No future issuances out of new DB Privat- und Firmenkundenbank AG Maturity Profile
5 cover pools: In EUR bn
Cover Pools Issuer Classification Status Covered Bonds Cover Assets
A DSL Bank AdöR mortgage pool closed Out of 2.5
B DSL Bank AdöR public sector pool active; max. tenor Feb 2019 scope
2.0
(former DSL)
C Postbank AG(1) mixed pool active; max. tenor Sep 2032 1.5
D Postbank AG(1) mortgage pool active; max. tenor Jul 2036 (2) 1.0
E Postbank AG(1) public sector pool active; max. tenor Apr 2032 0.5
0.0
Register “C” Cover Pool (DSLBUmwG) – Key figures(2)
Mixed pool with 1/3 of mortgage loans and 2/3 of other loans(3)
Balanced asset-liability profile
Cover Pool 4Q 2016 4Q 2017 1Q 2018
C Covered Bonds Outstanding
Mortgage Loans (EUR 2.7bn) – Other Loans(3) (EUR 6.6bn) –
EUR 10.7 bn EUR 8.4 bn EUR 8.1 bn Size by Nominal Value
Size by Nominal Value
Cover Pool Outstanding EUR 12.0 bn EUR 9.6 bn EUR 9.3 bn
OC(4) (as % of Outstanding Bonds) 12.32% 14.07% 14.27% ≤ 0.3mn EUR ≤ 10mn EUR
15.8% 1.3% 13.8%
VWA(5) in years of the maturity that > 10mn and ≤ 100mn EUR
1.1% > 0.3mn and ≤ 1mn EUR
has passed since the loan was 10.4 10.8 11 > 100mn EUR
> 1mn and ≤ 10mn EUR
granted
1.2%
> 90% > 90% > 90% > 10mn EUR
Loan Origin Country
Germany Germany Germany
Rating Not rated
82.0%
84.8%
Note: Figures may not add up due to rounding differences
(1) Postbank AG merged into DB Privat- und Geschäfstkundenbank AG, the merged institute was renamed in DB Privat-und Firmenkundenbank AG as of 25 May 2018
(2) For details see PfandBG § 28 or DSLBUmwG disclosures: www.postbank.com/postbank/en/ir_ratings_income_collateral_pool.html
(3) Securities (mainly bonds or promissory note loans) with public-sector borrowers such as federal government and other German municipalities and in addition German Pfandbriefe
(4) Over-collateralization
(5) Volume weighted average
Deutsche Bank 18
Treasury Strategy on DB Group‘s Covered Bond Platforms June 2018DB Privat- und Firmenkundenbank AG Covered Bonds (2/2)
Mortgage Cover Pool “D” (PfandBG) – Key figures(1) Cover Pool “D” break down as of 31 Mar 2018(1)
Focus on residential mortgage loans = 100% Mortgage Loans – Size by
Granular mortgage loan portfolio: 97.8% < EUR 0.3mn Maturity Profile Nominal Value
Cover Pool 4Q 2016 4Q 2017 1Q 2018 In In
EUREUR
bnbn
D Pfandbrief Outstanding EUR 3.7 bn EUR 3.8 bn EUR 3.7 bn 1.8 Mortgage Pfandbriefe Cover Assets
1.6 2.1% 0.03% ≤ 0.3mn EUR
Cover Pool Outstanding EUR 5.4 bn EUR 5.4 bn EUR 5.5 bn 1.4
OC(2) (as % of Outstanding Bonds) 45.51% 44.22% 47.32% 1.2 > 0.3mn and ≤ 1mn EUR
1.0
Number of loans 70,905 68,456 68,375 0.8 > 1mn and ≤ 10mn EUR
VWA(3) in years of the maturity that 0.6
has passed since the loan was 6.1 6.4 6.3 0.4
granted 0.2
0.0
Total pool weighted avg. Loan-to-
55.6% 55.6% 55.6%
Value (LTV) ratio
100% 100% 100%
Property Country
Germany Germany Germany 97.8%
Rating
Fitch AAA AAA AAA
Public Sector Cover Pool “E” (PfandBG)– Key figures(1) Cover Pool “E” break down as of 31 Mar 2018(1)
Maturity Profile Other Loans(4) – Size by
9 public sector assets with volumes mainly between EUR 10-100mn
Nominal Value
In EUR mn
Cover Pool 4Q 2016 4Q 2017 1Q 2018 3.4%
E Pfandbrief Outstanding
200 Public Sector Pfandbriefe Cover Assets
≤ 10mn EUR
EUR 205 mn EUR 205 mn EUR 205 mn
150
Cover Pool Outstanding EUR 295 mn EUR 295 mn EUR 295 mn > 10mn and ≤ 100mn EUR
OC(2) (as % of Outstanding Bonds) 43.90% 43.90% 43.90% 100
Rating Not rated 50
0
Note: Figures may not add up due to rounding differences
(1) For details see PfandBG § 28 reporting: www.postbank.com/postbank/en/ir_ratings_income_collateral_pool.html 96.6%
(2) Over-collateralization
(3) Volume weighted average
(4) Securities (mainly bonds or promissory note loans) with public-sector borrowers such as federal government and in
addition one Luxembourg government bond
Deutsche Bank 19
Treasury Strategy on DB Group‘s Covered Bond Platforms June 2018DB’s issuance strategy
Frequent issuer in covered bond market via active Deutsche Bank platforms
Deutsche Bank AG’s covered bond platform intended to be prime refinancing instrument
for Group wide mortgages
Maintain European platforms to benefit from country-specific covered bond frameworks
Format: Liquid public benchmarks & private placements
2018 YTD: € 1.1bn of covered bond issuances vs. € 2-3bn planned
Deutsche Bank 20
Treasury Strategy on DB Group‘s Covered Bond Platforms June 2018Agenda
1 Deutsche Bank – Focus & Growth
2 Deutsche Bank Covered Bond strategy
3 Appendix
Deutsche Bank 21
Treasury Strategy on DB Group‘s Covered Bond Platforms June 2018External funding profile
As of 31 March 2018, € bn
Financing Equity,
Secured funding
Vehicles 0%, 6%, € 63bn(1)
and shorts,
€ 2bn
18%, € 176bn(4) — Total funding sources(5) decreased by € 12bn to €
73% from 1,002bn over the quarter
Unsecured Capital most stable
wholesale, funding — The decrease was driven by lower unsecured wholesale
Markets(1,2),
4%, € 38bn 14%, € 138bn sources funding (€ 8bn) and lower contributions from Other
Customers (€ 5bn, primarily lower cash/margin/Prime
Brokerage payables)
Other Retail,
Transaction 32%,
Customers,
Banking, — Funding profile well diversified: 73% of total funding from
5%, €51bn € 319bn(3)
22%, € 216bn most stable sources (versus 72% in prior quarter)
— >50% of external funding from retail and transaction
banking deposits
Total funding sources(5): € 1,002bn
Note: Figures may not sum due to rounding differences
(1) AT1 instruments are included in Capital Markets
(2) Capital markets issuance differs from long-term debt as reported in our Group IFRS accounts primarily due to TLTRO (classified under ‘Secured Funding & Shorts in the above chart),
issuance under our x-markets programme which we do not consider term liquidity and differences between fair value and carrying value of debt instruments as reported in
Consolidation & Adjustments
(3) Includes Wealth Management deposits
(4) Includes € 26bn of TLTRO funding with a residual maturity of up to 2020
(5) Funding sources exclude derivatives and other non-funding liabilities
Deutsche Bank 22
Treasury Strategy on DB Group‘s Covered Bond Platforms June 20182018 funding plan and contractual maturities
€ bn
Funding Plan 2018 Maturity profile
Covered Bonds(1) Senior Structured / Preferred(1) Senior Plain Vanilla(2) Capital instruments(2)
Contractual maturities(3)
25-30
2-3 23 24
21 21
2
12-13 4
10-12 17
4 17
3 3
4
11 5
11
1 4 1
3
15 14 4
12-13
7 8
7 6
1-2 2 1
2018 Plan 2018 YTD(4) 2016 2017 2018e 2019e 2020e 2021e 2022e
— As of 20 April 2018 € 11.4bn raised at 3m Euribor +58bps with an average tenor of 6.5 years
— New issuance spreads 55bp tighter than in Q1 2017 with one year longer average tenor
— $9.7bn exchange launched on 2 May, expiry on 30th May, to exchange Frankfurt/London branch issuance for New York branch issuance
(1) Non-TLAC eligible instruments. Will include plain-vanilla senior preferred issuance post legislative changes
(2) TLAC eligible instruments
(3) Contractual maturities do not reflect unexercised early termination events (e.g. calls, knock-outs, buybacks)
(4) As per 20 April 2018
Deutsche Bank 23
Treasury Strategy on DB Group‘s Covered Bond Platforms June 2018Total Loss Absorbing Capacity (TLAC)
2019 Transitional TLAC requirements(1) and availability as of Q1 2018
€ 124bn
Plain-vanilla
62bn
senior debt(2)
€ 85bn
TLAC
€ 73bn adjust-
G-SIB buffer 0.6bn
2.0% ments(3)
Capital Conservation buffer 2.5%
6.0% 15bn AT1/T2(4) DB has TLAC of 35%
8.0% 20.5% (of of RWA or 9% of
16% TLAC (of € 1,409bn) Leverage Exposure –
requirement € 354bn) 47bn CET1(4)
Tier 2 2.0% € 40bn above 2019
AT1 1.5% leverage-based
CET1 4.5% requirement
RWA-based Leverage-based Estimated
requirement requirement available TLAC
— With German legislation ranking plain-vanilla senior debt below other senior liabilities in case of insolvency since January
2017, DB’s large outstanding portfolio of plain-vanilla senior debt provides significant TLAC capacity
— Minimum requirements for eligible liabilities (MREL) for EU banks are likely to be set within 2Q 2018
Note: Figures may not sum due to rounding differences
(1) Based on final FSB term sheet requirements: higher of 16%/18% RWAs (plus buffers) and 6%/6.75% of leverage exposure from 2019/2022; disclosure aligned to March 2017 Basel Committee
enhanced Pillar 3 disclosure standard; EU rules still to be finalized
(2) IFRS carrying value incl. hedge accounting effects; incl. all senior debt > 1 year (incl. callable bonds, Schuldscheine, other domestic registered issuance); excludes legacy non-EU law bonds
(3) Exclusion of T2 instruments with maturity 1 year; G-SIB TLAC holding deductions
(4) Regulatory capital under fully loaded rules; includes AT1 and T2 capital issued out of subsidiaries to third parties which is eligible until YE 2021 according to the FSB term sheet
Deutsche Bank 24
Treasury Strategy on DB Group‘s Covered Bond Platforms June 2018Current Ratings
Covered Bonds (DB
Pfandbrief/DB SAE Aaa/Aa1 - - -
Cédulas)
Counterparty obligations
ICR(2):
(e.g. Deposits / Structured A3(cr)(1) A-(3) A(high)
Notes / Derivatives / Swaps)
BBB+
Preferred 4) A3 BBB+ A- -
Long-
term
Senior
Non-
unse-
Preferred Baa2 BBB- BBB+ A (low)
cured
Short-term P-2 A-2 F2 R-1(low)
Tier 2 Ba2 BB+ BBB -
Legacy T1 B1 B+ BB -
AT1 B1 B+ BB- -
Note: Ratings as of 4 June 2018, Moody’s non-preferred senior rating is on negative outlook as a result of the industry-wide review of German bail-in legislation / government support. S&P
currently has DB’s ICR on negative outlook
(1) Moody‘s Counterparty Risk Assessments are opinions on the likelihood of default by an issuer on certain senior operating obligations, including payment obligations associated with
derivatives, guarantees and letters of credit. Counterparty Risk assessments are not explicit ratings as they do not take account of the expected severity of loss in the event of default
(2) The Issuer Credit Rating (ICR) is S&P‘s view on an obligor‘s overall creditworthiness. It does not apply to any specific financial obligation, as it does not take into account the nature of
and provisions of the obligation, its standing in bankruptcy or liquidation, statutory preferences, or the legality and enforceability of the obligation. S&P is currently conducting a request
for comment on the implementation of Resolution Counterparty Ratings (RCR)
(3) A- assigned as long-term deposit rating, A-(dcr) for derivatives with third-party counterparties
(4) Defined as senior-senior unsecured bank rating at Moody‘s, senior unsecured at S&P and preferred senior debt at Fitch
Deutsche Bank 25
Treasury Strategy on DB Group‘s Covered Bond Platforms June 2018Group financial summary
€ bn, unless stated otherwise
Q1 2018 vs. Q1 2018 vs.
Q1 2018 Q1 2017 Q4 2017
Q1 2017 Q4 2017
Net revenues 7.0 7.3 (5)% 5.7 22%
Provision for credit losses (0.1) (0.1) (34)% (0.1) (32)%
Noninterest expenses (6.5) (6.3) 2% (7.0) (8)%
Profit & Loss
of which : Adjusted costs (6.3) (6.3) 0% (6.4) (1)%
Income before income taxes 0.4 0.9 (51)% (1.4) n.m.
Net income / loss 0.1 0.6 (79)% (2.4) n.m.
RoTE (1) 0.9% 4.5% (3.6)ppt (17.2)% 18.1 ppt
Metrics
Cost / income ratio 93% 86% 6 ppt 122% (30)ppt
Tangible book value per share (in €) 25.70 32.00 (20)% 25.94 (1)%
Resources (2) CET1 ratio (CRR/CRD4, fully loaded) 13.4% 11.8% 1.6 ppt 14.0% (0.7)ppt
Leverage ratio (fully loaded) 3.7% 3.4% 0.3 ppt 3.8% (0.1)ppt
Note: Figures may not sum due to rounding differences
(1) Post-tax return on average tangible shareholders' equity
(2) Figures as of period end
Deutsche Bank 26
Treasury Strategy on DB Group‘s Covered Bond Platforms June 2018Litigation update
€ bn, unless stated otherwise
Litigation provisions(1) Contingent liabilities(1)
2.0
1.9
2.7 2.5
31 Dec 2017 31 Mar 2018 31 Dec 2017 31 Mar 2018
― Decrease due to settlement payments for major cases as well ― Includes possible obligations where an estimate can be made
as releases for lower than expected settlements partially and outflow is more than remote but less than probable for
offset by additions for other cases significant matters
― Further progress in resolving legacy matters, including: ― Decrease primarily driven by favourable decisions for the
― IBOR-US Civil Litigation: Settlement reached with Bank leading to cancellations of contingent liabilities
OTC plaintiffs
― CMBS Trading Investigation: Settlement reached with
the SEC
― € 0.3bn of the provisions reflect already achieved
settlements or settlements-in-principle
Note: Figures may not sum due to rounding differences and reflect current status of individual matters and are subject to potential further developments
(1) Includes civil litigation and regulatory enforcement matters
Deutsche Bank 27
Treasury Strategy on DB Group‘s Covered Bond Platforms June 2018Net Interest Income sensitivity
Hypothetical +100bps parallel shift impact by business line and major currency, € bn
First year Second year
1.7
1.4
> 3M
> 3M
0.3 0.6
0.9
EUR
0.7 0.7 0.8
≤ 3M
1.1
≤ 3M
1.0
0.2
USD
0.2
> 3M ≤ 3M
> 3M ≤ 3M
0.1 0.1 0.1 0.1
0.1 0.1
0.1 0.1
PCB CIB Group PCB CIB Group
Total
0.8 0.8 1.6 1.0 0.9 1.9
(EUR + USD)
Note: Figures may not sum due to rounding differences; all estimates are based on a static balance sheet, excluding trading positions & Deutsche AM, and at constant exchange rates. The
parallel yield curve shift by +100 basis points assumes an immediate increase of all interest rate tenors and no additional management action. Short term is calculated based on
applying the shock only to tenors up to and including 3 months. The delta NII shown is the difference between projected NII in the scenario with shifted rates vs unchanged rates.
Figures do not include MtM/OCI effects on centrally managed positions not eligible for hedge accounting
Deutsche Bank 28
Treasury Strategy on DB Group‘s Covered Bond Platforms June 2018Market risk at historically low levels
In € m, unless stated otherwise
Average Value-at-Risk (VaR)(1)
122 127
96
86
72
57 54 52
43
32 30 27
2007 2008 2009 2010 2011 2012 2013 2014 2015 2016 2017 Q1 2018
Q1 2018 VaR versus peers(2)
84
76
49 46
33
28 27 25
18 15
(1) VaR converted to 1 day, 99% confidence interval. DB’s VaR numbers are at CB&S level for 2015, at GM level from January 2016, and at CIB level from May 2017 onwards
(2) Group level VaR for GS and CS; Trading VaR for JPM, MS, Citi, BofA and UBS
Deutsche Bank 29
Treasury Strategy on DB Group‘s Covered Bond Platforms June 2018Best-in-class credit risk
Loan loss provisions as a % of gross loans, in bps as of 31 March 2018
109
50
36 32 29
17
9 7 7 3
Net credit loss provisions versus peers, in bps
DB DB average 2007-17
574 US peers US peer average 2017 Peak Avg.
DB 19
13 96 39
4.74x US
68 574 179
peers
96
2007 2008 2009 2010 2011 2012 2013 2014 2015 2016 2017
Deutsche Bank 30
Treasury Strategy on DB Group‘s Covered Bond Platforms June 2018Cautionary statements This presentation contains forward-looking statements. Forward-looking statements are statements that are not historical facts; they include statements about our beliefs and expectations and the assumptions underlying them. These statements are based on plans, estimates and projections as they are currently available to the management of Deutsche Bank. Forward-looking statements therefore speak only as of the date they are made, and we undertake no obligation to update publicly any of them in light of new information or future events. By their very nature, forward-looking statements involve risks and uncertainties. A number of important factors could therefore cause actual results to differ materially from those contained in any forward-looking statement. Such factors include the conditions in the financial markets in Germany, in Europe, in the United States and elsewhere from which we derive a substantial portion of our revenues and in which we hold a substantial portion of our assets, the development of asset prices and market volatility, potential defaults of borrowers or trading counterparties, the implementation of our strategic initiatives, the reliability of our risk management policies, procedures and methods, and other risks referenced in our filings with the U.S. Securities and Exchange Commission. Such factors are described in detail in our SEC Form 20-F of 16 March 2018 under the heading “Risk Factors.” Copies of this document are readily available upon request or can be downloaded from www.db.com/ir. This presentation also contains non-IFRS financial measures. For a reconciliation to directly comparable figures reported under IFRS, to the extent such reconciliation is not provided in this presentation, refer to the Q1 2018 Financial Data Supplement, which is accompanying this presentation and available at www.db.com/ir. Deutsche Bank 31 Treasury Strategy on DB Group‘s Covered Bond Platforms June 2018
You can also read