GLOBAL NETWORK INVESTMENT COMPETITION 2019-2020 - Team: GSB School: Graduate School of Business - University of Cape Town
←
→
Page content transcription
If your browser does not render page correctly, please read the page content below
GLOBAL NETWORK
 INVESTMENT COMPETITION
 2019-2020

Team: GSB

School: Graduate School of Business - University of Cape Town
Overview
Background and Products

Clicks Group Limited is a South African healthcare, beauty, music and lifestyle retail company. With over 20% of the
market share, Clicks is the largest retail pharmacy chain in South Africa. The Company operates through two segments:
Retail and Distribution. Through retail brands, such as Clicks, GNC, The Body Shop, it has over 795 stores across
southern Africa. Clicks Group is a leader in the healthcare market where Clicks has the largest retail pharmacy chain
with over 473 in-store pharmacies. GNC is the specialty health and wellness retailer. GNC offers a range of vitamin,
mineral and herbal supplements, sports nutrition and slimming products. The Body Shop sells natural beauty products.
Claire's is the specialty retailer of fashionable jewellery and accessories for young women and girls. Clicks Group owns
New United Pharmaceutical Distributors (UPD) a leading full-line pharmaceutical wholesaler and supplies retail
pharmacies, private hospitals, dispensing doctors and retail health stores.

Valuation: Our R171 price is based on the average of a DCF valuation and a PE valuation. The PE valuation is based
on the 25.38x 5yr average 12m-fwd PE. The three-stage DCF valuation has a three-year stage one with explicit
forecasts, followed by two-year stage two stable driver forecast, and then a 4.5% terminal growth rate. Our discount
rate is 11.6%. We applied a fade rate of 5% for the valuation (More detail to follow shortly).

Clicks has earned CFROI levels comfortably above its cost of capital for at least the last two decades. As a result of its
solid CFROI and growth performance, investors remain pricing its shares aggressively.

Clicks Group Ltd.’s focus on opening more convenience stores and the resilient nature of its business selling medicines
and beauty treatments helped the South African pharmacy chain take market share and report a 17% rise in annual
earnings. While South African consumers are under pressure and the economy remains weak, Clicks has seen growth
in the health market as more people are prioritizing illness prevention.

The group’s headline earnings per share (HEPS) increased by 16.8% to 672 cents. The total dividend grew by 17.1% to
445 cents per share, with the dividend payout ratio being increased from 62% to 65%. Over the past 10 years the group
has returned R7.4 billion to shareholders and generated a compound annual total shareholder return of 28.6% per annum.
Diluted HEPS has grown by a compound rate of 15.0% per annum and dividend per share by 18.1% per annum, with
the dividend payout ratio increasing from 50% to 65% over the past decade.
Consumer Outlook
“While the consumer spending environment will continue to be constrained in the year ahead, the group has adapted
well to trading in this protracted economic downturn and the group is confident of sustaining volume growth in the
year ahead.” In our view selling price inflation is expected to remain low in the first half of the 2020 financial year
and the group anticipates that the annual increase in the single exit price (SEP) of medicines will be marginally higher
than the current year. From the table below pharmacy sales is still remaining relatively strong compared to other
consumer goods.

 Nominal Retail Sales remain soft across most discretionary categories

Growth Outlook
Capital investment of R718 million is planned for the FY2020, focused on the store and pharmacy network as well as
retail and distribution infrastructure to support the increased scale of the business. The groups investment in retail
systems and infrastructure is a good indication in their interest in capturing consumer data. The group Clicks
ClubCard active membership reached 8.1 million and accounted for 77.6% of the brand’s sales. Clicks’s rewards
program haven’t reduced margins as they are largely funded by the manufacturers and Clicks’s operating margin rose
to 7.4%. This increases insights in consumer behaviour and allows the company to target customers more specifically.
The group plans on spending R620 million in 2022 in capital investment.

Industry Perspectives and Macrotrends
South Africa is experiencing soft consumer data and damaging political disputes. Business confidence remain low for
an extended period. Consumers are under strain from rising taxes, climbing fuel prices, higher utility bills, a
stubbornly high unemployment rate and an economy that hasn’t expanded at more than 2 percent a year since 2013.

Despite ongoing, relatively low inflation rates (4.4% in Q2, 2019) and improving consumer confidence; fixed
expenses like the spiralling price of petrol, taxes, and utilities have placed a massive strain on essential living costs.
Consumers, in their desire to ease their financial strain, are cutting back on their discretionary spending, which in turn
has taken a toll on their grocery baskets, we have not seen this effect in the retail pharmaceutical sector.
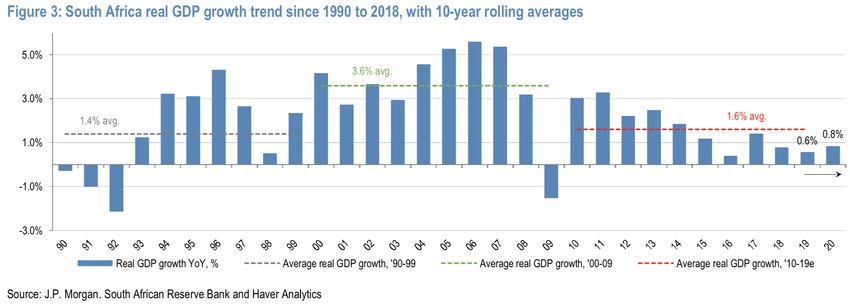
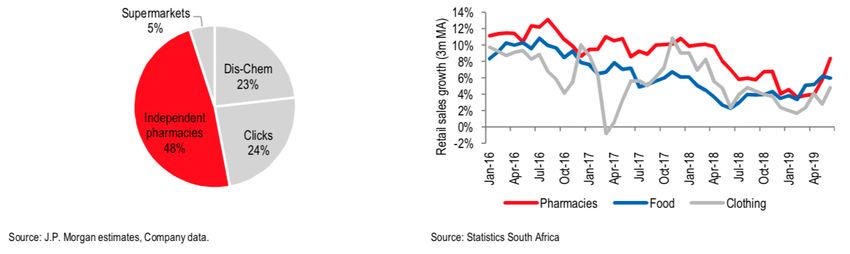
Clicks Group and its competitors operate in the private healthcare sector, which may be subject to a range of risks
from the government's proposed national health insurance legislation. At this stage there is no clear indication of how
this would effect drug pricing at SEP levels. As with most aspects of NHI, there is a high degree of uncertainty with
respect to these questions. Overall, our sense is that it is too early to be overly concerned about NHI’s potential impact
on private pharmacy. However, given these industry risks pharmacy sales have over taken food and clothing, as
indicated in the graph below. Clicks increased its share of the retail pharmacy market from 23.9% to 24.9% at the end
of August 2019. The groups business operates in defensive, resilient and growing health and beauty markets where in
house brands are well positioned to increase market share.

 Corporate pharmacy accounts for c.52% of private dispensary in       Pharmacy retail sales growth has been well-ahead of Food and Clothing retail,
 South Africa by value                                                emphasizing the defensiveness of the segment

South African Economy
According to Bloomberg, economists have lowered South Africa’s growth forecast to a mere 0.8% in 2019, 1.6% in
2020 and 2.0% in 2021. Estimates for average year-over-year growth in 2019 have been cut to 0.8% from 1.1%. Danelee
Masia, Deutsche Bank economist, wrote in a June 6 note. “Weak growth and the risk of tighter global financial
conditions continue to compound the risks around government-debt sustainability. This, together with Rand weakness
amid recent political uncertainty, may temper any rate-cut expectations in the near term.” Spending on pharmaceuticals
and medical goods increased by 1.8% between November 2017 – January 2018 and November 2018 – January 2019.
The central bank indicated that its downbeat outlook for growth this year is premised on weak business and consumer
confidence, growing pressure on household disposable income, and real fixed investment forecast to contract by 0.3%
this year. In a statement released on June 3rd, the International Monetary Fund (IMF) reiterated that South Africa’s
economic growth outlook “will depend critically on the pace of implementation of reforms that address long-standing
structural constraints.” The multilateral organisation warned that if reform implementation “accelerates sufficiently to
lift business confidence and jump-start private investment, growth would be reignited. However, if reforms are delayed,
investment would fail to pick up, economic growth would remain weak in the medium term, and per-capita income
would continue to decline”.
International Risk
There are currently three international factors effecting emerging market equities. (1) the US-China trade war is
impacting equity markets around the world. Additionally this effects FX markets which directly effects the South
African economy and more importantly equity market. The group is exposed to foreign exchange risk through its
imports of merchandise. The currencies in which these transactions are primarily denominated are USD, EUR, GBP
and CNY. The group’s FX risk management policy is to take out forward exchange contracts, to cover both committed
and anticipated exposures. (2) US fixed income markets are currently pricing in low monetary easing. (3) fiscal
support must come in the right mix to support activity, but not spark a sentiment of imprudent macro policies.

Continued USD strength – Johannesburg Stock Exchange equities historically have declined during periods of USD
strength. Emerging market equities declined when the broad USD strengthened at least 5% over the past 20 years was
13% (Graph 1 below). The most defensive emerging market sectors have been Healthcare and Consumer Staples.
Bloomberg reports that in this scenario, investors would have to consider weaker FX > higher inflation expectation >
monetary tightening > lower GDP growth > fiscal tightening. In the short term, investors could remain risk averse and
focused on EM fragilities. Taking this into account we measured the Rand risk against Clicks Group and the JSE All
share index. From graph 2 below, there is some correlation however this is not at exposed as other companies listed on
the JSE.

                   USD/ZAR

                                                                                                           Clicks Group

                                              JSE All Share Index
                                                                                                                          USD/ZAR

                                                                                     JSE All Share Index

Business cycle - The long US business cycle comes to an end, forcing faster-than-expected monetary tightening, and
the dollar follows. Financial overheating risk kicks in as well, as excessive positions unwind. Outflows from EM
bonds and increased capital flight fears from China.

There is a clear decoupling between the real economy and equity markets with plenty of bear data points in the former
which the latter are ignoring. Liquidity infusions and low interest rates are the obvious culprits propping up financial
assets, but where it leaves things from an equity markets perspective if indeed an economic downturn materializes is
very much untested territory. That may still leave room for shorter term relief rallies in Value stocks however
evidence as show below indicates that Growth stocks perform better during these periods.
The group, which competes with Dis-chem Pharmacies DCPJ.J, increased its share in the retail pharmacy market to 24.9% by August-end from 23.9%, "with one in four medicines sold in South Africa being from a Clicks pharmacy," Ramsunder said. United Pharmaceutical Distributors, the group's pharmaceutical distributor, increased total managed turnover by 17.6% to 21.1 billion rand ($1.44 billion), and also expanded its market share. "The business gained four new distribution contracts during the year, expanding its portfolio of bulk distribution clients to 30." Fundamentals Chief executive of the Clicks Group, Vikesh Ramsunder noted that, “51% of the country's population now live within 5 kilometres of a Clicks store, highlighting the convenience of the chain. Our online store extends customer convenience and is currently the fastest growing Clicks store. This has enabled Clicks to enter product categories that we prefer to sell online only.” As described above the focus on online sales in a key trend for the company to move forward and grow revenue. In addition to their increase in Loyalty card holders this information can be used to further promote online sells. Vikesh Ramsunder said that, “The current pressure on consumer disposable income is unlikely to improve in the months ahead. However, our core health and beauty markets and business model are resilient, and we are confident in our ability to trade effectively through these difficult market conditions”. Additionally he added that “Our promotional strategy, centred around the brand’s well-known “3 for 2” offers, together with our great everyday pricing, ensured that we maintained our sales momentum and sustained volume growth despite the increasing pressures on consumer disposable income.” According to Nielsen data analytics, South Africa is home to a nation of promotion obsessed shoppers. 75% of South Africans claimed to know the prices of grocery items they regularly buy and notice changes in price, versus 69% in 2018, and their spending habits confirm that South Africa is the second-most price sensitive country in the world. From the above and the comment by Ramsunder Clicks has managed to sustain growth through these tough economic times. Historical Financials Profitability - Clicks Group has grown constantly over the past 10 years generating a compound annual total shareholder return of 28.6% per annum. Diluted HEPS has grown by a compound rate of 15.0% per annum and the dividend per share by 18.1% per annum over the past decade. The group has sustained promising operating margins, increasing from 6.3% in 2015 to 7.4% in 2019, as operating profit grew by 14.2% to R2.3 billion in 2018. Total income margins and operating profit growth - Total income margin up to 27.6% from 27.0%. Retail margin decreased by 3 basis points to 33.3% in 2019 and distribution margin increase by 9 basis points to 8.2% in 2019. Retail operating profit increased to 11.0% and distribution operating profit increased to 25.4%. Sales momentum - Retail health and beauty same store sales 6.9%. A key driver behind the increase was due to winter flu season in South Africa. Interestingly Dischem, Clicks main competitor SSS-growth softened from 9.1% in FY17 to 3.4% FY19A, this was due to the cannibalization of existing stores on new store rollout in key retail nodes. This is an indication that Clicks group convenience focus is operating more efficiently than Dischems destination store focus.
Dividend - The group increased its total dividend by 17.1% to 445 cents per share, with the dividend payout ratio
being increased from 62% to 65%.

CFROI and Economic Profit - Clicks Group CFROI has been well above their discount rate indicating
management’s ability to generate economic profit from their investments.

Given the groups increase in operating margins and same store sales, the group’s current expansion plan looks
promising. In order to increase CFROI the group will be required to grow their assets whilst increasing economic
profit. The group currently has no long term debt and is investing in asset grow using cash. Looking the current
economic climate and the lack of investor confidence in South Africa their grow strategy is indeed promising. A key
metric in analysing a company’s growth strategy is looking at long term executive incentives.

Clicks Group has two incentive schemes. Their short-term incentive scheme is RONA-based whilst important for
month to month targets, their long-term incentive scheme is more important for organizational growth. The groups
long-term incentive scheme is based on three-year CAGR in diluted HEPS ( target of 8% to 14.9% growth) and a
based on a three-year CAGR in total shareholder return (target above 15%).

CLICKS GROUP LIMITED (CLS)
Drug Retail                                                                                                                           Price: 244.00 (01-Nov-2019)
Market Cap: 61.6 ZAR                                                                                                            Warranted Price: 100.97 ZAR (-59%)

                                 Leverage                                                                             Interest Coverage

                       Fixed Charge Coverage Details                                                      Fixed Charge Coverage with Spread

As indicated from the graphs above Clicks has maintained an outstanding operational performance. The group is a
high    cash business, this indicates the group’s ability to grow assets and continuously pay increasing dividends.
Source: Credit Suisse HOLT Lens on November 5, 2019    THIS REPORT IS MARKET COMMENTARY AND NOT A RESEARCH DOCUMENT                                              11
Historical Performance
Income Statement (ZAR) 2013 2014 2015 2016 2017 2018 2019
Turnover 17 543 19 150 22 070 24 171 26 809 29 239 31 352
Growth % 9% 15% 10% 11% 9% 7%
COGS (13 761) (15 026) (17 545) (19 157) (21 185) (23 071) (24 662)
Gross Profit 3 783 4 123 4 525 5 014 5 624 6 168 6 690
SG&A (2 290) (2 598) (2 874) (3 234) (3 641) (4 023) (4 150)
EBIT 1 493 1 525 1 651 1 780 1 983 2 145 2 540
Finance Costs (52) (46) (62) (59) (48) (24) (24)
Investment Income 6 5 5 6 11 26 63
Associate Income 0,00 0,00 0,00 0,00 0,00 0,00 0,00
EBT 1 446 1 485 1 593 1 727 1 946 2 147 2 580
Taxes (299) (342) (375) (421) (497) (567) (661)
Net Profit (continuing) 1 147 1 143 1 219 1 307 1 449 1 580 1 919
Abnormal/Discontinued 0 0 0 0 0 0 0
Net Profit 1 147 1 143 1 219 1 307 1 449 1 580 1 919
Minority Interests 0,40 0,23 0,00 0,00 0,00 0,00 (0,16)
Dividend (394) (429) (491) (586) (677) (812) (981)
Retained Income 754 714 728 721 772 768 938
Payout 34% 38% 40% 45% 47% 51% 51%
Indicators
Turnover Growth % 9,2% 15,3% 9,5% 10,9% 9,1% 7,2%
Gross Profit % 21,6% 21,5% 20,5% 20,7% 21,0% 21,1% 21,3%
SG&A% 13,1% 13,6% 13,0% 13,4% 13,6% 13,8% 13,2%
EBIT % 8,5% 8,0% 7,5% 7,4% 7,4% 7,3% 8,1%
Interest rate % -6,0% -2,8% -1,2% -1,7% -1,5% -1,7% -2,4%
Associate ROC 0,0% 0,0% 0,0% 0,0% 0,0% 0,0% 0,0%
Tax rate% 20,7% 23,0% 23,5% 24,4% 25,5% 26,4% 25,6%
PP&E / Sales 6,0% 5,9% 5,5% 5,6% 5,7% 6,3% 6,6%
Inventory / Sales 12,7% 13,7% 14,7% 14,4% 14,0% 14,5% 15,0%
Receivables / Sales 8,6% 8,4% 8,5% 8,3% 8,3% 8,0% 8,4%
Payables / Sales -18,6% -21,1% -22,2% -21,3% -20,4% -21,3% -23,3%
Invested Capital 2013 2014 2015 2016 2017 2018 2019
Non-current assets 1 530 1 633 1 819 2 150 2 278 2 740 2 894
PP&E 1 059 1 135 1 222 1 345 1 534 1 843 2 067
Goodwill 104 104 104 104 104 104 103
Intangible assets 349 372 396 434 458 477 497
Investments 19 23 98 268 183 317 227
Operating Current assets 3 733 4 222 5 122 5 491 5 967 6 582 7 357
Inventory 2 225 2 614 3 250 3 479 3 754 4 251 4 710
Receivables 1 508 1 608 1 872 2 013 2 213 2 332 2 647
Operating Current liabilities (3 816) (4 339) (5 235) (5 517) (6 019) (6 717) (7 750)
Payables (3 256) (4 041) (4 898) (5 148) (5 475) (6 227) (7 303)
Other (560) (298) (337) (368) (543) (490) (446)
Total Invested Capital 1 448 1 516 1 706 2 125 2 226 2 605 2 501
Operating Invested Capital 1 325 1 390 1 504 1 754 1 940 2 185 2 171
Capital Employed
Equity 1377 1567 2013 2452 3300 4424 4913
Minority interests 0 0 0 0 0 0 0
Cash and net disposals 92 196 401 370 700 1524 2614
Debt 0 0 0 0 0 0 0
Net deferred taxes 59 126 177 347 572 479 47
Other liabilities 243 284 309 406 402 448 392
Calculated Capital Employed 1 771 2 173 2 899 3 575 4 975 6 874 7 965
Debt (Excess Cash) (323) (657) (1 193) (1 450) (2 750) (4 269) (5 464)
Valuation
NOPAT 1 075 1 098 1 189 1 282 1 428 1 544 1 829
Invested Capital 1 325 1 390 1 504 1 754 1 940 2 185 2 171
ROIC% 82,9% 85,5% 85,2% 81,4% 79,6% 83,7%Performance Outlook Income Statement (ZAR)
Forecast (H) Forecast (H) Forecast (H) Forecast (L) Forecast (L) Terminal
2020 2021 2022 2023 2024 2025
Turnover 34 801 38 629 42 878 47 595 52 830 58 641
Growth % 11% 11% 11% 9% 9% 9%
COGS (27 145) (30 131) (33 445) (37 124) (41 207) (45 740)
Gross Profit 7 656 8 498 9 433 10 471 11 623 12 901
SG&A (4 524) (5 022) (5 574) (6 187) (6 868) (7 623)
EBIT 3 132 3 477 3 859 4 284 4 755 5 278
Taxes (833) (930) (1 037) (1 155) (1 287) (1 434)
Net Profit (continuing) 2 142 2 390 2 666 2 971 3 310 3 687
FCF Valuation
FCF Dividend (1 071) (1 195) (1 333) (1 486) (1 655) (1 843)
PV of FCF 15 264 Retained Income 1 071 1 195 1 333 1 486 1 655 1 843
Terminal Value 24 266 Payout
Operating Firm Value 39 530 Invested Capital 2020 2021 2022 2023 2024 2025
EP Valuation Total Invested Capital 3 170 3 483 3 830 4 215 4 642 5 116
EP Operating Invested Capital 2 840 3 153 3 499 3 884 4 312 4 786
PV of EP 15 119
Invested Capital 2 171 Capital Employed
Terminal Value (no fade) 22 256 Equity 5984 7179 8512 9997 11652 13496
Operating Firm Value (no fade) 39 546 Minority interests 0 0 0 0 0 0
Cash and net disposals 2614 2614 2614 2614 2614 2614
PV of EP (fade) 11 140 Debt 0 0 0 0 0 0
Invested Capital 2 171 Net deferred taxes 47 47 47 47 47 47
Other liabilities 435 483 536 595 660 733
Terminal Value (fade) 25 524
Operating Firm Value (fade) 38 836
Calculated Capital Employed 9 080 10 322 11 708 13 253 14 973 16 889
Debt (Excess Cash) (5 909) (6 840) (7 879) (9 038) (10 331) (11 773)
Other Info & Warranted Share Price
MV of Investments 341 Valuation
Minority Interests - NOPAT 2 255 2 503 2 779 3 084 3 423 3 800
Net Debt & LT Liabilities (3 005) Invested Capital 2 840 3 153 3 499 3 884 4 312 4 786
Shares Outstanding 251 ROIC% 84,1% 88,1% 88,1% 88,1% 88,1% 88,1%
FCF Warranted Price 147 FCF Valuation
EP Warranted Price 147 FCF 1 586 2 191 2 432 2 699 2 996 3 326
Fading EP Warranted Price 144 PV of FCF 1 287 1 602 1 602 1 602 1 602 1 602
12m-FWD PE
25.38x 5yr avg 12m-fwd PE 198 EP Valuation
EP 2 016 2 191 2 432 2 699 2 996 3 326
Final Price R 171 PV of EP 1 636 1 602 1 602 1 602 1 602 1 602
Based on economic forecast, the valuation has been based with the following assumptions:
Terminal Growth Rate: To determine Clicks terminal growth rate, we took into account the average real and
nominal GDP, additionally we included inflation to draw our final conclusion. South Africa’s average GDP grew by
1.65% over the past 10 years. South Africa has had one of the worst growth quarters of a decline of 3.2%. Economists
have now adjusted their outlook prospects for South Africa to 0.8% in 2019, 1.6% in 2020 and 2.0% in 2021. South
Africa’s average inflation is was 5.73% over the past 10 years and is predicted to be 4.5% in 2019 and increase to 5%
in 2020. South Africa’s average nominal GDP growth from March 1961 to March 2018 was 12.15%. We therefore
argue that Clicks terminal growth rate would be between real GDP growth of 2% and nominal average GDP growth
rate of 12.15%. Clicks average growth rate since 2010 is 10.25%. Clicks Terminal growth rate is calculated to 4.5%.
Cost of Capital (WACC): Our 11.6% WACC is based on a 100% equity capital structure and a 11.4% cost of equity
(8.9% risk-free rate - R206 bond, 8,6%. Market Return - JSE All Share Index, 0.81 Levered Beta).
Valuation
Our R171 is based on the average of a DCF valuation and a PE valuation. The PE valuation is based on the 25.38x 5yr
avg 12m-fwd PE. The three-stage DCF valuation has a three-year stage one with explicit forecasts, followed by two-
year stage two stable driver forecast, and then a 4.5% terminal growth rate. Our discount rate is 11.6%. We applied a
fade rate of 5% for the valuation.
Although our valuation is below the current share price we are still positive in the group’s performance. The stock is
predominantly a defensive equity and is trading at a 18% premium to EM Food & Drug Retailers. Given the current
economic climate we are still positive Clicks Group will perform respectively in the future.Fade Clicks Group is currently trading at
171 0% 5% 10% 15% 20% a fade rate of 0% implying it has a
9% 209 164 150 143 139 increasing competitive advantage.
WACC 10% 186 156 145 139 136 However, if we see competition
12% 160 143 136 133 130
rise the share price could fall below
the current range.
Cost Of Goods Sold
171 76% 77% 78% 79% 80% Clicks group will need to retain
10% 185 176 168 159 150 their current operating margins to
Sales Growth 12% 194 184 175 165 155 continue trading at this premium
16% 214 203 191 179 167 price.
Fade driver is used to test a company valuation’s
Fade sensitivity to changes in the rate of decay in profitability during the
terminal period. Fade
171 can be related
0% to expected
5% competitive
10% advantage20%
15% period (CAP). The magnitude of competitive
advantage indicated by the percentage
10% 168 points
147 of excess
138 profitability,
134 or131
the spread between a company’s return on
Sales Growth
capital and its cost12%
of capital.175 151
The sustainability of142 137advantage
competitive 134 which is the number of years the
16% and excess
competitive advantage 191 profitability
162 can151 145
be maintained. 141
Peer Analysis
Drug Retail
Market Cap: 61.6 ZAR
Price: 244.00 (01-Nov-2019)
Warranted Price: 118.42 ZAR (-51%)
Asset Growth (LFY %)
Economic Profit as a % of Gross Investment
Compared to JSE listed companies clicks is operating very efficiently. The above graphs indicate that the group has
been able to grow their assets whilst generating the best economic returns in sector. This is a good indication that20 the
group has a formalized strategy to increase theirTHISmarket share.
REPORT IS MARKET COMMENTARY AND NOT A RESEARCH DOCUMENT
CFROI % (Economic Returns )Price Momentum (13 week)
16
THIS REPORT IS MARKET COMMENTARY AND NOT A RESEARCH DOCUMENT
Although the groups price momentum suggests that their share price is over-priced. The current economic climate in
South Africa indicates investors are looking for companies that are able to sustain earnings growth.
Clicks Group Limited Share price
As at 5 November 2019the share is trading at - R24,8
Final Conclusion
Our valuation indicates that Clicks Group is over valued at the current price. However, given the current economic
climate in South Africa we believe the stock will still outperform the JSE All Share Index. Additionally, Clicks Group
has maintained a CFROI well above the rest of equities listed on the JSE and has been able to increase economic
profit through stable gross investment. This is indicates that management is able to execute on their strategy. The
Group has also maintained a fade rate between 2% and 5% for the past 8 years, given the increased competition and
customer sensitivity to retail prices, the group has maintained a steady operating margin and same store sales.
Although Clicks will need to retain these metrics to continue to be priced as a growth equity, we believe the group is
position to perform in both contracting and expanding economic events.
Appendix:
Economic Profit (EP) is the amount of value a firm creates over a specified period, typically annual. It is
proportional to the spread between a company’s return on capital and cost of capital.
CFROI is an inflation-adjusted return on capital measure that estimates a firm’s weighted-average internal
rate of return (IRR) on its operating assets.
TSR is defined as “the overall return to shareholders which is equal to the 20-day volume weighted average
price (VWAP) appreciation of a Clicks Group Limited share plus dividend payments reinvested over the
three-year performance period divided by the VWAP of a Clicks Group Limited share at the commencement
of the three-year performance period, expressed as a percentage”You can also read