Coca-Cola Bottlers Japan Holdings Inc - Third quarter year-to-date 2020 Earnings Presentation - Coca-Cola Bottlers Japan Holdings.

Page created by Janet Conner
 
CONTINUE READING
Coca-Cola Bottlers Japan Holdings Inc - Third quarter year-to-date 2020 Earnings Presentation - Coca-Cola Bottlers Japan Holdings.
Third quarter year-to-date 2020
                                                     Earnings Presentation
                                                     November 13, 2020

                Coca-Cola Bottlers Japan Holdings Inc.

Calin Dragan, President
Bjorn Ulgenes, Vice President & Chief Financial Officer
(Posted to CCBJH website on November 12, 2020)
Coca-Cola Bottlers Japan Holdings Inc - Third quarter year-to-date 2020 Earnings Presentation - Coca-Cola Bottlers Japan Holdings.
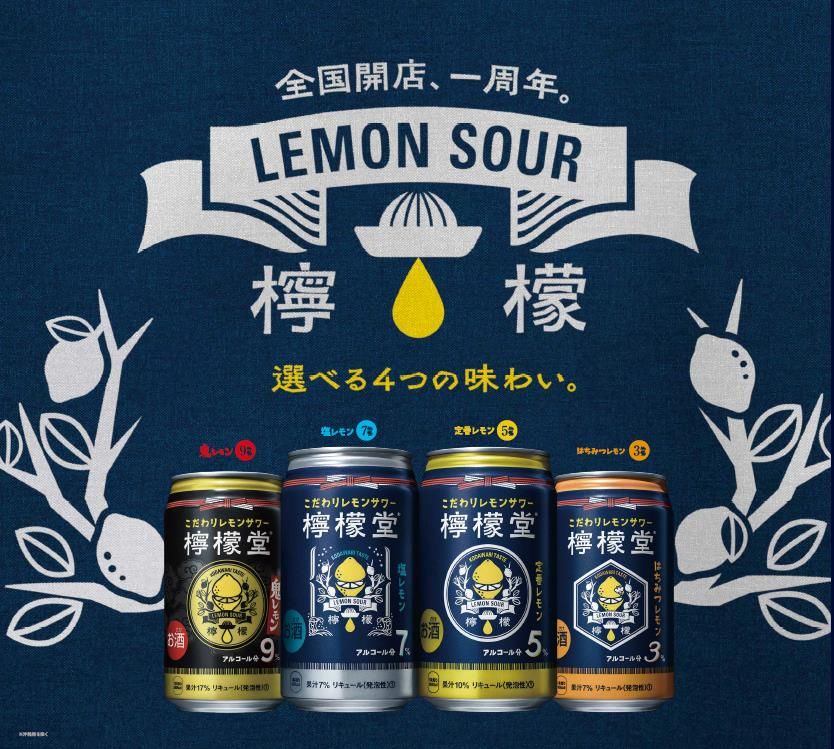
Forward-looking statements
 The plans, performance forecasts, and strategies appearing in this material are based on the assumptions and judgment of the management
 of Coca-Cola Bottlers Japan Holdings Inc. (CCBJH or Company) in view of data obtained as of the date this material was released. These
 forecasts may differ materially from actual performance due to risks and uncertain factors such as those listed below.
 Risks and uncertain factors are not limited to the items listed below. They are also included in our annual securities report, or “Yuka Shoken
 Houkokusho”.
 • Agreements with The Coca-Cola Company and Coca-Cola (Japan) Company Limited.
 • The quality and safety of products
 • Market competition
 • Natural environment, such as climate, disaster, water resources, etc.
 • Legal environment
 • Leakage or loss of information
 • Change of economic conditions, such as personal consumption, currency exchange rates, prices of raw materials, fair value of assets, etc.
 • Business integration, streamlining and optimization of business processes, etc.
 • Uncertain factors other than those above
 The information in this presentation is provided for informational purposes and should not be construed as a solicitation of an investment in
 our securities.
 CCBJH undertakes no duty to update any statement in light of new information or future events. You should rely on your own independent
 examination of us before investing in any securities issued by our company.

                                                                                                                                              2
Coca-Cola Bottlers Japan Holdings Inc - Third quarter year-to-date 2020 Earnings Presentation - Coca-Cola Bottlers Japan Holdings.
Coca-Cola Bottlers Japan Holdings Inc. (CCBJH)
Third quarter (Q3) year-to-date 2020 earnings presentation

    Overview and situational analysis

    Q3 YTD results and outlook

    Q&A

                                                             3
Coca-Cola Bottlers Japan Holdings Inc - Third quarter year-to-date 2020 Earnings Presentation - Coca-Cola Bottlers Japan Holdings.
Overview and
Situational Analysis
Coca-Cola Bottlers Japan Holdings Inc - Third quarter year-to-date 2020 Earnings Presentation - Coca-Cola Bottlers Japan Holdings.
Q3 Year-to-Date Overview
 YTD beverage market continues negative, moderating trend versus Q2 as restrictions lifted
 CCBJH Q3 volume, revenue and Business Income show gradual recovery versus prior
 quarters this year. Q3 Business Income almost even versus prior year.
 Continued growth in vending market share. Focus on recovering OTC market share with
 selective marketing reinvestment in Q4.
 Significant cost savings, faster transformation efforts, including early completion of vending
 and sales route transformation.
 Alcohol business continues to perform well. Expect to sell 8 million cases in 2020; New
 alcohol manufacturing line installed in Kyoto to meet growing demand.
 Announced updated full-year 2020 outlook on October 5, targeting even Business Income in
 spite of topline pressure. No change to 25 yen-per-share year-end dividend forecast.
 Continue to drive fundamental business transformation guided by our mid-term strategic
 plan amid the current COVID-19 driven challenges.

                                                                                                  5
Coca-Cola Bottlers Japan Holdings Inc - Third quarter year-to-date 2020 Earnings Presentation - Coca-Cola Bottlers Japan Holdings.
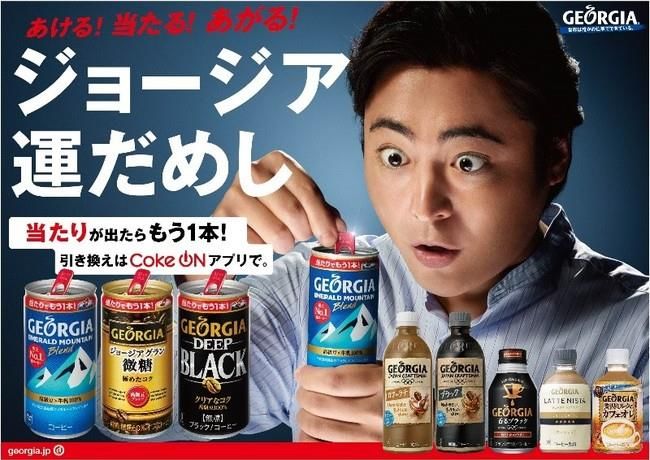
Market Environment Update; “with COVID-19”
Initial traffic recovery with Japan “GO-TO” campaign; Selective investment to recover share
                    Industry situation YTD                  Guiding principles for                                                  Our quick actions
                    Uncertainty during “with COVID-19”       market execution                                                    Setting a foundation for 2021
                                                           • Extra focus on

                                                                                     Customer centric plans & support programs
                    - Foot traffic still low in indoor                                                                            Mitigation initiatives

                                                                                                                                                             Cost savings & optimized capital allocation
                      locations, such as train stations,     strategic priorities                                                 delivering strong cost
       Vending        schools, leisure venues & offices.                                                                                 savings
                                                            ✓ Strengthen the core
                    - “Low-touch” consumer
                      interactions increasing               ✓ Grow at-home
                                                                                                                                  People, processes and
                                                              consumption                                                          systems to address
                    - Some traffic recovery, primarily      ✓ Deliver value to                                                     high fixed-cost base
         OTC          larger package transactions in          consumers
        (Over the     SM & DD channels                                                                                                 Accelerating
         counter)   - Continued traffic declines in        • Leverage new                                                            transformation,
       channels       urban locations, CVS channel           consumer demand                                                        enhancing supply
                    - Affordability and value focus          trends                                                                capacity & network
                                                                                                                                    Revised marketing
                                                           • Review portfolio and                                                     initiatives and
                    Strong sales growth since COVID
        Online      outbreak; Increase in demand for         promotional                                                          investment to recover
                    case sales and home delivery.            initiatives                                                               market share

                                                                                                                                                                                                           6
Coca-Cola Bottlers Japan Holdings Inc - Third quarter year-to-date 2020 Earnings Presentation - Coca-Cola Bottlers Japan Holdings.
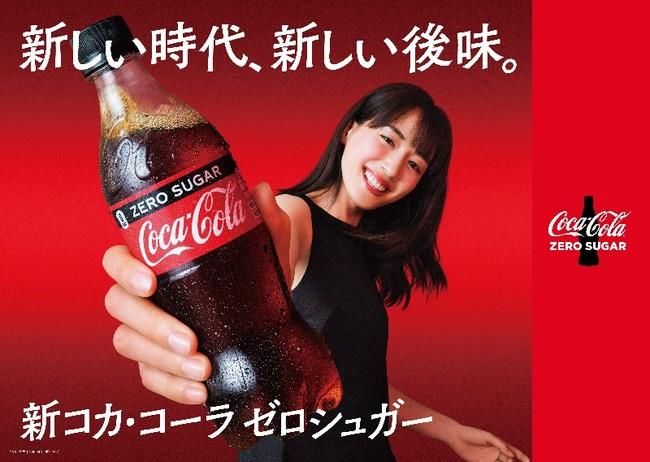
Strict focus on managing what we can control;
       Building a foundation for recovery
✓ Beverage market contraction, stabilizing for now at lower levels.
✓ Mitigating short-term revenue contraction with significant cost and
  capital reduction. Making good progress to reduce heavy fixed cost base.
✓ Transformation of vending channel operations complete; 18 months’
  consecutive vending market share growth and reduced cost to serve.
✓ Flexible, high-spec manufacturing capacity in place to supply evolving
  consumer demand.
✓ Selective marketing reinvestment in Q4 to recover growth into 2021.

                                                                             7
Coca-Cola Bottlers Japan Holdings Inc - Third quarter year-to-date 2020 Earnings Presentation - Coca-Cola Bottlers Japan Holdings.
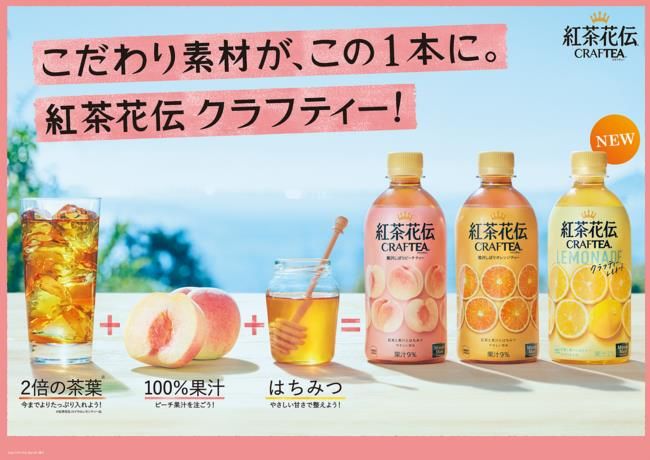
Vending transformation is yielding results
Share momentum, better volume-per-machine, transforming to lower cost base
        Vending value share growing                                       Vending volume-per-machine
 33

 32
              +1.3%                              +1.2%                          recovering vs. PY                           20%              10%
                                               (2020YTD)                                                                  Vending service   Vending fixed
             (FY2019)
 31                                                                                                                       route reduction   cost savings*
                                                                            Indoor
 30
                                                                            Outdoor
                                                                                                                             Strong foundation for
 29                                                                                                                            profitable growth
      2019Q1 2019Q2 2019Q3 2019Q4 2020Q1 2020Q2 2020Q3              Jan   Feb   Mar   Apr   May   Jun   Jul   Aug   Sep
                                               Source: Intage SCI                                                                               *annualized

      Vending value share growth 18 months in a row. Momentum continues in October, supported by coffee
      and tea share growth and Coke ON smartphone app campaign
      Volume-per-machine recovering. Positive versus prior year in October in outdoor locations
      Coke ON welcome-back campaign in October attracted 1 million new consumers, driving traffic growth
      Accelerated vending transformation; 20% vending service route reduction, 10% annualized cost savings
      to address high legacy fixed cost structure and drive future profit growth as traffic recovers

                                                                                                                                                              8
Coca-Cola Bottlers Japan Holdings Inc - Third quarter year-to-date 2020 Earnings Presentation - Coca-Cola Bottlers Japan Holdings.
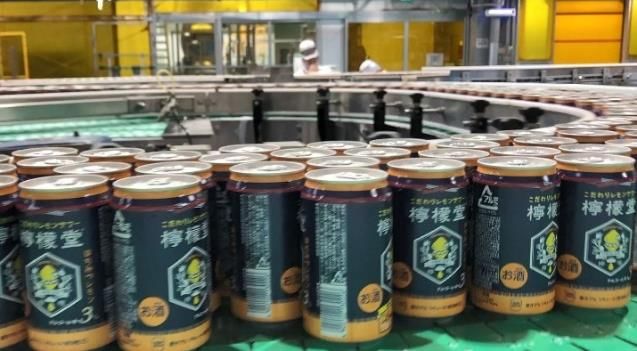
Market share pressure in OTC channels on pullback in investment
Value share growth in coffee, cola, black tea; Strong progress in Online channel
  Continuous wholesale pricing and promotional discipline
  Market share impacted by postponed Olympics programs,                        OTC NARTD Market Share
  especially in CVS channel                                        Market Share (vs. PY, PP)             Value           Volume

  Volume recovery in supermarket, drug & discounter                YTD Q3 (Jan. to Sep.)                  -0.5            -0.5

  supported by selective investment in marketing activities        Q3 (Jul. to Sep.)                      -1.1            -0.6

  Coca-Cola & Coca-Cola Zero 350/700ml packages
  contributing volume and sales growth in target outlets                         NARTD OTC Retail Price
                                                                   OTC Retail Price                      Vs. Market
  950ml PET offering in the convenience store channel              (Jan. to Sep. 2020, JPY per bottle)    Average
                                                                                                                          Vs. PY

  driving share growth in sports category                          Small PET                                      +2.5       -1.2
                                                                   Large PET (2L PET)                            +21.0       -2.8
Online Channel
                                                              NARTD: Non-alcoholic ready-to-drink OTC: Over-the-counter channels
  Achieved #1 market share in major online retail site                                                           Source: Intage

  Launch of sustainable, label-free SKUs to drive traffic

                                                                                                                                    9
Coca-Cola Bottlers Japan Holdings Inc - Third quarter year-to-date 2020 Earnings Presentation - Coca-Cola Bottlers Japan Holdings.
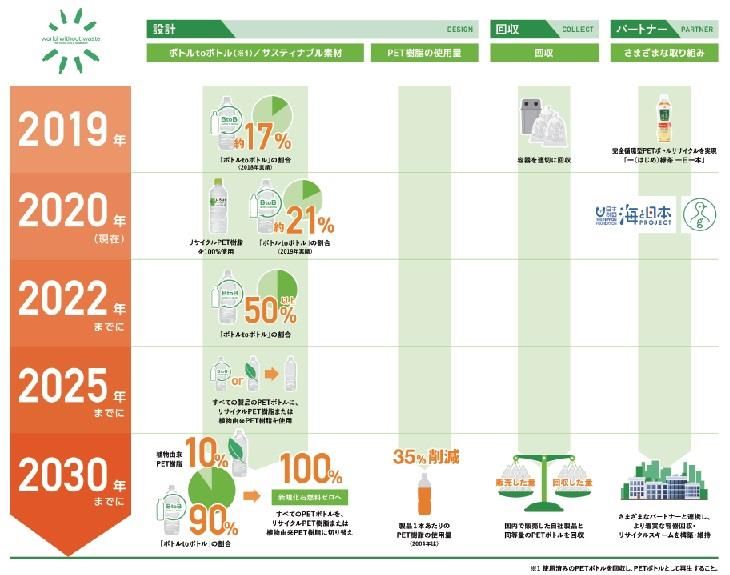
Successfully expanding to new consumption occasions
Alcohol business contributing revenue and profit
                                                      Million              Lemon-dou cumulative sales volume
                                                      Cases
     Lemon-dou pilot started in May 2018 as             8
     first Coca-Cola Company alcohol brand              7

     Nationwide launch in October 2019,                 6                Launch to date
     consistently outperforming initial plan            5                7.9 million
                                                                             cases
     Added in-house manufacturing capacity              4

     to meet growing demand; Saitama in                 3

     2019 and Kyoto in 2020                             2

                                                        1
     Teiban Lemon SKU #1 value share in
                                                        0
     lemon sour category. Premium retail                        2018Q2 2018Q3 2018Q4 2019Q1 2019Q2 2019Q3 2019Q4 2020Q1 2020Q2 2020Q3
     pricing versus competition                                                Pilot in Kyushu                  Nationwide launch

     Good model market for global Coca-Cola
     Company initiatives
 Market share source: Intage SRI, Jan. to Sep. 2020
 Each case contains 24 x 350ml can

                                                                                                                                        10
Resilient and flexible infrastructure in place
Building a foundation for recovery
  Completion of world-leading Hiroshima plant – Fully up and running. Total seven new
  manufacturing lines nationwide, 20% growth in aseptic production capacity versus 2018.
  Continuing to add manufacturing capacity of growing alcohol business. Started
  production at the Kyoto plant in October, with additional capacity planned in 2021.
  Shinsei logistics/distribution network optimization project
   •    14 sales/distribution centers closed in 2020, six sales regions reduced to three
   •    Saitama (Eastern Japan) Mega DC construction on track; completion in February 2021
   •    Akashi (Western Japan) Mega DC construction started

           Hiroshima virtual plant opening     Lemon-dou production in Kyoto   Akashi Mega DC new warehouse
       celebrated with The Coca-Cola Company

                                                                                                              11
Sustainability as one driver of growth
Making progress in sustainable packaging toward WWW goals
                                                       Helps support achievement of
    Expand “label-free” products offerings                  World Without Waste
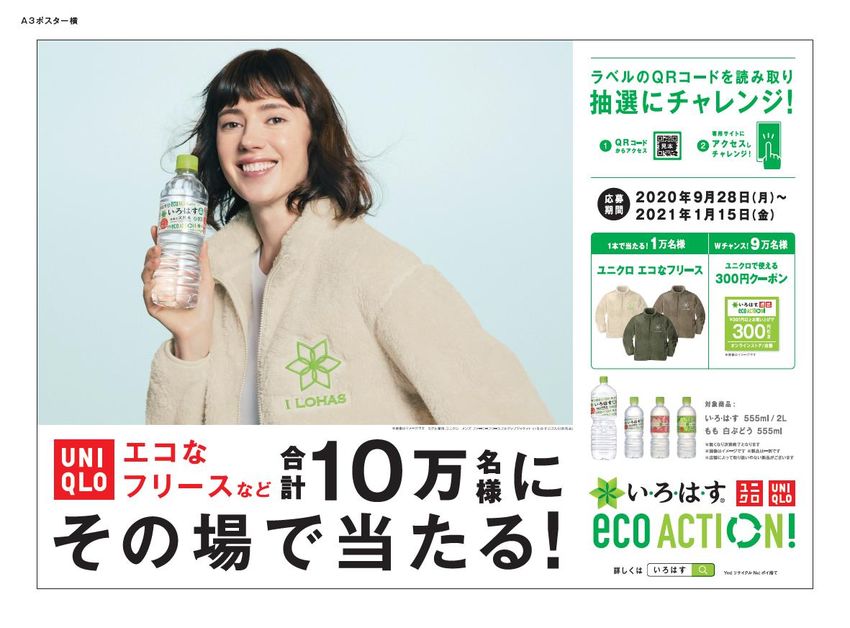
    “iLOHAS eco ACTION” campaign with Uniqlo
    Launching pilot project for PET bottle recycling
    with Welcia Holdings in Tochigi
    Agreement with municipalities such as
    Higashiyamato City on PET bottle collection
    Pilot sales of product started in November using
    chemically recycled PET raw materials
    developed together with Far Eastern New
    Century (FENC) Company

                                                                                      12
“Business as usual is
         not an option”
• Actively Reducing fixed cost and increasing flexibility across the business
• Crisis is a driver to accelerate transformation
• COVID-19 outlook uncertain, but clear focus on returning to growth

                                                                                13
1957
     1958

             in Japan
            1957: Coke
            established
     1959

 *
     1960
     1961
     1962
     1963
     1964
     1965
     1966
     1967
     1968
     1969
                                      Emerging stronger:

                            Nixon

     1970
                          standard
                          ends gold

     1971
     1972
     1973
     1974
                           1st Oil
                           Shock

     1975
     1976
     1977
     1978
     1979
     1980
                           Shock
                           2nd Oil

     1981
     1982
     1983
     1984
     1985
     1986
     1987
     1988
     1989
     1990
     1991
     1992
                            Burst

     1993
                           Bubble

     1994
     1995
     1996
     1997
     1998
     1999
     2000
     2001
     2002
     2003
     2004
     2005
     2006
     2007
                            crisis
                           Global

     2008
                          financial

     2009
     2010
     2011
     2012
                           3.11

                          quake
                          earth-

     2013
     2014
     2015
     2016
     2017
     2018
     2019
                                      In the past 60 years, Coca-Cola business in Japan has withstood many crises
                            West
                            Japan
                          flooding

14
Q3 YTD 2020 results
Q3 YTD 2020 results vs. 2019
Moderating Business Income decline, partially offset by significant cost savings.
Operating income improved versus prior year, cycling one-time expenses.
                                                                                           2020                                2019                     YoY (%)
 Revenue                                                                                            616,774                           694,763                     -11.2
  Beverage Business Sales Volume (Million Cases)                                                             344                          384                       -11
             NARTD (Non-alcoholic ready to drink) Beverage Volume                                            338                          384                       -12
   COGS                                                                                             326,746                           357,499                      -8.6
 Gross Profit                                                                                       290,027                           337,265                     -14.0
   SG&A                                                                                             281,883                           318,810                     -11.6
 Business Income                                                                                       6,958                            17,103                    -59.3
 Operating Income (Loss)                                                                             (6,334)                          (51,880)                        -
 Net income (loss) attributable to owners of parent                                                  (4,644)                          (55,693)                        -

                                                                                               Health Care & Skin
 Beverage Business                    2020              2019              YoY (%)                                                 2020           2019        YoY (%)
                                                                                               Care Business
 Revenue                              598,547           676,015                -11.5           Revenue                                18,227     18,748            -2.8
 Business Income (Loss)                  4,336            14,613               -70.3           Business Income                         2,622      2,489            +5.3
Unit: Million JPY

                                               Some inconsistencies with the volume data provided in past presentations may                                               16
                                               be expected as a result of standardization of volume and revenue calculation.
Q3 YTD 2020 Drivers of Business Income
Moderating trend vs Q2. Strong progress in cost-savings to partially offset topline pressure
                                   Volume, Price                   DME                    Commodity            Manufacturing                  Others              Healthcare &
                                      & Mix*                  (Direct Marketing                                                                                      Skincare
                                         -34.9               Expense, fixed only)                                                                                Business Income
              17.1
                                         (YTD)
                                       Q3 -14.5
                                                                                                                                                                      +0.1
                                                                                                                                                                                            7.0
                                       Q2 -18.5

          Q3 YTD 2019                                        • Reduced
                                                                                                             • Cost reduction
                                                                                                                                               +20.9                                 Q3 YTD 2020
                                                                                                               thorough efficiency
           Business                                            marketing spend
                                                                                                               improvement offset                                                     Business
                                                               during peak
            Income                                             COVID-19 impact
                                                                                                               by lower production                                                     Income
                                                                                                               volume, higher
                                                             • Replan of                      +0.9             depreciation, etc.
                                                               marketing
                                                                                                                                                                                   Q3 standalone BI
                                                                                                                    -3.1
                                                                    +5.9
                                                                                                                                                                                    12.5 billion yen,
                                                                                                                                           • Reflects cost
                                        Q1 -1.9                                                                                              savings in labor,                     almost even with
                                                                                                                                             IT, T&E, etc. and
                • Vending volume -14%, CVS -12%,                                                                                             lower logistics/                        prior-year Q3
                  R&F -30%                             Beverage volume YoY (%)                                                               distribution
                • Lower variable expense (vending
                  commission, deductions from           Q1       Q2      Q3       YTD
                  revenue, etc.)                        -2       -18     -10      -11
                • Alcohol contribution                                                                                                                                                Unit: B JPY
                                                                                                                                                                                      (Rounding off less than unit)
*Volume, Price & mix represent marginal profit of our commercial activities including variable costs and deduction from revenue in IFRS.

                                                                                        NARTD: Non-alcoholic ready-to-drink                                                                                           17
2020 Q3 YTD NARTD channel & category volume performance
 Growth in Drug & Discounter, Online channels; Package mix impacting revenue per case
By channel                                                                       Wholesale                        By category
                                                Vs. PY                    Volume revenue
                                                                                                                                                              Vs. PY              Volume
              1%                                                                 per case
                                                                                                                                 7%                   Sparkling                        -12%
                                       Supermarket (SM)                        -1%         -38 Yen                         6%
         18%                                                                                                                                    26%   Non-sugar tea (NST)              -10%
                      26%              Drug & Discounter (D&D)                +7%          -33 Yen
                                                                                                                     21%                              Sports                           -11%
                                       Convenience Store (CVS)               -12%          -13 Yen
      24%                                                                                                                                   21%       Water                             -6%
                         16%
                                       Vending (VM)                          -14%          -50 Yen                        9%                          Coffee                            -8%
               15%                     Retail & Food (R&F)                                                                        10%
                                        Includes Online
                                                                             -30%         +54 Yen                                                     Juice                            -25%

 SM Adapting to consumers’ behavior change; Sparkling & water growth offset by                                  Sparkling driven by decline in R&F and VM, partly offset by Coca-Cola Zero
 decline in sports & NST.                                                                                       renewal launch of Fanta Premier
 D&D grew across most categories except sports, led by increased shopper traffic,                               NST decline driven by R&F and VM. Slight decline in green tea partially
 demand for home consumption                                                                                    offset by newly-launched Ayataka Koi Ryokucha.
 CVS decline on pullback in marketing programs, including Olympics despite newly                                Sports impacted by category decline & weak large PET. Includes
 launched Georgia Latte Nista, etc.                                                                             contribution of newly-launched 950ml PET
 VM decline on lower traffic, especially indoor locations.                                                      Water decline driven by small PET as immediate consumption channels
 Online grew double digits across categories, now 2% of total NARTD                                             declined despite growth of large PET in SM and D&D
 Revenue per case: Reflects package-mix shift, cycling of prior-year April large PET                            Coffee decline of can & bottle can offset growth in PET packages driven by
 wholesale price increase. Also value pricing of small can and bottle can in VM to drive                        Georgia Latte Nista and Japan Craftsman
 traffic                                                                                                        Juice declined due to sharp drop in R&F demand
 NARTD: Non-alcoholic ready-to-drink

                                                      Note: Volume doesn’t include alcohol. Revenue per case doesn’t include DFR (deduction
                                                      from revenue). Some inconsistencies with the volume data provided in past presentations                                                 18
                                                      may be expected as a result of standardization of volume and revenue calculation.
NARTD channel/category/package volume performance
Q3 2020 volume: -11%                                                                                   By package
By channel                                                            Wholesale                        Q3 YTD 2020
                                                                                                                                                                  vs PY             Volume
                                   Vs. PY                      Volume revenue
              1%                                                      per case                                        2%                                      S-PET                    -11%
                                                                                                                                        7%
                          Supermarket (SM)                           -1%         -78 Yen
       18%                                                                                                                   9%                               L-PET                     +4%
                    27%   Drug & Discounter (D&D)                   +7%          -67 Yen
                                                                                                                           5%                   39%           Can                      -17%
                          Convenience Store (CVS)                  -17%          -50 Yen
                                                                                                                          13%                                 Bottle Can                -5%
     23%
                    17%   Vending (VM)                             -13%          -47 Yen
                                                                                                                                                              Syrup                    -37%
              14%                                                                                                                        25%
                          Retail & Food (R&F)                                   +43 Yen
                            Includes Online
                                                                   -28%                                                                                       Powder                   -28%

By category                                                                                            Q3 2020                                                     vs PY            Volume
                                   Vs. PY                      Volume                                                     2%
     5% 7%                                                                                                                                                    S-PET                    -14%
                                                                                                                                        8%
                          Sparkling                                -15%                                                                                       L-PET                     +6%
                    25%                                                                                                      9%
    19%                   Non-sugar tea (NST)                      -11%                                                                        39%
                                                                                                                           4%                                 Can                      -17%
                          Sports                                     -2%                                                   11%                                Bottle Can                +3%
                    20%   Water                                      +1%
    10%                                                                                                                                                       Syrup                    -33%
                          Coffee                                     -6%                                                                 27%
              14%                                                                                                                                             Powder                   -31%
                          Juice                                    -25%
                                                                                                                                                      S-PET: PET under 600ml/L-PET: PET above 1.5L
                                              NARTD: Non-alcoholic ready-to-drink
                                              Note: Volume doesn’t include alcohol. Revenue per case doesn’t include DFR (deduction
                                              from revenue). Some inconsistencies with the volume data provided in past presentations
                                                                                                                                                                                                19
                                              may be expected as a result of standardization of volume and revenue calculation.
Outlook
Updated Full-year 2020 guidance (Announced on Oct. 5, 2020)
                                                                                                                                      Unit: Million JPY

                      Consolidated                                         2020 Forecast              2019 Actual               YoY (%)
Revenue                                                                             819,700                    914,783                        -10.4
Beverage Business Sales Volume (Million Cases)                                             459                       505                           -9
               NARTD (Non-alcoholic ready to drink) Beverage Volume                        451                       503                          -10
Business Income                                                                            0                    15,042                      -100.0
Operating Income (Loss)                                                              (9,700)                   (55,389)                          -
Net income (loss) attributable to owners of parent                                   (7,000)                   (57,952)                          -

Revenue and Business Income by segment
                                   2020              2019                        Health Care & Skin         2020           2019
Beverage Business                                                     YoY (%)                                                            YoY (%)
                                 Forecast            Actual                      Care Business            Forecast         Actual
Revenue                              794,500          890,009            -10.7   Revenue                      25,200         24,774              +1.7
Business Income (Loss)                (3,600)           11,447               -   Business Income               3,600          3,595              +0.1

                                                                                                                                                          21
Updated full-year 2020 guidance: Drivers of Business Income
   Establishing “New Normal” cost structure to be more resilient and agile
   Selective reinvestment in marketing programs in Q4 as solid foundation for 2021
                                     Volume, price               DME                                                                                  Healthcare &
                                                                                     Commodity            Manufacturing             Others
                                        & mix*             (Fixed DME only)                                                                             Skincare
                                                                                                                                                        Business
                                         -47.1                                                                                                          Income
                    15.0
                                                                     Expect 1.5 to 2 times planned recurring
                                                                        transformational savings in 2020
                                                                                                                                                              0
                                                                                                                                                                            0
                     2019                                                                                                                                                   2020
                    Business                                                                                                                                              Business
                    Income                                                                                                                                                Income
                                                                                                                                                                          Forecast

                                                                                                                                    +29.0

                                                                                       +1.5
Unit: B JPY                                                                                                   -4.3
(Rounded off less
   than unit)
                                                                +5.9
                               *Volume, Price & mix represent marginal profit of our commercial activities including variable costs and deduction from revenue in IFRS.

                                                                                                                                                                                     22
Continued priority on good stewardship of capital
 Dividend                                                                                Year-end Dividend
  •   No change to reinstated year-end dividend plan of 25 yen per share
  •   Focus on return to stable dividend payout during transformation                            25
                                                                                              yen/share
 Balance Sheet and Cash Flow
  •   Identified ~12 billion yen cash-in opportunities throughout this year by selling idle
      assets of land and office space
  •   Sold ~800 million yen in cross-held shares YTD and sales ongoing
  •   Maintaining solid financial position: 51.0% equity ratio as of end of Q3

 Capex and Depreciation                                                 (Billion JPY)   Q3 YTD actual   FY 2020 plan
  •   Full-year capex plan reduced ~21 billion yen versus plan        CAPEX                      57.4          ~75.0
  •   Further opportunities in mid-term capex outlook                 Depreciation               44.3          ~60.0

                                                                                                                       23
Update from Coca-Cola (Japan) Company

                    2020 Highlights

                     Q4 Highlights

                                        24
2020 Business Plan: Planning with Agility & Flexibility
    Plan to maximize
      TOKYO 2020         Revised plan with gradual and selective activity increase in 2H

                             At Home          Platform Innovation          Lemon-dou

                       Innovative Marketing     Vending Recovery         Winter Campaign

                                                                                           25
2020 Year-to-date Highlight

   Coca-Cola Zero Sugar                                           ILOHAS × UNIQLO
                             Georgia Test Your Luck campaign
       Full renewal                                              Eco ACTION campaign

 Attracting new users and    With 1.5 million participants     Working with partners to
 with high repeat purchase           Georgia TM                 promote recycling and
                               Contributing to market              environmental
                                    share growth                    sustainability

                                                                                          26
2020 Year-to-date Highlight

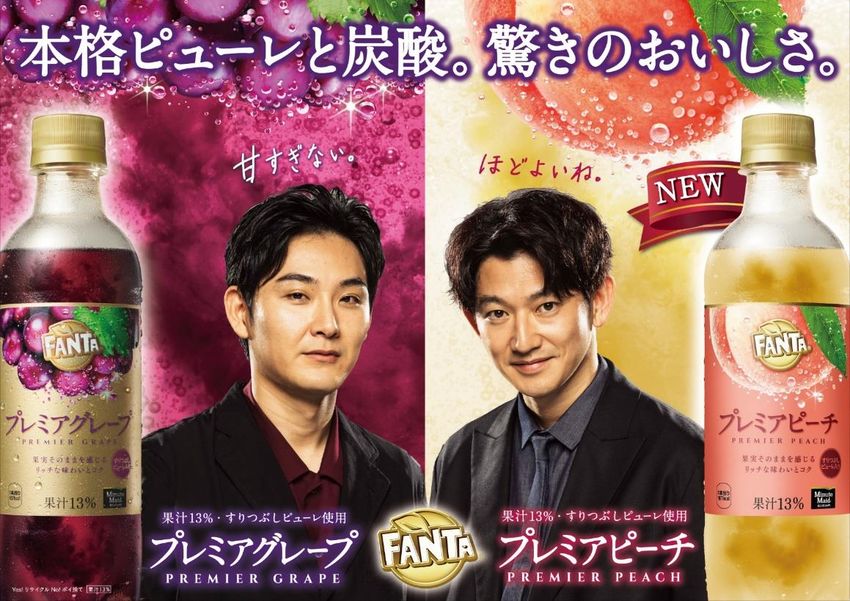
              Kochakaden Craftea                     Fanta Premier
       New flavors and package renewals            Peach introduction
  Lemonade added to the lineup, contributing   Establishing a position as
  to the expansion of the Black Tea Category   Adult sparkling beverage

                                                                            27
Q4 Highlights:Lemon-Dou
        Established as a teiban brand one year after nationwide launch.
     Steadily rolling out initiatives to spark consumer interest and drive further growth.

                                                  No. 5 in hit products
                                               in Nikkei Trendy rankings
                                                           2020

                                                                                   Source: December 2020 issue of Nikkei Trendy

                                                                                                                            28
Q4 Highlights: Vending Welcome Back Program to drive traffic

       Buy One Get One Free Promotion        Coke ON Pay Promotion
                    Oct.                             Dec.

          Shopper recruitment ~1 MM            50% cash back when
                                           purchasing with CokeON pay
       Transaction@ Coke ON VM 3.1MM             (up to 200 JPY)

         Coke ON Downloads: ~800K

                                                                        29
Q4 Highlight : Winter campaign

       TVCM              Youtube                  OOH               Digital        Online live

                                The time together
                          is the best gift you can give.
  Store merchandise   Cake promotion               Pay promotions                McDonald's
                                                                      December
                                       November                                  promotion
                                                                          1
                                          16

                                                                                                 30
Q4 Highlight: Shibuya Coke Vision

        At about 40 meters above the Shibuya Scramble intersection
                      "Shibuya Coke Vision"
            Started at 17:00, October 26 on the rooftop of QFRONT building

                                                                             31
Wrap up
Managing what we can control; Building a foundation for GROWTH
✓   Agile and resilient cost structure in place to match new reality
    • 30 billion yen cost savings expected in 2020; recurring savings up 1.5X-2.0X vs.
      initial plan (pre-coronavirus)
    • 20% reduction in number of vending service routes, 14 sales/distribution centers
      to be closed by year-end, 900 headcount reduction
    • New workstyles, flexible office space, digitally-enabled employees
✓   Actively working toward growth in 2021 despite COVID-19 uncertainty
    • 20% additional aseptic production capacity to meet consumer demand growth
    • 18 months in a row. Vending value share growth momentum
    • Selectively reinvesting in marketing as foundation for volume growth in 2021
    • Additional recurring cost savings in 2021 to help offset 2020 cycling

                                                                                         33
Q&A
Appendix
We are part of the global Coca-Cola system
An enduring and effective partnership

     Coca-Cola (Japan) Company
         •   Brands                     •   Customer focus
         •   Innovation                 •   Local expertise
         •   Global perspective         •   Best-in-class execution
         •   Consumer focus             •   Finished goods production
         •   Superior insight           •   Logistics and distribution
                                        •   Cost optimization

                                                                         36
Glossary of key terms
Business   A measure of our underlying or recurring business performance after the adoption of IFRS. Business Income deducts cost of goods and SG&A from revenue, and
Income     includes other income and expenses which we believe are recurring in nature.
DME        Abbreviation of Direct Marketing Expenses. Sales promotion-related expenses, including advertisement, rebates, sales commissions, etc.
FC         Abbreviation of Future Consumption. Purchase or sell beverage for future consumption in home, etc. It also means the products / SKUs for FC (for example, single
           packages 1L or more and multi-pack of IC packages) and channels that consumers purchase the beverages for FC. (for example, supermarket, drug & discounter channels,
           etc.).
HORECA     Abbreviation of Hotel, Restaurants and Cafeteria. Generally means sales channels of these kinds.
IC         Abbreviation of Immediate Consumption. Purchase or sell beverage for consuming it immediately. It also means the products / SKUs for IC (for example, single packages
           less than 1L as well as fountain) and channels that consumers purchase the beverages for IC (for example, vending machines, convenience store channel, etc.).

PTC        Abbreviation of Price, Terms and Conditions, an internal guideline for setting appropriate transaction conditions with customers, frequently used in conjunction with
           RGM.
RGM        Abbreviation of Revenue Growth Management, an overall strategy and process to achieve profitable revenue growth.
RTM        Abbreviation of Route-to-Market. A framework, a process, a philosophy, a proven approach for driving profitable growth.

Channel definitions                                     Vending                        Retail sales to consumers through vending machine

                                                        Supermarket                    Wholesale to supermarket chains customers

                                                        Drugstore & Discounter         Wholesale to drugstore and discounter chains customers

                                                        Convenience Store              Wholesale to convenience store chains customers
                                                                                       Wholesale to grocery store, liquor store, eating & drinking establishments (HORECA),
                                                        Retail & Food
                                                                                       online sales channels customers, etc.

                                                        Others                         Wholesale to customers other than above

                                                                                                                                                                                   37
THANK YOU
Investor Relations
Coca-Cola Bottlers Japan Holdings Inc.
ir@ccbji.co.jp
https://en.ccbj-holdings.com/ir/
facebook: https://www.facebook.com/ccbji/
You can also read