Half Year 2021 Results - Trustpilot - a universal symbol of trust

Page created by Manuel Arnold
 
CONTINUE READING
Half Year 2021 Results - Trustpilot - a universal symbol of trust
Half Year 2021 Results
Trustpilot - a universal symbol of trust
15th September 2021
Half Year 2021 Results - Trustpilot - a universal symbol of trust
Disclaimer
Important Notice
This Presentation does not purport to be comprehensive or complete and has not been independently verified. It is provided as at its date and is subject to change without notice. Neither Trustpilot Group
plc (the “Company”) nor any other person is under an obligation to update or correct this Presentation or to provide access to any additional information that may arise in connection with it.

“Presentation” means the document of which this page forms part, and such document’s contents or any part of it or them, any oral presentation, any question and answer session and any written or oral
material discussed or distributed before, during or after any meeting at which this document or any part of it is made available.

This Presentation has been prepared for information purposes only and does not constitute an offer to sell, or a solicitation of an offer to subscribe for or purchase, any securities in any jurisdiction, and is not
for publication or distribution in or into any jurisdiction where such publication or distribution is unlawful.

Nothing in this Presentation is intended to form the basis of, or be relied upon in connection with, any investment decision and nor should it be construed as legal, tax, regulatory, financial, accounting or
investment advice or a recommendation to subscribe for, purchase or dispose of any securities. Before making any investment decision you should consult with your own advisers in relation to such matters
and make your own independent assessment and conduct such investigations as you deem necessary.

Forward-looking Statements
This Presentation may include statements that are, or may be deemed to be, “forward-looking statements”. These forward-looking statements can be identified by the use of forward-looking terminology,
including the terms “believes”, “estimates”, “anticipates”, “expects”, “intends”, “plans”, “may”, “will” or “should” or, in each case, their negative or other variations or comparable terminology. They may
appear in a number of places and may include statements regarding the Company’s intentions, beliefs or expectations. By their nature, forward-looking statements involve risks and uncertainties because they
relate to events and depend on circumstances that may or may not occur in the future. Forward-looking statements are not guarantees of future performance and future performance may differ materially from
that set out in or suggested by the forward-looking statements set out in this Presentation. Forward-looking statements speak only as at the date of this Presentation and any obligation to release any update
of, or revisions to, any forward-looking statements in this Presentation is expressly disclaimed. As a result, caution should be exercised when considering such forward-looking statements.

Past performance cannot be relied on as a guide to future performance.

Industry and market data
Where this Presentation contains industry, market or competitive position data it may have come from third party sources. Third party industry publications, studies and surveys generally state that the data
contained therein have been obtained from sources believed to be reliable, but that there is no guarantee of the accuracy or completeness of such data. In addition, certain such data may have come from the
Company’s own internal research and estimates based on the knowledge and experience of the Company’s management in the industries and markets in which the Company operates. No industry, market or
competitive position data contained in this Presentation has been verified by any independent source for accuracy or completeness and such data is subject to change without notice. Accordingly, caution
should be exercised when considering such data.

Financial and other information
Nothing in this Presentation is intended to constitute a profit forecast or profit estimate. Certain figures in this Presentation may be unaudited. In addition, certain figures in this Presentation, including financial
information, may have been subject to rounding adjustments. Accordingly, in certain instances, the sum or percentage change of the numbers contained in this Presentation may not conform exactly to the
total figure given.

The Company utilises a range of alternative performance measures (“APMs”) to assess its performance and this Presentation may contain certain financial measures that are not defined or recognised under
IFRS. Any APMs used in this Presentation should not be considered superior to, or a substitute for, measures calculated in accordance with IFRS. You should not consider any such APMs in isolation, but in
conjunction with measures calculated in accordance with IFRS. APMs used by the Company are unaudited and may not be comparable to similarly titled measures reported by other companies as those
companies may define and calculated such measures differently.

Disclaimer
Neither the Company, nor any of its subsidiary undertakings, nor any of its or their respective directors, officers, employees, agents, consultants or advisers (together, “Associates”) has independently verified
any information contained in the Presentation and none of the foregoing makes any representation or warranty as to, and no reliance should be placed on, the accuracy, fairness or completeness of, this
Presentation. The Company, its subsidiary undertakings and its and their Associates disclaims, to the maximum extent permitted by law, all responsibility and liability, arising in tort, contract or otherwise,
which they might otherwise have in connection with the Presentation.

                                                                                                                                                                                                                             2
Half Year 2021 Results - Trustpilot - a universal symbol of trust
Overview

Peter Mühlmann
Founder and CEO
Half Year 2021 Results - Trustpilot - a universal symbol of trust
Trust is a defining issue of                                                There is strong virality                                                                       We target long-term,
our times                                                                   between the consumer                                                                           sustainable value for all our
                                                                            and business sides of our                                                                      stakeholders
                                                                            platform

•   Trustpilot is a leading                                                 •       One drives and                                                                         •       Strong sense of purpose
    global review platform in                                                       reinforces the other                                                                           and culture
    an emerging and growing                                                 •       This network effect lies                                                               •       Our platform supports a
    category                                                                        at the heart of                                                                                scalable SaaS business
•   Our mission is to provide                                                       Trustpilot’s organic                                                                           with compelling unit
    the ‘trust layer’ for                                                           growth                                                                                         economics
    businesses in the open                                                  •       We have delivered 30                                                                   •       Our global, under-
    commerce ecosystem                                                              per cent compound                                                                              penetrated total
•   Our open platform                                                               annual revenue growth                                                                          addressable market is
    enables businesses and                                                          since 2015                                                                                     estimated to be c.$50bn*
    consumers to gain
    actionable insights and
    collaborate

                * Q1 2021 study commissioned by Trustpilot. Total Addressable Market excludes China and refers to the total future market opportunity that exists including adjacent industries (e.g.
                construction, property, manufacturing), adjacent products (e.g. product and location reviews) and adjacent geographies.
                                                                                                                                                                                                              4
Half Year 2021 Results - Trustpilot - a universal symbol of trust
H1 strategic KPIs

◦   Total cumulative reviews* +44% YoY to 144m

◦   Reviewed domains** +41% YoY to 626k

◦   Active domains +42% YoY to 73k

◦   44bn Trustbox impressions in the period

◦   On average, 44m review invitations sent by
    businesses every month +73% YoY

                   * all submitted reviews including reviews subsequently removed or deleted
                   ** including both claimed and unclaimed domains, and those subsequently removed from the Trustpilot consumer website
                                                                                                                                          5
Half Year 2021 Results - Trustpilot - a universal symbol of trust
H1 financial KPIs

◦   Revenue +31% YoY to $62m (+22% c/c)

◦   Bookings +37% YoY to $75m (+28% c/c)                                                                                            The financial KPIs in the first half of
◦   ARR +36% YoY to $134m (+27% c/c)                                                                                                the year were strong across the
◦   LTM Net Dollar Retention Rate at 97%                                                                                            business
◦   Bookings growth strong across all regions

                   * including reviews subsequently removed or deleted
                   ** including both claimed and unclaimed domains, and those subsequently removed from the Trustpilot consumer website
                                                                                                                                                                              6
Half Year 2021 Results - Trustpilot - a universal symbol of trust
We provide a trust layer for the open commerce ecosystem

Diverse, global, online
and offline businesses     Money &    Home &   Shopping &   Electronic & Business                    Beauty &
                                                                                    Transportation              Health   Travel
                          Insurance   Garden    Fashion        Tech      Services                    Wellness

Trust

Marketing

CRM

Payments

Commerce infrastructure

                                                                                                                                  7
Half Year 2021 Results - Trustpilot - a universal symbol of trust
Our global addressable market is large and under-penetrated
                                         Diverse global online or offline businesses

       MONEY & INSURANCE                                                                                                                                                        TRANSPORTATION
                                                                   Global Total Addressable
                                                                      Market (ex China) (3)
                                                                           ~$50bn
    HOME & GARDEN                                                                                                                                                                         BEAUTY & WELLNESS

                                                                                   Total
                                                                          Serviceable Addressable
                                                                                 Market (2)                                                                                                HEALTH
SHOPPING & FASHION                                                                $18.8bn

                                                                                                                                                                                    TRAVEL
   ELECTRONIC & TECH
                                                                                           Current
                                                                                         Serviceable
                                                                                         Addressable
                                                                                          Market (1)
        BUSINESS SERVICES
                                                                                           $6.3bn                                                                                OTHERS

                       Source: Q1 2021 study commissioned by Trustpilot

                       1.   Current Serviceable Addressable Market (Current SAM) refers to the realisable market opportunity that exists within Trustpilot 's core industries, products and geographies
                            assuming maximum currently observed penetration rates of 48% and maximum conversion rates to paid customers of 38%
                       2.   Total Serviceable Addressable Market (Total SAM) refers to the future, theoretical long-term market opportunity available to Trustpilot within core geographies, industries and
                            products assuming 100% penetration of addressable businesses and 56% conversion to paid customers
                       3.   Total Addressable Market (TAM) refers to the future theoretical market opportunity assuming Trustpilot, and its competitors, can penetrate adjacent industries (e.g., construction,
                            property, manufacturing), adjacent products (e.g., product and location reviews) and adjacent geographies
                                                                                                                                                                                                                  8
Half Year 2021 Results - Trustpilot - a universal symbol of trust
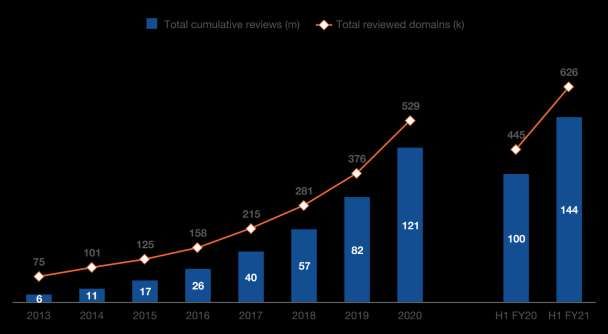
Diverse spread of businesses using Trustpilot

   Money &    Home &         Shopping &          Electronic   Business    Trans-     Beauty &
                                                                                                Travel   Other
  Insurance   Garden          Fashion               Tech      Services   portation   Wellness

              Selected H1 business customer additions
                                                                                                                 9
Half Year 2021 Results - Trustpilot - a universal symbol of trust
Our organic growth is driven by a powerful viral network effect

       Consumers                                                                                                                     Businesses

      144m                                                              Showcase                    Better informed
                                                                                                                                      626k
    Reviews by consumers                                              Trustpilot stars                consumer                     Reviewed domains
 (44% YoY growth globally) (1),(2)                                     Share experiences                                      (41% YoY growth globally) (1),(3)

                                                                        Learn from                     Consumer
                                                                        consumer                       experience
                                                                        experience

                                                                    Business engage                     Shared on
                                                                    via software with                   Trustpilot
                                                                        customers

 Better informed purchasing                                                                                                     Showcase, learn and grow
 based on the experience of                                                                                                         more efficiently
      other consumers                                                     New business added to platform

                                                                                                                                    Increased traffic,
     Your voice matters                                                                                                         conversion, revenues and
                                                                                                                                      customer LTV

                          Consumer engagement drives growth in business customers

                        Notes:
                        1.   As of 30 June 2021
                        2.   All submitted reviews (inclusive of reviews subsequently removed or deleted)
                        3.   All reviewed domains (inclusive of domains subsequently removed from Trustpilot consumer site)                                       10
Opportunity to convert reviewed domains to paying customers

      Global universe of c.13 million potential business customers (1)

                                                                                 626k
                                                                        reviewed domains (2)

                                                                                 481k
                                                                         claimed domains (3)

                                                                                  73k
                                                                      total active domains (4)

                                                                                  21k
                                                                 paying business customers (5)

           Notes:
           1. Q1 2021 study commissioned by Trustpilot; addressable businesses includes companies within core industries only, excluding holding companies and those without a website, and excluding China
           2. 30 June 2021; all reviewed domains (inclusive of domains subsequently removed from Trustpilot consumer site)
           3. 30 June 2021; number of domains who have claimed their profile on Trustpilot and can access features like inviting customers to write reviews, replying to reviews, and being notified whenever
              someone writes a review
           4. 30 June 2021; number of domains that have claimed their profile on Trustpilot and have at least 1 invited review or Trustbox impression in the month
           5. 30 June 2021
                                                                                                                                                                                                              11
A scalable SaaS platform

Trustpilot software provides                                  We go to market with a flexible                                                        We are a successful fast
critical support for businesses to                            freemium model                                                                         growing SaaS company, with
understand and respond to true                                                                                                                       high gross margin and high
consumer sentiment                                                                         Free                                                      retention

                                                                           Standard + Add-ons
    Build a trusted brand                                                   (Annual subscription model)

    Engage with customers                                                Invite                              Location                                 $134m                                      81%
                                                                                                             Reviews                                  ARR (1) (30% annual                        Gross Margin (1)
                                                                         Convert
    Leverage reviews for trust-                                                                                                                       revenue growth since
                                                                                                             Integrate                                2015) (2)
    based marketing                                                      Enhance
                                                                                                             Insights
    Apply learnings and grow                                             Connect
    efficiently                                                                                              …
                                                                         Product
                                                                         Reviews                                                                      97%                                      ~$5,800
Estimated ~ 25-30% total                                                                                                                              LTM Net Dollar                           Average
compounding uplift on revenue                                                        Enterprise                                                       Retention Rate (4)                       Contract Value (3)
for Trustpilot users (5)                                              (Annual subscription tailored offering)

                     Notes:
                     1.   30 June 2021
                     2.   Compound annual revenue growth rate of 30% from 2015 to H1 FY21; constant currency growth
                     3.   H1 FY21
                     4.   Represents all customers renewing in LTM June 2021. Retention refers to US$ amount rather than customer count rate. Retention rate determined by taking retention bookings
                          contracts up for renewal. Inclusive of up- and cross-selling of existing customers
                     5.   Based on a Q1 2021 study commissioned by Trustpilot                                                                                                                              12
Our business customers amplify our brand across all channels

  7.4bn monthly TrustBox                1.2bn Google monthly                          263m Review invitations in
      impressions (1)                      search results (3)                               H1 FY21 (2)                                                 Offline                                             TV
(32% YoY growth globally)                                                             (73% YoY growth globally)

                                                          73k+ active domains (4)
                                                                                                                     3. Average monthly Google Search impressions in H1 FY21. Google Search impressions counted
                Notes:                                                                                                  as the number of times that a link to a Trustpilot page has been returned in response to a
                1. Average monthly TrustBox impressions in H1 FY21. Trustbox Impressions is the number of customer      Google search, on any page of the search results
                   webpage loads with an embedded TrustBox, but the consumer does not necessarily see the TrustBox   4. 30 June 2021; number of domains that have claimed their profile on Trustpilot and have at least
                2. Review invitations in H1 FY21, includes via invitation methods tracked inside the product            1 invited review or Trustbox impression in the month                                              13
Our strategic investment priorities

               Consumer Trust                                  Markets and Growth

◦   Technology and processes to protect content
                                                  ◦   Scaling channels
    integrity
                                                  ◦   Partners and eCommerce integrations
◦   Published inaugural Transparency report

           Business Proposition                                           People

◦   Automation and efficiency                     ◦   Make Trustpilot the place where talent can thrive

◦   Enhanced personalization and insight          ◦   Continue to strengthen our leadership team

                                                                                                          14
Finance
review

Hanno Damm
CFO
A strong H1 financial performance

     Bookings                        Revenue                                           ARR                              LTM Net Dollar          Adj. EBITDA
                                                                                                                        Retention Rate

     $75.5m                       $62.4m                                    $134.2m                                        97%                    $3.8m
      +28%*                             +22%                                         +27%                                 +600bps                  +121%

 •   Re-acceleration of bookings growth                                                        •     Net Dollar Retention Rate improved by
     continues                                                                                       600bps
                                                                                                          ◦     Reflects investment in retention and expansion
 •   Strong bookings performance across all
     regions                                                                                   •     Balance sheet significantly strengthened post
      ◦   UK +27%
                                                                                                     IPO
      ◦   RoW +36%                                                                                        ◦     Closing H1 net cash balance of $91.4m, after
      ◦   North America +18%                                                                                    paying down $13m of debt

                  *   All percentage growth rates shown here are at constant currency and represent a YoY comparison.
                                                                                                                                                                 16
Bookings and revenue analysis

 •   Regional bookings growth            Six months to 30 June 2021     H1 FY21   H1 FY20 Change Change
                                                                      (USD’000) (USD’000) (YoY)   (c/c)
     drives future revenue growth
                                         Bookings
 •   Bookings growth accelerated in      United Kingdom                 29,750    21,265   +40%   +27%
     all regions
                                         Rest of World                  28,154    18,903   +49%   +36%

 •   H1 revenue growth reflected         North America                  17,574    14,839   +18%   +18%
     prior year bookings growth          Total bookings                 75,478    55,007   +37%   +28%

 •   The bookings growth achieved
     in the period reflects an element   Revenue
     of recovery from the impact of      United Kingdom                 25,137    18,012   +40%   +27%
     the pandemic which disrupted
                                         Rest of World                  22,619    15,839   +43%   +30%
     H1 FY20
                                         North America                  14,692    13,829   +6%    +6%
                                         Total revenue                  62,448    47,680   +31%   +22%

                                                                                                        17
Re-acceleration from COVID impact has continued

 Monthly constant currency ARR (USDm)

      CAGR                                            Jan-17 - Jan-20    Jan-20 - May-20   May-20 - Jun-21
      UK                                                       37%                 10%               33%
      RoW                                                      32%                 11%               35%
      North America   (1)                                      26%                  0%               11%
      Total                                                    32%                  8%               28%

                                                                        UK         RoW          North America (1)

      UK and RoW have returned to pre-crisis month-on-month growth rates and North America continues its recovery

                            Notes:
                            1.   Includes US and Canada                                                             18
High net dollar retention supports bookings and revenue visibility

Bookings by cohort and year (USDm)

    83%            85%                   83%                    84%                             LTM Gross Dollar Retention Rate (1)

     7%            10%                    8%                    13%                             Net expansion (3)

    89%            94%                   91%                    97%                             LTM Net Dollar Retention Rate (2)

                                                                                                                                                                                    3.8x
                                                                                                Increasing first-time customer
                                                                                                base                                                                     LTM H1 FY21
                                                                                                                                                                       Group LTV/CAC (4,5)

                                                                                                High returning customer base

 2017 and before     2018            2019            2020            2021

                   Notes:                                                                                                 3.   Calculated as net dollar retention rate – gross dollar retention rate
                   1.   Determined by taking retention bookings / contracts up for renewal, refers to US$ amount rather   4.   Lifetime Value defined as (Average Customer ACV * Gross Margin %) / Churn,
                        than customer count and excludes up-and cross-selling (expansion) of existing customers                excluding upsell and cross-sell where ACV = Annual Contract Value
                   2.   Determined by taking retention bookings / contracts up for renewal, refers to US$ amount rather   5.   Customer Acquisition Costs per customer defined as Sales and Marketing
                        than customer count and includes up-and cross-selling (expansion) of existing customers                                                                                             19
                                                                                                                               Costs / # new customers
Summary income statement

•   Revenue growth principally driven   Six months to 30 June 2021
                                                                            H1 FY21 H1 FY20 Change Change
    by UK and RoW, reflecting prior                                       (USD’000) (USD’000) (YoY) (c/c)
    year bookings                       Revenue                             62,448     47,680 +31%     +22%
•   Gross margin 81% in the period
                                        Cost of sales                      (11,676)    (8,389) +39%    +30%
    (H1 FY20: 82%)
                                        Gross profit                        50,772     39,291 +29%     +21%
•   Net loss impacted by IPO-related
    transaction costs
                                        Sales and marketing                (21,265)   (21,541)   -1%   -7%
                                        Technology and content             (15,205)   (10,993) +38%    +27%
                                        General and administrative         (30,129)   (11,489) +162% +146%
                                        Other operating income                 391         38     -     -

                                        Loss before net financial items    (15,436)    (4,694) +229% +208%

                                                                                                             20
Adj. EBITDA development

Adj. EBITDA (USD’000) (1)                                                             Reconciliation to adjusted EBITDA (USD’000) (1)

                                                                                                                                                                                    5,515               3,769
               3%                           6%

                                                                                                                                                        9,830

                                                                                                                               3,860

                                                                                                  (15,436)

                            Margin                                                                                          General & Administrative                    Technology & Content

        Phasing of costs for H2 is an important consideration for analyst models. We continue to prioritise investment in driving
                                                               adoption.

                         Notes: Reported figures for all absolute figures and EBITDA margin figures.
                         1.   Adjusted EBITDA equals earnings before interest, taxes, depreciation and amortisation, adjusted to exclude share-based compensation and non-recurring transaction costs
                                                                                                                                                                                                                21
Operating cost analysis

                                       Statutory                                Core
                                                   Change   Change                        Change   Change
                                       H1 FY21                     % of Rev    H1 FY21                    % of Rev
                                                    (YoY)    (C/C)                         (YoY)    (C/C)
                                      (USD’000)                               (USD’000)
        Sales and marketing               21,265      -1%      -7%     34%       21,265       6%      -1%     34%
        Technology and content            15,205      38%      27%     24%       13,978      32%      21%     22%
        General and administrative        30,129     162%     146%     48%       12,151      73%      63%     19%

•   Operating cost trend shown on both a statutory and core basis

•   Details of the adjustment can be found in the release

                                                                                                                     22
A step change in efficiency of customer acquisition

◦   The reduction in expense YoY follows         Sales and marketing costs (USDm)
    actions taken a year ago

                                                              45%
◦   Consequently, the average headcount in
    the period was 254 (H1 FY20: 328)                                                               34%

◦   The saving has been partially offset by
    higher average cost per headcount, higher
    commissions and higher marketing
    expenditure

◦   Expect to incur somewhat higher sales
    and marketing spend in current year and
    beyond, though not a return to levels seen
    in previous years as a share of revenue

                                                      Sales         B2B marketing                         %
                                                                                    Restructuring
                                                      costs         costs                                 revenue

                                                                                                                    23
Summary balance sheet items

•   Closed the period with $91.4m of
                                                                         30 June        31 December
    cash
                                                                          2021              2020
                                                                        (USD’000)        (USD’000)
•   Paid down $12.9m of debt             Non current assets                 24,301           25,460
                                         Trade receivables                   5,114            5,227
•   Balance sheet strengthened
    considerably following the IPO and   Cash and cash equivalents          91,392           50,387
    capital raise                        Other current assets                5,871            4,155
                                         Total assets                      126,678           85,229

                                         Trade and other payables           20,701           25,746
                                         Contract liabilities               25,558           22,849
                                         Borrowings                                 –        12,941
                                         Other liabilities                  15,181           16,694
                                         Total equity                       65,238            6,999
                                         Total equity and liabilities      126,678           85,229

                                                                                                      24
We have identified multiple avenues for long-term growth

                                                                                                          M&A
                                                                                                    Accelerate our growth
                                                                                 New                by acquiring selected
                                                                               services                  companies
                                                        New                  Develop additional
                               Monetise              opportunities             and enhanced
         Product-led                                                        services, using data
        go-to-market                                     Enter new         capabilities and other
                           Upsell & Cross sell
                                                      geographies and             insights
                               to customers
        Investment into                            channels, leveraging
                            through modular
     consumer engagement                          first mover advantage
                           pricing and improve
        and product led                             and network virality
                           efficiencies through
      growth, focused on
                                product-led
        enhancing trust
                             automation and
                           volume onboarding

                                                                                                                            25
Raising revenue guidance for FY21

                                FY20        H1 FY21                             Guidance

                                                               Medium-term: Return to historical constant
            Constant currency
                bookings         18%          28%                 currency growth trend as we head
                                                                        into 2022 and beyond
 Top line

                                                       FY21: Raising constant currency growth for the full year to be
            Constant currency
                revenue          23%          22%     consistent with performance in H1 FY21 (previous guidance was
                                                                            ‘high-teens’ growth)

                  “We previously provided guidance for high-teens constant currency revenue
                  growth in the current year. On the back of stronger H1 FY21 performance,
                  we now expect to achieve a rate of constant currency revenue growth for
                  the full year consistent with H1 FY21.”

                                                                                                                        26
Summary & outlook

•   A strong H1 financial performance

•   Re-acceleration of bookings across all regions

•   Operating KPIs confirm strong progress against our strategic objectives

•   Strong virality between business and consumer sides of our platform is driving our organic growth

•   We have raised our constant currency revenue guidance for FY21 to be consistent with performance
    in H1 FY21*

•   Our strategy to provide the ‘trust layer’ for the open commerce ecosystem is working

                  *   Previous guidance was constant currency revenue growth of ‘high-teens’ for FY21
                                                                                                        27
There has never been a greater need for trust

                                                28
Analyst Q&A
Appendix
A purpose-driven business

                                                                                                                        We are doing something
                                                                                                                        that we believe will create a
                                                                                                                        better world and is really
        750+                                               8                                       43%                  meaningful for the times we
     Employees (1)                                    Locations (1)                         Female employees      (1)
                                                                                                                        live in

                                                                                                                        Trying to solve trust for
                                                                                                                        the internet economy is
        43%
    Female senior
                                                          49                                         ~32                our key purpose
                                                    Nationalities (1)                           Average age (1)
   management (1),(2)

“It’s a positive and empowering culture,                                “There is a big sense of ethics, people         Our stakeholders include
people want the best for each other” (3)                                really want to do the right thing” (3)          our owners and employees,
                                                                                                                        as well as all consumers

— Tudor                                                                 — Liza

                        Notes
                        1.   As of 30 June 2021
                        2.   Employee seniority of Director or above
                        3.   Trustpilot employee quotes
                                                                                                                                               31
Statutory Income Statement

                                                               H1 FY21      H1 FY20     (+/-) %     (+/-) %
     USD'000                                                                                      constant
                                                             (USD’000)    (USD’000)      actual
                                                                                                  currency
     Revenue                                                    62,448       47,680       31%         22%
     Cost of sales                                            (11,676)        (8,389)     39%         30%
     Gross profit                                               50,772       39,291       29%         21%
     Sales and marketing                                      (21,265)      (21,541)      -1%         -7%
     Technology and content                                   (15,205)      (10,993)      38%         27%
     General and administrative                               (30,129)      (11,489)     162%        146%
     Operating loss                                           (15,827)       (4,732)     234%        213%
     Other operating income                                        391            38       NM          NM
     Loss before net financial items                          (15,436)       (4,694)     229%        208%
     Financial income/(expense)                                 (1,820)       (1,717)      6%         34%
     Loss before tax                                          (17,256)       (6,411)     169%        173%
     Income tax                                                     79           585     -86%        -87%
     Loss for the period                                      (17,177)       (5,826)     195%        202%

     Loss before net financial items                          (15,436)       (4,694)     229%        208%
     Depreciation and amortisation                              3,860          2,117       82%         71%
     Non-recurring transaction costs                            9,830            563        NM          NM
     Restructuring costs                                             0         1,744     -100%       -100%
     Share-based compensation, including associated social
     security costs                                              5,515        1,880      193%        180%
     Adjusted EBITDA (non-IFRS)                                  3,769        1,610      134%        121%

                                                                                                              32
Adjusted EBITDA reconciliation

•   Non-recurring transaction costs
    relate to the IPO
                                                                            H1 FY21     H1 FY20
                                        Six months to 30 June 2021
•   We responded to pandemic                                              (USD’000)   (USD’000)
    uncertainties with cost reduction   Loss before net financial items    (15,436)      (4,694)
    and restructuring measures
                                        Depreciation and amortisation         3,860       2,117
                                        EBITDA                             (11,576)      (2,577)
                                        Non-recurring transaction costs       9,830         563
                                        Restructuring costs                      —        1,744
                                        Share-based payments                  5,515       1,880
                                        Adjusted EBITDA                       3,769       1,610

                                                                                              33
Financial glossary

                                  Definition
Bookings                          The annual contract value of contracts signed in a given period, nearly all are 12 months in duration but
                                  in the rare case a contract exceeds 12 months the value reported is only the 12 month equivalent

Revenue                           Recognised revenue, software subscriptions are amortised over the term of the contract

ARR                               Annual Recurring Revenue = Monthly Recurring Revenue * 12

Lifetime Value                    (Avg Customer ACV * Gross Margin %) / Churn

ACV                               Annual Contract Value

LTM Net Dollar Retention Rate     Determined by taking retention bookings / contracts up for renewal, refers to US$ amount rather than
                                  customer count and includes up-and cross-selling (expansion) of existing customers
LTM Gross Dollar Retention Rate   Determined by taking retention bookings / contracts up for renewal, refers to US$ amount rather than
                                  customer count and excludes up-and cross-selling (expansion) of existing customers
Net expansion                     Calculated as LTM Net Dollar Retention Rate – LTM Gross Dollar Retention Rate

Cost of sales                     Cost of goods sold = network costs (c. 14%) + retention costs (c. 71%) + support costs (c. 15%)

CAC                               CAC = Customer Acquisition Cost. Includes Sales and Marketing costs in a given period

CAC per customer                  Sales and Marketing Costs / # new customers

                                                                                                                                          34
Operational glossary

                                    Definition
Active domains                      Number of domains that have claimed their profile on Trustpilot and have at least 1 invited review or
                                    TrustBox impression in the month

Claimed domains                     Number of domains who have claimed their profile on Trustpilot and can access features like inviting
                                    customers to write reviews, replying to reviews, and being notified whenever someone writes a review

Domains with reviews                All reviewed domains (inclusive of domains subsequently removed from Trustpilot consumer site)

Google search results / impressions Number of times that a link to a Trustpilot page has been returned in response to a Google search, on
                                    any page of the search results

Penetration of addressable          Calculated using current Free & Paying domains divided by the number of addressable businesses in
businesses                          each market

Reviews by consumers / total        All submitted reviews (inclusive of reviews subsequently removed or deleted)
reviews

Reviewed domains                    All reviewed domains (inclusive of domains subsequently removed from Trustpilot consumer site)

TrustBox impressions                TrustBox impressions is the number of customer webpage loads with an embedded TrustBox, but the
                                    consumer does not necessarily see the TrustBox

                                                                                                                                            35
You can also read