Acquisition of William Hill International - Creating a global leader in online betting and gaming - 888 Holdings PLC
←
→
Page content transcription
If your browser does not render page correctly, please read the page content below

Acquisition of
  William Hill International
Creating a global leader in online
       betting and gaming

          9 September 2021
DISCLAIMER
    ◎   This presentation does not constitute or form part of any offer for sale or solicitation of any offer to buy or subscribe for any securities nor shall it or any part of it form the basis of or be relied on in
        connection with, or act as any inducement to enter into, any contract or commitment whatsoever.
    ◎   The information contained in this presentation concerning 888 Holdings PLC (the “Company”) does not purport to be all-inclusive or to contain all the information that a stakeholder may desire to have
        in evaluating the Company and the transaction referenced herein, including in relation to the William Hill International business. The information is qualified entirely by reference to the Company’s and
        William Hill International’s publicly disclosed information.
    ◎   No representation or warranty, express or implied, is made or given by or on behalf of the Company or any of its directors, officers or employees as to the accuracy, completeness or fairness of the
        information, opinions or forward-looking statements contained in this presentation. In furnishing this presentation, the Company does not undertake or agree to any obligation to provide stakeholders
        with access to any additional information or to update this presentation or to correct any inaccuracies in, or omissions from, this presentation that may become apparent. The information and opinions
        contained in this presentation are provided as at the date of this presentation. The contents of this presentation are not to be construed as legal, financial or tax advice. Each stakeholder should contact
        his, her or its own legal adviser, independent financial adviser or tax adviser for legal, financial or tax advice.
    ◎   To the extent available, the data contained in this presentation has come from official or third party sources. Third party industry publications, studies and surveys generally state that the data
        contained therein have been obtained from sources believed to be reliable, but that there is no guarantee of the accuracy or completeness of such data. While the Company believes that each of these
        publications, studies and surveys has been prepared by a reputable source, the Company has not independently verified the data contained therein. In addition, certain of the data contained in this
        presentation come from the Company’s own internal research and estimates based on the knowledge and experience of the Company's management in the market in which the Company operates.
        While the Company believes that such research and estimates are reasonable and reliable, they, and their underlying methodology and assumptions, have not been verified by any independent source
        for accuracy or completeness and are subject to change without notice. Accordingly, undue reliance should not be placed on any of the contained estimates or research in this presentation.
    Forward-looking statements
    ◎   Certain information contained in this document, including any information as to the Company’s strategy, plans or future financial or operating performance constitutes “forward-looking statements”.
        These forward-looking statements can be identified by the use of terminology such as, “aims”, “anticipates”, “assumes”, “believes”, “budgets”, “could”, “contemplates”, “continues”, “estimates”,
        “expects”, “intends”, “may”, “plans”, “predicts”, “projects”, “schedules”, “seeks”, “shall”, “should”, “targets”, “would”, “will” or, in each case, their negative or other variations or comparable terminology.
    ◎   Forward-looking statements appear in a number of places throughout this document and include, but are not limited to, express or implied statements relating to: the Company’s business strategy and
        outlook; the Company’s future results of operations; the Company’s and the William Hill International’s future financial and market positions; the Company’s margins, profitability, cash, borrowings and
        prospects; expectations as to the Company’s future growth; the Company’s plans with respect to capital expenditure; general economic trends and other trends in the industry in which the Company
        operates; the impact of laws and regulations on the Company and its operations; and the competitive environment in which the Company operates.
    ◎   By their nature, forward-looking statements are based upon a number of estimates and assumptions that, whilst considered reasonable by the Company are inherently subject to significant business,
        economic and competitive uncertainties and contingencies. Known and unknown factors could cause actual results to differ materially from those indicated, expressed or implied in such forward-
        looking statements. Forward-looking statements are not guarantees of future performance. Any forward-looking statements in this document reflect the Company’s current view with respect to future
        events and are subject to certain risks relating to future events and other risks, uncertainties and assumptions.
    ◎   The forward-looking statements contained in this presentation reflect knowledge and information available as of the date of preparation of this document. The Company and its directors expressly
        disclaim any obligations or undertaking to update or revise publicly any forward-looking statements, whether because of new information, future events or otherwise, unless required to do so by
        applicable law or regulation. Nothing in this document should be construed as a profit forecast. The information contained in this communication is not an offer to sell or a solicitation of an offer to
        purchase interests in any company or a related entity, nor is it intended to provide, and should not be relied on for, investment, tax, legal or financial advice.

2
Overview Itai Pazner, CEO

AGENDA

    1   Overview

    2   Strategic rationale

    3   Platform for future growth

    4   Financial summary

    5   Q&A

4
HIGHLIGHTS
Transformational acquisition creating a high-growth global leader with significant scale

                                                                             Portfolio of
                                                                           leading brands
                           Diversification into betting
             1

                           Creation of a regulated market leader
                 2

Compelling
 strategic           3     Increased scale and management capabilities
 benefits

                 4
                           Improved customer proposition
             5

                           Strong financial returns

 5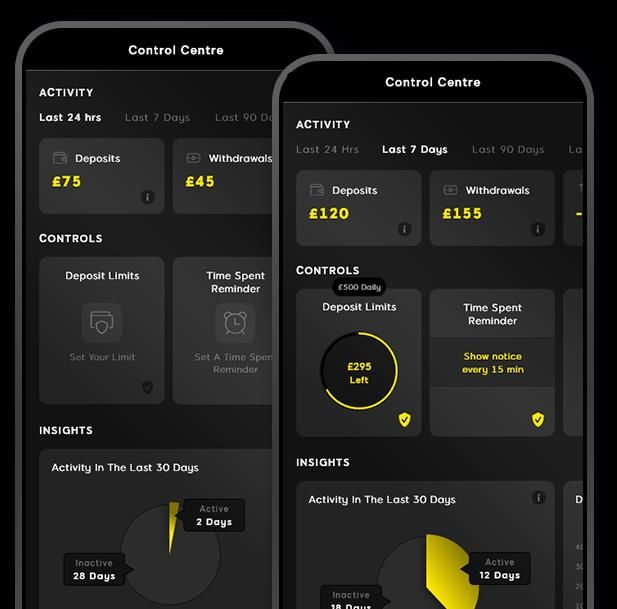
A POWERFUL COMBINATION
Significant increase in scale, with complementary profiles to drive value creation
                                                                                                        888                                                             William Hill International

                                              ◎                       Scalable and proven proprietary technology platform                         ◎   Founded in 1934 – iconic sports heritage and trusted brand
                                              ◎                       End-to-end product suite across Casino, Sports, Poker, Bingo                ◎   William Hill is the #1 betting brand in the UK for awareness
                                              ◎                       Diversified geographic footprint with a focus on casino                     ◎   Over 1,400 retail betting shops in the UK
         Business                             ◎                       Licenses in 16 jurisdictions, with more in the pipeline                     ◎   Over 3 million active online customers across Europe through
         overview                             ◎
                                                                                                                                                      renowned William Hill and Mr. Green brands
                                                                      Over 1,500 employees, with significant online marketing
                                                                      expertise                                                                   ◎   Strong positions in the UK, Italy, Spain and Nordics
                                              ◎                       In-house games studio producing >140 high quality games                     ◎   Over 10,000 employees across multiple locations, with a
                                              ◎
                                                                                                                                                      strong management team significantly enhancing capabilities
                                                                      AI powered product personalisation

                                                                      300                                                   $273m                       Online revenue growth YoY               UK Online Market Share1
                                                                                                              $255m                       $256m
                                                                      250                                                                                                         61%                    +51%
                                               Quarterly revenue $m

                                                                                  $214m         $216m                               $214m                                                                                    14.0%
                                                                                                                                                                  51%
       Strong                                                         200
                                                                                                                      $165m
                                                                                                                                                                                                                    12.5%

                                                                                                        $145m                                                            38%              38%              10.9%
                                                                            $140m
     momentum                                                         150                 $138m
                                                                                                                                                      32%
                                                                                                                                                           29%                                  9.3%
                                                                                                                                                        24%
     across both                                                      100
                                                                                                                                                                     16%
     businesses                                                        50    +53%           +57%          +75%          +66%          +19%
                                                                                                                                                                                      4%

                                                                       -
                                                                             Q2     Q2     Q3     Q3     Q4     Q4     Q1     Q1     Q2     Q2         Q4 2020     Q1 2021         Q2 2021
                                                                             19     20     19     20     19     20     20     21     20     21               UK   International   Total         Apr-20     Jun-20   Dec-20   Jun-21

 6
     1   Based on monthly data releases from the UKGC, believed to represent approximately 80% of the market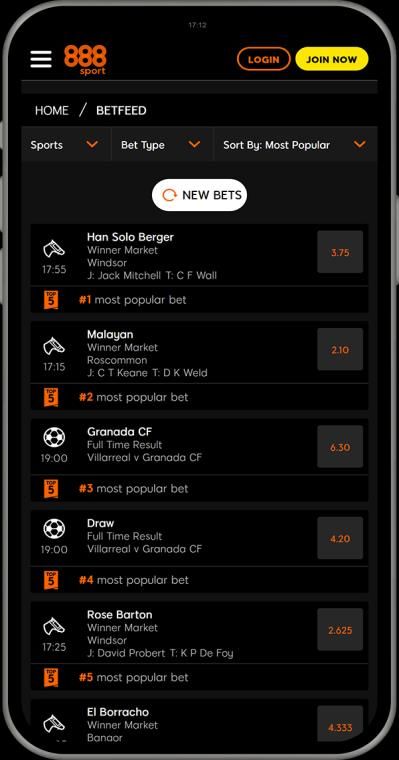
Strategic rationale Vaughan Lewis, CSO

A TRANSFORMATIONAL COMBINATION
Placing the business in the best position to capitalise on significant growth opportunities

                                     ◎ Enhanced      exposure to sports betting, the world’s largest and fastest growing online segment
      Diversifying revenue mix
                                     ◎ Increases     regulated and taxed revenue mix (FY20: 86%), improving sustainability

     Building leading positions in   ◎ Top-3     positions in the UK and Spain, and top-5 positions across a wide range of markets
        key regulated markets        ◎ Creates     a platform for strong growth in the most attractive regulated / regulating markets

         Enhancing scale and         ◎ Step-change      in scale, alongside huge influx of operational and management talent from William Hill
        capabilities to address
                                     ◎ Ability   to drive operating leverage, providing cash flow to grow, including expansion in the US
         growth opportunities

        Improving customer           ◎ Leveraging     best of both sharing across proprietary technology, product, brand, and marketing
        proposition through
                                     ◎ Omni-channel      opportunity to leverage UK retail footprint to improve experience and drive FTDs
      complementary strengths

        Delivering significant       ◎ Pre-tax    cost synergies of c.£100 million per year, along with potential revenue upside
      shareholder value creation     ◎ ROIC      exceeds WACC and over 50% EPS accretion expected, both in the first year

 8
MULTIPLE STRATEGIC BENEFITS
Combining complementary businesses creates significant growth opportunities

 Sports betting is the fastest growing segment                                                        Scale and capabilities creates a virtuous circle

 ◎ Access          to a leading brand with strong sports heritage
 ◎ Influx      of operating expertise in sports betting                                         Scalable proprietary                      Increased scale
                                                                                                 technology drives                        and flexibility to
                                                                                                 operating leverage                            invest
 Increasingly regulated, large, growing market
 ◎ ~$345         billion global market, online penetration only 16%1
 ◎ Strengthens             position across core and growth markets

 Scale critical given pace of regulatory change
 ◎ Take       advantage of growth opportunities as countries regulate
 ◎ Operating           leverage and ability to manage challenges                                      Increasing                           Brand, marketing,
                                                                                                   engagement and                            and product
 Customer experience is key                                                                     share of wallet drives                   leadership enhances
                                                                                                faster revenue growth                    customer proposition
 ◎ Abilityto leverage complementary strengths across all key
   areas, including technology, product, brand, and marketing
 ◎ Leverage the combined skills and talent of >12,000 staff                                         Underpinned by continued focus on safer gambling

 9
     1   Source: H2GC (2019 due to COVID related retail disruption in 2020. Excludes lottery)
ATTRACTIVE REGULATED MARKETS
Enhanced position in attractive end markets, supporting superior growth profile
                Established and enhanced presence in attractive, growing online markets1                                           Clear route to becoming a global leader

                 2020 Online gambling revenue ($bn) and 5                                                       Combined market:
                                                                                           CAGR
                          year CAGR (2015-2020)                                                                 Position Share     ◎ Significant exposure to UK, the world’s
             UK                                                                             13%                   #3      >12%       largest regulated online market with
                                                                                                                                     significant growth potential from both
      Germany                                                                               12%                   #5      3-5%       further online migration and market share
                                                                                                                                     gains driven by increased share of wallet
            Italy                                                                           17%                   #8     5-10%
                                                                                                                                   ◎ Both 888 and William Hill among fastest
                                                                                                                                     growing brands in the UK2
       Canada                                                                               13%                   #9     5-10%
                                                                                                                                   ◎ Established presence in Germany,
      Sweden                                                                                 6%                   #7     5-10%       Canada and Netherlands with combined
                                                                                                                                     group having greater ability to accelerate
        Spain                                                                               22%                   #3      >10%       growth post-regulation

 Netherlands                                                                                 7%                   #4     5-10%     ◎ Strong  and growing positions in Italy and
                                                                                                                                     Spain, with scale benefits from brand
      Romania                                                                              103%                   #6      3-5%       positions given marketing restrictions
                                                                                                                                   ◎ Greater  operational and product flexibility
      Denmark                                                   Regulated                    8%                   #5     5-10%
                                                                                                                                     to drive share gains in existing markets
                                                               Regulating
       Ireland                                                                              12%                   #4     5-10%       and well positioned to capitalise on
                                                                                                                                     emerging markets
                 $0bn    $1bn     $2bn    $3bn    $4bn     $5bn    $6bn    $7bn     $8bn
 10
        1   Source: Regulus Partners. Market share and position reflects 2020
        2   Management estimates for H1 2021 based on UKGC market data and publicly listed competitor filings
Platform for future growth Itai Pazner, CEO
CORE MARKETS
Strong positions in UK, Italy and Spain, but with significant headroom for growth
                                 UK                                                                                   Italy                                           Spain

                    UK Market Size ($m)                                                                Italy Market Size ($m)                                  Spain Market Size ($m)

                                                         9,051
                                7,753                                                                                             2,381
                                                                                                                      2,061
       4,263                                                                                925                                                                                          1,232
                                                                                                                                                                        963
                                                                                                                                                      360

        2015                     2020                       2025                           2015                       2020         2025               2015              2020             2025

                 Combined 2020 market shares                                                        Combined 2020 market shares                                Combined 2020 market shares
                            12.9%                  12.3%
      11.5%                                                                                                                                                           11.9%
                                                                                                                 10.3%                                                               10.5%
                                                                                                                                                      8.6%             2.4%
                             7.2%                                                                                 3.3%        6.8%                                                    3.5%
                                                    8.3%            WHI                                                                   WHI                                                       WHI
      10.0%                                                                                                                                           5.1%
                                                                    888                                                         2.6%      888                                                       888
                                                                                           2.7%                                                                        9.5%
                             5.8%                                                                                 7.0%                                                                7.0%
                                                    4.0%                                   1.8%                                 4.2%                  3.5%
       1.4%                                                                                0.9%
      Betting               Gaming                  Total                                 Betting               Gaming        Total                  Betting          Gaming          Total

  ◎   Access to a highly trusted, betting-led brand                                ◎   Additional strong brands enhance ability to drive        ◎   Access to a highly trusted, betting-led brand
                                                                                       growth and share given marketing restrictions
  ◎   Ability to enhance gaming cross-sell from                                                                                                 ◎   Creates leadership position in an attractive
      betting, a significant market opportunity                                    ◎   Significant headroom for further digital migration           market, defends against marketing restrictions
 12
      Source: Regulus Partners. Translated to dollars at the average 2020 exchange rates (£1:$1.284; and €1:$1.142)
GROWTH MARKETS
Platform for strong growth in newly regulating markets, and other high growth markets
Newly regulated / regulating markets
2015 2020 2025
$7.5bn
Market Size ($m)
+7% Medium term opportunity
2,553
2,244
+9%
1,741 +12% ◎ Germany: New regulatory framework has somewhat reset the
1,362
1,253
1,125 market, and presents an opportunity to take share
731
370
523
◎ Canada: Potential new regulations, both 888 and William Hill
brands well known locally
Germany Canada Netherlands
◎ Netherlands: Rapid growth expected following new licensing
Other high growth opportunities regime, allowing localisation of product and marketing
Market Size ($m) 2015 2020 2025 ◎ Romania: Strong market growth since launch. 888 continues to
+53% take share, with revenue growth in Romania of 138% in H1 2021
1,056
+6% ◎ Denmark: High growth market for Mr Green (revenue +70% in
+8%
547
2020) driving strong market share gains. Combined top 5 position
511 495
440 406
305
236 ◎ Ireland: Both 888 (+87%) and William Hill (+75%) delivered
15 strong revenue growth in 2020, with further share of wallet
opportunity
Romania Denmark Ireland
13
Source: Regulus Partners. Translated to dollars at the average 2020 exchange rates (€1:$1.142; and C$1:$0.746). Boxes showing % growth on the charts represent 2015-2025 CAGRTHE USA
Bolstering US expertise to enhance the SI Sportsbook growth profile
Strong foundations to drive market share gains and exploit long-term opportunity
Scalable
Proprietary
Technology
Integrated
Content, Product
Media & Leadership
Gaming
Iconic
Operational
Leading
Expertise
◎ >12m loyal readers annually Brand
◎ >35m monthly unique visitors
◎ Fastest growing sports media Growing ◎ WHI brings significant additional
brand in the US1 ◎ Market access for SI Market sportsbook operating expertise,
◎ SI consumer is 78% more including from prior operations in the US
Sportsbook in 4 states Access
likely to wager and >3x as ◎ Enhanced internal capabilities and
◎ Plan to roll out 2-3
likely to visit a betting website1 more states per year capacity to support rollout
14
1 Source: Comscore (refers to SI Media Group)
2 Source: ComscoreIMPROVING CUSTOMER EXPERIENCE
Leverage best in class product features across brands to enhance customer proposition
◎ AI driven personalisation ◎ Shared ethos to make products as safe
◎ Differentiated product as possible and raise industry standards
features
◎ Industry leading Control Centre product
◎ Range of sports/gaming
free to play games
Engaging Safety
Product
Content focus
Usability
rich
◎ 888’s in-house games studio Section 8 produces Scalability ◎ WHI new Smart Data
high quality exclusive games Platform enables significantly
◎ Integrations with all leading 3rd parties including faster app speeds
significant live casino presence across brands ◎ 888 in-house technology
allows full control and
◎ 888 gaming platform adding ~700 games per flexibility over user
year, with record levels of activity experience
◎ Highly scalable WHI trading engine processing
over £3bn worth of sports wagers each year
15RETAIL
An attractive omni-channel opportunity in the UK, and key enabler of online growth
>1,400 $661m $125m
Locations Revenue1 EBITDA1
Profitable estate Customer focus Omni-channel
◎ Right-sized, profitable ◎ Focus on product and ◎ Plus Card seamlessly
estate (~30% fewer user experience integrates online and
shops post 2019 extends to retail, with retail experience
FOBT changes) a world-class gaming
platform, market ◎ Unified Online and
◎ Highest rated retail leading SSBTs, digital Retail teams, building
brand for ‘convenient screens and more… the capabilities and
location’, a key driver tools to cross-sell and
of consumer choice2 ◎ Most recommended service customers
retail brand2 more effectively
16
1 FY2020 presented on a post IFRS16 basis, with an adjustment to include a full year of retail contribution based on the performance during weeks 27-40 of 2020. Translated to US$ at the 2020 average exchange rate £1:$1.2841
2 Source: Betscope survey Q1-Q4 2020 averageFinancial summary Yariv Dafna, CFO
TRANSACTION OVERVIEW
Creation of a global leader in online betting and gaming

                                           ◎   William Hill International (“WHI”) comprises all operations outside the US of William Hill and Mr Green
           Asset to be
                                           ◎   William Hill is one of the UK’s leading bookmakers, with >1,400 retail betting shops across the UK, and c.2 million UK online actives
            acquired
                                           ◎   Core territories in Europe are Italy, Spain and the Nordics. Alongside William Hill, it operates the Mr Green brand across Europe

                                           ◎   Enterprise value of £2.2 billion (inclusive of £0.1 billion IFRS-16 capitalised leases)
                                           ◎   Represents an attractive acquisition multiple of approximately 9.2x normalised EBITDA, and 6.8x on a post-synergy basis for WHI for the 12
       Financing and                           months ending December 20201
      capital structure                    ◎   888 has obtained fully committed debt financing of approximately £2.1 billion to fund the transaction
                                           ◎   At an appropriate time 888 intends to raise c.£500m of gross proceeds by issuing new equity, such that proforma net leverage is under 4x
                                           ◎   Currently expect no changes to 888’s existing dividend policy; cash generative business enables de-leveraging to below 3x in medium term

                                           ◎   Annual revenue and Adjusted EBITDA in 2020 would have been $2.5bn and $464m respectively on a proforma normalised basis2
                                           ◎   Pre-tax cost synergies of c.£100 million per year by 2025, with approximately 1x cash costs to achieve
      Financial profile
                                           ◎   Expected to be value accretive and deliver a post-tax ROIC that exceeds 888’s cost of capital in the first full year following completion
                                           ◎   Over 50% enhancement to 888’s adjusted net earnings per share expected in the first full year following completion

                                           ◎   Conditional, amongst other things, on the approval of 888's shareholders at a general meeting expected to be held in early 2022
      Approvals and
                                           ◎   The board intends to unanimously recommend that 888 shareholders vote in favour
        timetable
                                           ◎   Subject to satisfaction of the conditions to the acquisition, completion is expected to occur during the first half of 2022

 18
       1   Normalised EBITDA for WHI on a post IFRS16 basis and including an adjustment to include a full year of retail contribution based on the performance during weeks 27-40 of 2020. 6.8x multiple includes £85m synergies
       2   Reflects the combined results as if 888 had owned WHI for the entire period, inclusive of the Normalised EBITDA of WHI referred to. WHI results in £ have been translated to $ at the 2020 average exchange rate of £1:$1.2841
ATTRACTIVE FINANCIAL PROFILE
Strong shareholder value creation, with optimised longer term capital structure
Financial profile Capital management framework
Debt
◎ Obtained fully committed debt financing of £2.1 billion
financing
2020 WHI Revenue: $1,486m
◎ Intention to raise gross proceeds of approximately £500
Equity million at the appropriate time
raise ◎ Proforma net leverage of under 4x
◎ Currently expect no changes to 888’s existing dividend
policy (50% of adjusted net profits)
2020 WHI EBITDA: $202m Dividend
◎ Appropriate balance between shareholder returns,
deleveraging, and maintaining ability to invest in growth
ROIC ◎ ROIC expected to exceed 888 WACC by end of first year ◎ Strong free cash flow generation expected to support
Leverage rapid deleveraging
target ◎
Accretion ◎ Over 50% Adjusted EPS enhancement from year one Medium term target below 3x
19
1Pro forma normalised reflects the results as if 888 had owned WHI for the entire period, and is presented on a post IFRS16 basis, with an adjustment to include a full year of retail contribution based on the performance during weeks
27-40 of 2020 during which retail was open and sport was taking place. WHI results in £ have been translated to $ at the 2020 average exchange rate of £1:$1.2841ONLINE REVENUE MIX
Complementary geographic profiles with diversified and balanced product offering
Enlarged group
Americas ROW Americas ROW Americas ROW
11% 2% 2% 0% 6% 1%
Well diversified UK EMEA
geographic split 39% 27% EMEA
29% UK
and enhanced EMEA
52%
30% Spain UK
regulated mix 3% 63%
Italy
Italy
10% Spain
5%
Spain 5% Italy
8% 7%
B2B B2B
4% 2%
Balanced Sports
product portfolio 14% Sports
with enhanced Sports 28%
40%
exposure to high Gaming Gaming
growth sports Gaming
60% 70%
betting 81%
20SYNERGIES
Significant synergy potential to drive immediate value creation and fuel growth
◎ Pre-tax cost synergies of c.£100m1 p.a. including c.£15m A broad range of benefits across the whole cost base
capex synergies, to be realised by the end of 2025
Summary
◎ Estimated one-time cash costs ~1x synergies, to be
incurred in the first three years post completion
23%
32% Cost of sales
Integration ◎ Maintain momentum in existing businesses Marketing
principles ◎ Explore the best of both for technology and product Technology
24% Other overheads
Potential ◎ Potential revenue upside from an enhanced customer 21%
upside proposition and product offerings
Cost synergy phasing Cost of sales Marketing
◎ Economies of scale in payment ◎ External marketing economies of
processing fees scale and optimising spend
£100m
Cumulative synergies ◎ Economies of scale in revenue ◎ Removal of duplicate marketing
share for third party content across technology costs
£69m sports and gaming ◎ Country specific approach to brands
£54m
Technology Other overheads
◎ Consolidating operations and back ◎ Consolidation of corporate and
£10m office onto common platforms, support functions and removal of
where possible duplicate activities
◎ Achieving scale efficiencies in third ◎ Reducing other costs e.g. facilities,
2022 2023 2024 2025
party costs travel and professional services fees
21
1 Synergies have been calculated in $, and translated back to £ for the purposes of this presentation at an exchange rate of £1:$1.4SUMMARY
Transformational acquisition creating a high-growth global leader with significant scale
Portfolio of
leading brands
Diversification into betting
1
Creation of a regulated market leader
2
Compelling
strategic 3 Increased scale and management capabilities
benefits
4
Improved customer proposition
5
Strong financial returns
22Itai Pazner, CEO
Q&A Yariv Dafna, CFO
Vaughan Lewis, CSOAPPENDIX 24
Note: All WHI financial information in this presentation may be different in the Combined Circular and Prospectus, which will
PROFORMA NORMALISED FINANCIALS be prepared in accordance with IFRS and 888’s accounting policies.
The WHI financial information in this presentation does not take into account any subsequent changes that may arise from
the pre-completion reorganisation of the WHI group
Group FY19 Actuals - £m FY19 Proforma normalised - $m
Total Total Normalised Proforma
UK Online Int Online Retail Corporate WHI UK Online Int Online Retail Corporate WHI Adjustments 1 Total 888 normalised
Revenue 481.0 266.2 717.0 1,464.2 614.1 339.9 915.6 1,869.6 1,869.6 560.3 2,429.9
Cost of sales (149.8) (89.9) (162.2) (401.9) (191.3) (114.8) (207.1) (513.2) (513.2) (183.6) (696.7)
Gross profit 331.2 176.3 554.8 1,062.3
0.0 422.9
0.0 225.2
0.0 708.4
0.0 1,356.5
0.0 1,356.5
0.0 376.7 1,733.2
0.0
Marketing costs (106.4) (73.1) 0.0 (179.5) (135.8) (93.4) 0.0 (229.2) (229.2) (152.9) (382.1)
Contribution 224.8 103.2 554.8 882.8
0.0 287.0
0.0 131.8
0.0 708.4
0.0 0.0 1,127.2
0.0 1,127.2
0.0 223.9 1,351.1
0.0
Operating costs (98.0) (73.1) (413.8) (45.0) (630.0) (125.2) (93.4) (528.4) (57.5) (804.4) (804.4) (131.7) (936.2)
Adjusted EBITDA 126.7 30.1 141.0 (45.0) 252.8 161.8 38.4 180.0 (57.5) 322.8 N/A 322.8
0 92.1 414.9
0
IFRS16 depreciation (41.5) (53.0) (53.0) (6.1) (59.1)
Other D&A2 (74.1) (94.6) (94.6) (15.8) (110.4)
Adjusted EBIT 137.2 175.2 175.2 70.2 245.4
Gross margin 68.9% 66.2% 77.4% 72.6% 68.9% 66.2% 77.4% 72.6% 72.6% 67.2% 71.3%
Contribution margin 46.7% 38.8% 77.4% 60.3% 46.7% 38.8% 77.4% 60.3% 60.3% 40.0% 55.6%
Adjusted EBITDA margin 26.3% 11.3% 19.7% 17.3% 26.3% 11.3% 19.7% 17.3% 17.3% 16.4% 17.1%
Group FY20 Actuals - £m FY20 Proforma normalised - $m
Total Total Normalised Proforma
UK Online Int Online Retail Corporate WHI UK Online Int Online Retail Corporate WHI Adjustments 1 Total 888 normalised
Revenue 503.1 299.7 354.2 1,157.0 646.1 384.9 454.8 1,485.8 194.9 1,680.7 849.7 2,530.5
Cost of sales (169.6) (100.3) (76.1) (345.9) (217.7) (128.8) (97.7) (444.2) (444.2) (286.9) (731.1)
Gross profit 333.6 199.4 278.1 811.1
0.0 428.4
0.0 256.1
0.0 357.2
0.0 1,041.6
0.0 1,041.6
0.0 562.8 1,604.4
0.0
Marketing costs (103.8) (85.1) 0.0 (188.9) (133.3) (109.3) 0.0 (242.6) N/A (242.6) (237.1) (479.7)
Contribution 229.8 114.3 278.1 622.2
0.0 295.1
0.0 146.7
0.0 357.2
0.0 0.0 799.0
0.0 799.0
0.0 325.7 1,124.7
0.0
Operating costs (100.6) (67.7) (263.7) (33.0) (464.9) (129.2) (86.9) (338.6) (42.4) (597.0) (597.0) (170.0) (767.1)
Adjusted EBITDA 129.2 46.6 14.5 (33.0) 157.3 165.9 59.9 18.6 (42.4) 201.9 106.6 308.5
0 155.6 464.2
0
IFRS16 depreciation (32.8) (42.1) (42.1) (6.3) (48.4)
Other D&A2 (79.5) (102.1) N/A (102.1) (18.6) (120.7)
Adjusted EBIT 45.0 57.7 164.3 130.7 295.1
Gross margin 66.3% 66.5% 78.5% 70.1% 66.3% 66.5% 78.5% 70.1% 62.0% 66.2% 63.4%
Contribution margin 45.7% 38.1% 78.5% 53.8% 45.7% 38.1% 78.5% 53.8% 47.5% 38.3% 44.4%
Adjusted EBITDA margin 25.7% 15.6% 4.1% 13.6% 25.7% 15.6% 4.1% 13.6% 18.4% 18.3% 18.3%
25
1 Adjustment to include a full year of retail contribution based on the performance during weeks 27-40 of 2020 during which retail was open and sport was taking place Exchange rates used:
2 Other D&A excludes amortisation of acquired intangibles and goodwill impairment 2019: £1:$1.2769; 2020: £1:$1.2481Note: All WHI financial information in this presentation may be different in the Combined Circular and Prospectus, which will
WHI FINANCIAL SUMMARY be prepared in accordance with IFRS and 888’s accounting policies.
The WHI financial information in this presentation does not take into account any subsequent changes that may arise from
the pre-completion reorganisation of the WHI group
WHI Group Actuals - £m Adjusted £m Adjusted $m
Notes
FY19 FY20 LTM May-21 FY19 FY20 LTM May-21 FY19 FY20 LTM May-21
Revenue 1,464.2 1,157.0 1,187.1 1,464.2 1,317.5 1,433.9 1,869.6 1,691.9 1,913.7 ◎ Actual and adjusted results for
WHI divisions in GBP and USD
Cost of sales (401.9) (345.9) (333.9) (401.9) (381.2) (387.5) (513.2) (489.5) (517.2)
Gross profit 1,062.3 811.1 853.2 1,062.3 936.3 1,046.4 1,356.5
0.0 1,202.4
0.0 1,396.5
0.0 ◎ ‘Adjusted’ reflects the inclusion of
Operating costs (809.5) (653.9) (737.2) (809.5) (696.1) (775.4) (1,033.7) (893.9) (1,034.8) a normalisation adjustment to retail
EBITDA 252.8 157.3 116.0 252.8 240.3 271.0 322.8 308.5 361.7 to include a full year of retail
Gross margin 72.6% 70.1% 71.9% 72.6% 71.1% 73.0% 72.6% 71.1% 73.0%
contribution based on the
performance during weeks 27-40
EBITDA margin 17.3% 13.6% 9.8% 17.3% 18.2% 18.9% 17.3% 18.2% 18.9%
of 2020 during which retail was
open and sport was taking place
Revenue by division
UK Online 481.0 503.1 611.5 481.0 503.1 611.5 614.1 646.1 816.1 ◎ EBITDA stated on a post-IFRS16
International Online 266.2 299.7 315.5 266.2 299.7 315.5 339.9 384.9 421.1 basis
Retail 717.0 354.2 260.1 717.0 514.7 506.9 915.6 660.9 676.5
Total 1,464.2 1,157.0 1,187.1 1,464.2 1,317.5 1,433.9 1,869.6 1,691.9 1,913.7 ◎ Period average FX rates used:
◎ 2019: 1.2769
EBITDA by division ◎ 2020: 1.2841
UK Online 126.7 129.2 173.7 126.7 129.2 173.7 161.8 165.9 231.8 ◎ LTM May-21: 1.3346
International Online 30.1 46.6 44.5 30.1 46.6 44.5 38.4 59.9 59.4
Retail 141.0 14.5 (54.6) 141.0 97.5 100.4 180.0 125.1 134.0 ◎ Numbers may not reconcile to
Corporate (45.0) (33.0) (47.6) (45.0) (33.0) (47.6) (57.5) (42.4) (63.5) previously reported William Hill Plc
Total 252.8 157.3 116.0 252.8 240.3 271.0 322.8 308.5 361.7 financial results due to
adjustments made to reflect the
expected deal perimeter and carve
out of the US business
26You can also read