European Gold Forum April 17 - 19, 2018 - AWS
←
→
Page content transcription
If your browser does not render page correctly, please read the page content below
European Gold Forum
April 17 – 19, 2018
Cautionary Note
     Regarding Forward-Looking Statements
CAUTIONARY NOTE REGARDING FORWARD-LOOKING STATEMENTS: This presentation contains or incorporates by reference “forward-looking statements” and “forward-looking information” under applicable
Canadian securities legislation within the meaning of the United States Private Securities Litigation Reform Act of 1995. Forward-looking information includes, but is not limited to information with respect to
the advancement of Cerro Moro and, the Company’s strategy, plans or future financial or operating performance. Forward-looking statements are characterized by words such as “plan,” “expect”, “budget”,
“target”, “project”, “intend”, “believe”, “anticipate”, “estimate” and other similar words, or statements that certain events or conditions “may” or “will” occur. Forward-looking statements are based on the
opinions, assumptions and estimates of management considered reasonable at the date the statements are made, and are inherently subject to a variety of risks and uncertainties and other known and unknown
factors that could cause actual events or results to differ materially from those projected in the forward-looking statements. These factors include the Company’s expectations in connection with the
production and exploration, development and expansion plans at the Company's projects discussed herein being met, the impact of proposed optimizations at the Company's projects, changes in national and
local government legislation, taxation, controls or regulations and/or changes in the administration or laws, policies and practices, the impact of the proposed new mining law in Brazil and the Argentine tax
reform package and the impact of general business and economic conditions, global liquidity and credit availability on the timing of cash flows and the values of assets and liabilities based on projected future
conditions, fluctuating metal prices (such as gold, copper, silver and zinc), currency exchange rates (such as the Brazilian real, the Chilean peso, and the Argentine peso versus the United States dollar), the
impact of inflation, possible variations in ore grade or recovery rates, changes in the Company’s hedging program, risks related to the advanced sales program, changes in accounting policies, changes in Mineral
Resources and Mineral Reserves, risks related to asset disposition, risks related to metal purchase agreements, risks related to acquisitions, changes in project parameters as plans continue to be refined,
changes in project development, construction, production and commissioning time frames, unanticipated costs and expenses, higher prices for fuel, steel, power, labour and other consumables contributing to
higher costs and general risks of the mining industry, failure of plant, equipment or processes to operate as anticipated, unexpected changes in mine life, final pricing for concentrate sales, unanticipated
results of future studies, seasonality and unanticipated weather changes, costs and timing of the development of new deposits, success of exploration activities, permitting timelines, government regulation and
the risk of government expropriation or nationalization of mining operations, risks related to relying on local advisors and consultants in foreign jurisdictions, environmental risks, unanticipated reclamation
expenses, risks relating to joint venture operations, title disputes or claims, limitations on insurance coverage and timing and possible outcome of pending and outstanding litigation and labour disputes, risks
related to enforcing legal rights in foreign jurisdictions, as well as those risk factors discussed or referred to herein and in the Company's Annual Information Form filed with the securities regulatory authorities
in all provinces of Canada and available at www.sedar.com, and the Company’s Annual Report on Form 40-F filed with the United States Securities and Exchange Commission. Although the Company has
attempted to identify important factors that could cause actual actions, events or results to differ materially from those described in forward-looking statements, there may be other factors that cause actions,
events or results not to be anticipated, estimated or intended. There can be no assurance that forward-looking statements will prove to be accurate, as actual results and future events could differ materially
from those anticipated in such statements. The Company undertakes no obligation to update forward-looking statements if circumstances or management’s estimates, assumptions or opinions should change,
except as required by applicable law. The reader is cautioned not to place undue reliance on forward-looking statements. The forward-looking information contained herein is presented for the purpose of
assisting investors in understanding the Company’s expected financial and operational performance and results as at and for the periods ended on the dates presented in the Company’s plans and objectives and
may not be appropriate for other purposes.

The Company has included certain non-GAAP financial measures, which the Company believes that together with measures determined in accordance with IFRS, provide investors with an improved ability to
evaluate the underlying performance of the Company. Non-GAAP financial measures do not have any standardized meaning prescribed under IFRS, and therefore they may not be comparable to similar measures
employed by other companies. The data is intended to provide additional information and should not be considered in isolation or as a substitute for measures of performance prepared in accordance with IFRS.
The non-GAAP financial measures included in this presentation include: co-product cash costs per ounce of gold produced, co-product cash costs per ounce of silver produced, co-product cash costs per pound
of copper produced, all-in sustaining co-product costs per ounce of gold produced, all-in sustaining co-product costs per ounce of silver produced, all-in sustaining co-product costs per pound of copper
produced, adjusted earnings or loss, adjusted earnings or loss per share, adjusted operating cash flows, net debt, net free cash flow, and average realized price per ounce of gold sold, average realized price
per ounce of silver sold, average realized price per pound of copper sold. Please refer to section 14 of the Company’s current and annual Management’s Discussion and Analysis filed on SEDAR for a detailed
discussion of the usefulness of the non-GAAP measures. The terms “EBITDA” and “EBITDA Margin” do not have a standardized meaning prescribed by IFRS, and therefore the Company’s definitions are unlikely
to be comparable to similar measures presented by other companies. The Company believes that in addition to conventional measures prepared in accordance with IFRS, the Company and certain investors and
analysts use this information to evaluate the Company’s performance. In particular, management uses these measures for internal valuation for the period and to assist with planning and forecasting of future
operations. The presentation of EBITDA and EBITDA Margin is not meant to be a substitute for the information presented in accordance with IFRS.

The information presented herein was approved by management of Yamana Gold on April 10, 2018.

All amounts are expressed in United States dollars unless otherwise indicated.

                                                                                                                                                                                                                          2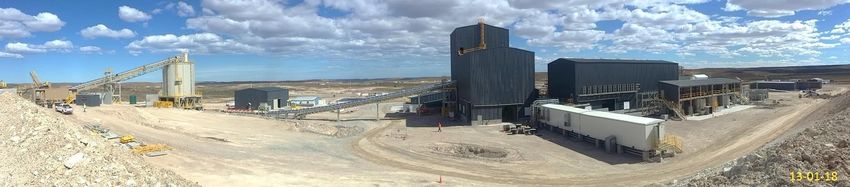
A Compelling Valuation…

        Current 2018E-2019E Free Cash Flow(1)                                                           Current Price/2018E CFPS Trading
               to Market Capitalization                                                                             Multiples
         20%                                                                                      16x

         18%
                                                                                                  14x
         16%
                                                                                                  12x
         14%
                                                                                                  10x
         12%

         10%                                                                                       8x                                                  Highest
                          Yamana
          8%                                                                                                                                           Multiple
                                                                                                   6x                                                   Peer
          6%
                                                                                                   4x
                                                                                                                                    Peer
          4%                                                                                                                       Group
                                                            Peer                                                                  Average
                                                                                                   2x         Yamana
          2%                                               Group
          0%
                                                          Average                                  0x

                                                         Near-Term Catalysts
           Support a compelling investment opportunity as value is surfaced
Source: FactSet; Based on Consensus Analyst estimates and NYSE closing trading prices as of April 3, 2018. Peer group includes: Agnico Eagle, Barrick Gold, Centerra Gold, Eldorado
Gold, First Quantum, Goldcorp, IAMGOLD, Kinross Gold, Lundin Mining, New Gold, Newmont Mining and Teck Resources.
1. Cumulative FCF defined as cumulative Operating Cash Flow less Total Capex over the 2018-2019 period based on Consensus Analyst Estimates.                                          3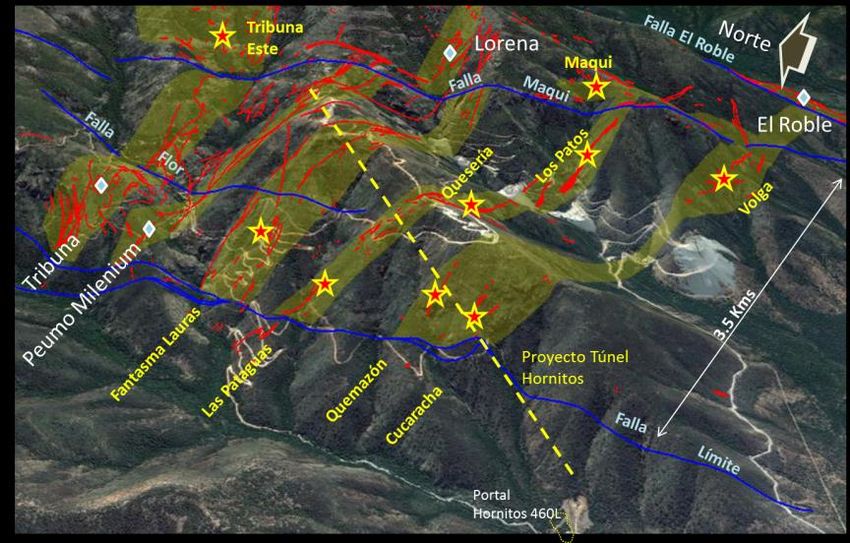
… With Significant Near-Term Production Growth

                   GOLD PRODUCTION (1)                                                                    SILVER PRODUCTION

                                                                                                                                     12.9m oz
                                                                   970k oz

                                                 940k oz
                                                                                                                          10.4m oz
                              900k oz
                                                                                                               8.2m oz

           823k oz
                                                                                                 5.0m oz

             2017              2018               2019              2020                            2017         2018       2019       2020
            Actual           Guidance           Guidance          Guidance                         Actual      Guidance   Guidance   Guidance

           + 120m lbs of copper production per year
1. Excludes production from the Gualcamayo mine and any attribution from Yamana’s interest in Brio Gold Inc.                                    4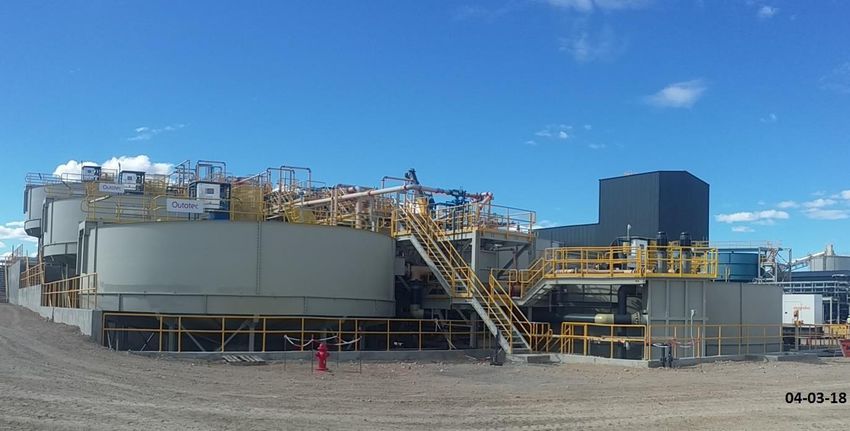
Production Guidance 2018-2020 – GEO (Au + Ag)…
    3-Year CAGR of 8.8%

                 PRODUCTION GEO                             (1)                              2018 COSTS ON GEO BASIS                 (1)

                                                               1.15M oz
                                           1.08M oz                                       By-product cash costs(2) $460-$480/GEO
                       1.01M oz
                                                                                          By-product AISC(2)                  $725-$745/GEO
    892K oz

       2017               2018                2019                2020
      Actual            Guidance            Guidance            Guidance

Note: Gold equivalent ounces include gold plus silver at a ratio of 72:1.
1. Excludes production from the Gualcamayo mine and any attribution from Yamana’s interest in Brio Gold Inc.
2. A non-GAAP measure. A reconciliation of the IFRS measure to this non-GAAP measure can be found at www.yamana.com/Q42017.                   5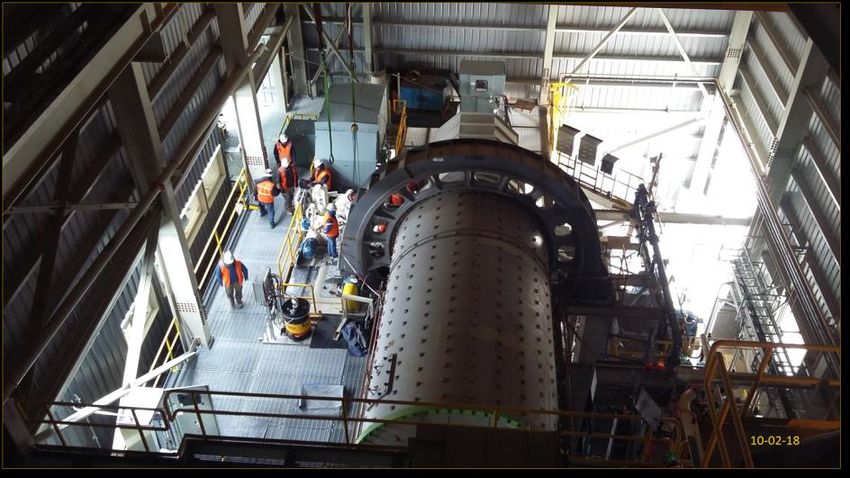
… And Further Cost Improvements
Co-Product Cash Costs and AISC

                                         2018 By-Product AISC(1)
                Forecast at between $725-$745/oz gold and $10.50-$10.80/oz silver

                    Co-Product Cost/oz. Au                                                    Co-Product Cost/oz. Ag

         $900                                                                           $14

         $800                                                                           $12

         $700                                                                           $10

         $600                                                                            $8

         $500                                                                            $6
                       Cash Costs (1)               AISC (1)
                                                                                                    Cash Costs (1)                AISC (1)
                                   2017A          2018E                                                    2017A          2018E

1.   A non-GAAP measure. A reconciliation of the IFRS measure to this non-GAAP measure can be found at www.yamana.com/Q42017.                6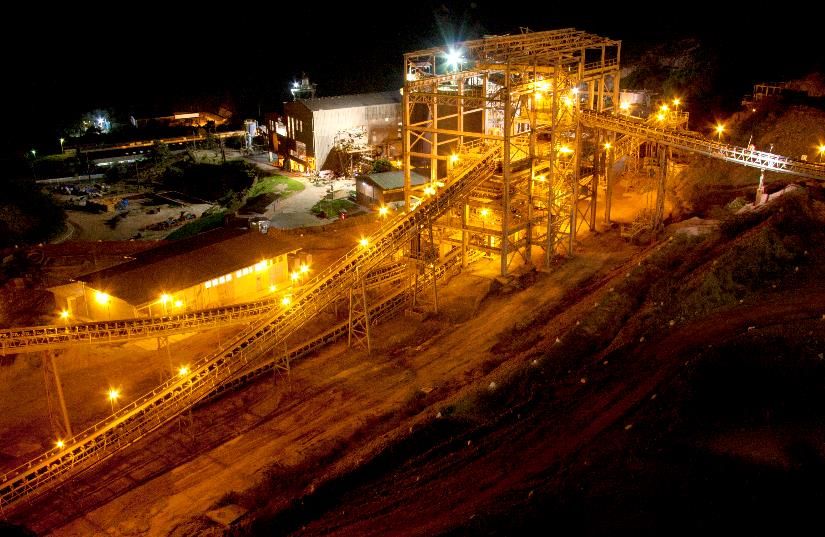
Decreasing Expansionary Capital…
     Investing in Near and Long Term Growth

                                                                  Expansionary Capital(1)

                                  $260M

                                                                          $179M

                                                                                             $50M-$75M

                                2017 Actual                             2018 Guidance       Future Run Rate   (2)

                                                          63% of 2018 total
                               Expected to be spent at Cerro Moro and Canadian Malartic
1.   Excluding capitalized interest and wages.
2.   Absent any new projects moving into the development stage.                                                     7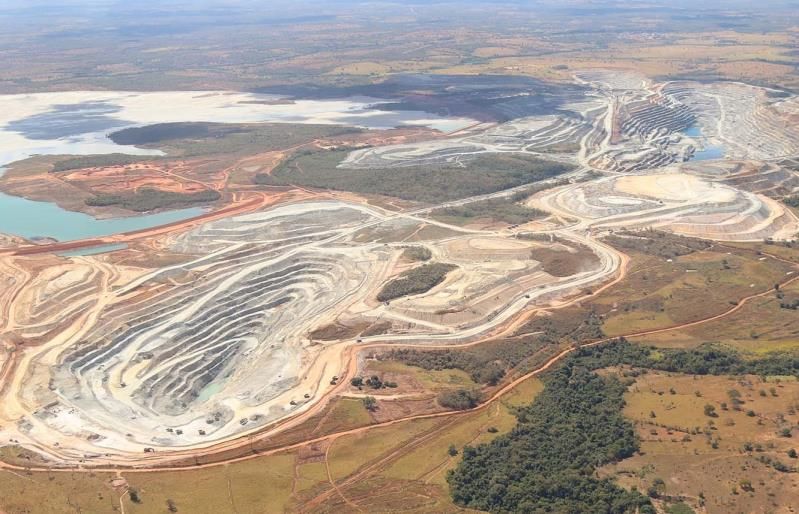
… Delivering Cash Flows and Free Cash Flow Growth
Transitioning to Cash Flow Harvesting
Operating Cash Flow(1,2) 2018 cash flow expected to be back
end loaded, in line with established
seasonal trends
Significant contributions to expected
$613M increased cash flow include Cerro
Moro, Canadian Malartic and Jacobina
$575M Step change to begin in H2 2018 and
more pronounced in 2019
$563M
2016(3) 2017
(4)
2018 Consensus
(5)
Transitioning to Cash Flow Cycle from Investment Cycle
H2 2018 expected to see a step change in cash flow
1. Cash flows from operating activities from continuing operations before net change in working capital (in millions).
2. A non-GAAP measure. A reconciliation of the IFRS measure to this non-GAAP measure can be found at www.yamana.com/Q42017.
3. Adjusted for $64M in advance payments received on metal purchase agreements in Q2 2016.
4. Adjusted for $76.7M in payments made to Brazilian tax matters.
5. Factset Consensus – includes Gualcamayo. 8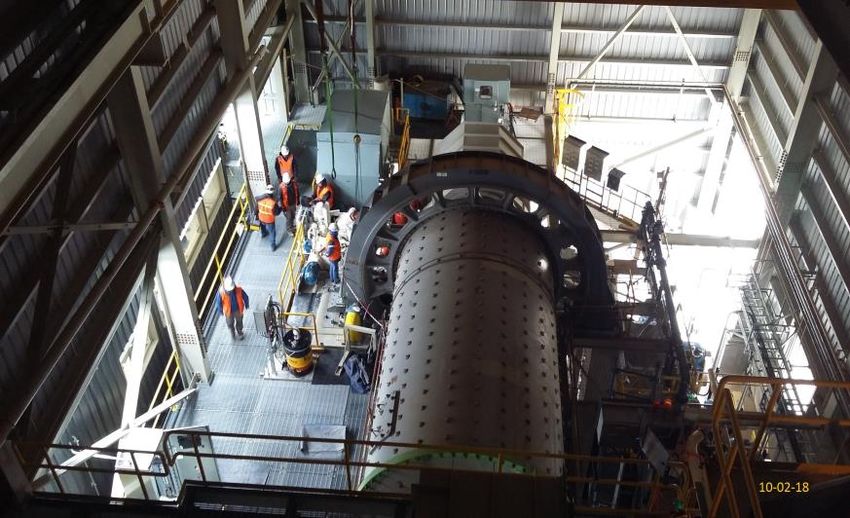
Continuing to Meet Objectives
Recent Operational and Financial Achievements
Increased production guidance
and exceeded updated guidance Continued to enhance
financial flexibility and
Delivered production of all
protect the balance sheet
for the final phase of Cerro
metals at costs in line with or
better than guidance
Moro development
$162.5M monetization of certain
50%-owned exploration
Advanced Cerro Moro according
properties
to plan and positioned it to $300M of senior notes sold at
begin operations in Q2 2018 attractive terms – proceeds to
repay 2018 notes as it comes
Advanced plans for longer term due; 2019 notes redeemed
pipeline including Chapada,
Monument Bay
$125M copper advanced sales
program to better balance cash
flows
Rightsized the portfolio with a
focus on term cash flow growth C$100M raised through sale of
Brio Gold shares
9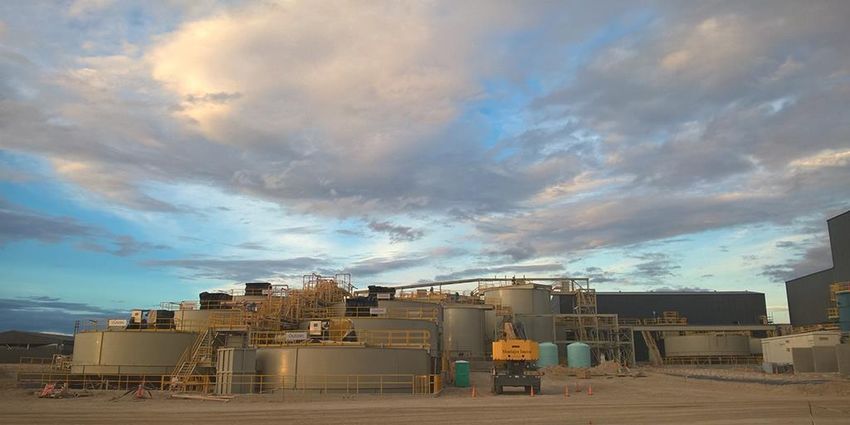
Production Track Record
   Progressive Guidance Increases Through 2017

                       GOLD                                                        SILVER                                              COPPER

                                                 977k oz                             5.0m oz         5.0m oz                                         127m lbs
                                                                                                                                       125m lbs
                                 960k oz

                 940k oz                                                                                                  120m lbs
                                                                      4.7m oz
920k oz

 Original        Updated         Updated        Full Year              Original       Updated        Full Year              Original     Updated      Full Year
Guidance       Guidance Q1     Guidance Q3     Production             Guidance      Guidance Q3     Production             Guidance    Guidance Q3   Production

                                         By-product cash costs(1) and AISC(1) for Full Year 2017

                                                     $561 and $820/oz. Au                                                                                         10
     1.     A non-GAAP measure. A reconciliation of the IFRS measure to this non-GAAP measure can be found at www.yamana.com/Q42017.
Strategic Objectives for 2018
Deliver on guidance and cost Mineral Reserve and Mineral
expectations, including an on- Resource expansion (Cerro Moro,
plan ramp up of Cerro Moro in Q2 Chapada, Canadian Malartic,
Minera Florida, Monument Bay)
Deliver on a step change in FCF
(H2 2018 and more significantly Maximization of cash returns on
in 2019) invested capital with resultant
balance sheet improvements
Advance studies relating to the
range of opportunities at Further progress in portfolio
Chapada, including Suruca rationalization efforts
(oxides/sulphides), Sucupira, (Gualcamayo, Brio, Agua Rica)
Baru, and a plant expansion
11Cerro Moro
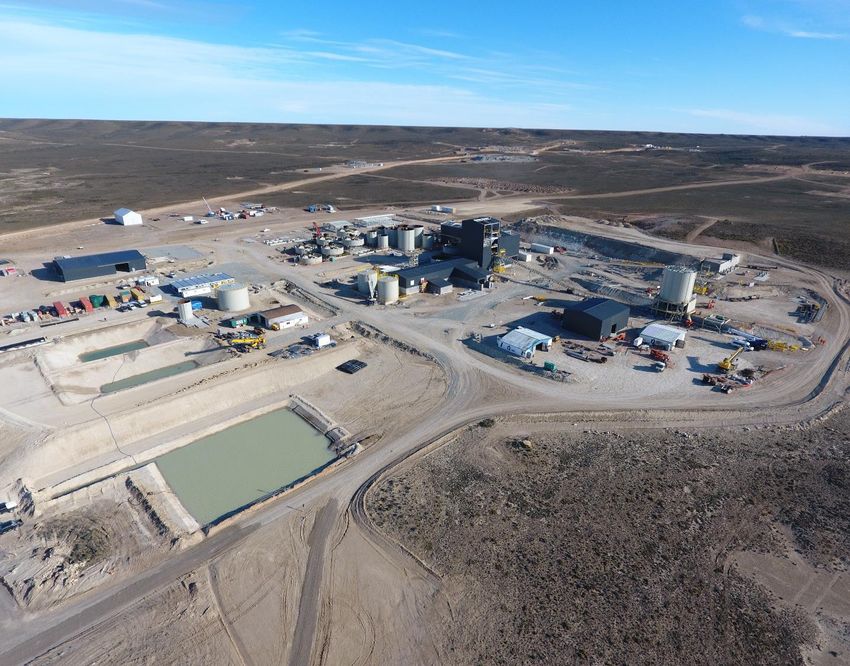
Ramp Up on Schedule for Q2 2018
Underground development on plan. 2017 drilling identified a new high-
2017 activities produced a high grade grade vein, Veronica. Extends 1.5 km
stockpile of ~16,265 tonnes grading along strike, tested down to 250 m
27 g/t gold and 1,725 g/t silver(1) with widths similar to known veins
Open pit operations have Exploration program objective to add
commenced. Development activities 1.0M GEO to the mineral inventory
are underway at the high grade
Escondida Central pit
Mine plan updated to maximize cash flow
Delivering a higher proportion of gold through 2020
1. Refer to the Company’s press release issued on January 11, 2018.
2. A non-GAAP measure. A reconciliation of the IFRS measure to this non-GAAP measure can be found at www.yamana.com/Q42017.
12Cerro Moro
2018 – 2020 Outlook(1)
(Gold in 000 oz) (Silver in Million oz)
150 10.0
8.0
100
6.0
4.0
50
2.0
0 0.0
2018 2019 2020
Gold Silver LOM Avg Gold LOM Avg Ag
Operating Cost Guidance – 2018-2019 avg
Co-product Cash AISC(2)
Costs(2)
Gold $500/oz. $650/oz.
Silver $6.70/oz. $8.85/oz.
1. Refer to the Company’s press release issued on January 11, 2018.
2. A non-GAAP measure. A reconciliation of the IFRS measure to this non-GAAP measure can be found at www.yamana.com/Q42017.
13Chapada
Advancing an Integrated Strategy
Maximize
Asset Integrated Strategic
Value Scenario
Ongoing
Cleaner Integrated
Develop
New
Processing Plant Expansion
Circuit Strategic Mineral
Expansion Scenario Resources Sucupira/Baru
Complete Q2 2018 Ongoing
Stockpiling Strategy
Advanced
Process Targeting Higher Grade
Control
Complete Exploration
Flotation Suruca Complex
Cell (oxides/sulphides)
Retrofit
Complete
Expected to provide update
in Q2 2018
Currently envisaging a
Mine life well in excess of 20 years
14Mineral Reserves and Mineral Resources Estimates(1,2)
Reserves Life Index of 13 Years(3)
1.3
M&I Mineral
Copper Pounds
17.4 Resources
(billions)
3.6
0.3
Inferred Mineral
Gold Ounces (millions)
P&P Mineral
Reserves Resources
M&I Mineral
Resources
13.0 39
11.0 M&I Mineral
Silver Ounces
Resources
(millions)
68 55
P&P Mineral Inferred Mineral P&P Mineral
Reserves Resources Inferred Mineral
Reserves Resources
Mineral reserves and resources life index of 32 years
Mineral reserves life index of 13 years(3)
1. For comparative purposes Mineral Reserves and Mineral Resources estimates exclude exploration properties sold in Q1 2018 and excludes 53.6% of Mineral Reserves and Mineral Resources estimates
for the Brio Gold properties.
2. Further details including tonnes and grade are presented in the Appendix of this presentation and/or refer to the Company’s press release issued on February 15, 2018. 15
3. Based on 2017 production and 2017 year end mineral reserves and mineral resources (excluding Agua Rica, Brio, Gualcamayo, Jeronimo).Focus on Cash Flow Returns on Invested Capital
Optimizing the Allocation of Invested Capital
9,128
Gold Equivalent Ounces(1)(2)
Copper Pounds(1) (millions)
(in 000’s)
11,503
3,112 2,760
2,335
1,787 1,781
1,221 4,853
620 282 161 646 543
Agua Rica La Pepa Suyai Monument Jeronimo Arco Sul Lavra Velha
Bay (57%) Agua Rica
Measured & Indicated Mineral Resources 3 Measured & Indicated Mineral Resources
3
4 4
Inferred Mineral Resources Inferred Mineral Resources
Operating Cash Flow Carrying Value
Increasing operating cash flow Disproportionate exposure to
with the addition of Cerro Moro, non-producing assets
operational improvements and
optimizations Opportunities being evaluated
for portfolio rationalization and
other strategic alternatives
1. As of December 31, 2017, further details including tonnes and grade are presented in the Appendix of this presentation and/or refer to the Company’s press release issued on
February 15, 2018.
2. Gold equivalent ounces include gold plus silver at a ratio of 72:1.
3. Measured and Indicated mineral resources are inclusive of Proven and Probable mineral reserves. 16
4. Mineral resources that are not mineral reserves do not have demonstrated economic viability.A Compelling Valuation…
Current 2018E-2019E Free Cash Flow(1) Current Price/2018E CFPS Trading
to Market Capitalization Multiples
20% 16x
18%
14x
16%
12x
14%
10x
12%
10% 8x Highest
Yamana
8% Multiple
6x Peer
6%
4x
Peer
4% Group
Peer Average
2x Yamana
2% Group
0%
Average 0x
Near-Term Catalysts
Support a compelling investment opportunity as value is surfaced
Source: FactSet; Based on Consensus Analyst estimates and NYSE closing trading prices as of April 3, 2018. Peer group includes: Agnico Eagle, Barrick Gold, Centerra Gold, Eldorado
Gold, First Quantum, Goldcorp, IAMGOLD, Kinross Gold, Lundin Mining, New Gold, Newmont Mining and Teck Resources.
1. Cumulative FCF defined as cumulative Operating Cash Flow less Total Capex over the 2018-2019 period based on Consensus Analyst Estimates. 17Investor Relations
200 Bay Street, Suite 2200
Toronto, Ontario
M5J 2J3
416-815-0220/1-888-809-0925
investor@yamana.com
www.yamana.com
18Appendix
192017 Financial Performance
(in millions except per share figures) FY 2017 FY 2016 Change
Revenue $1,803.8 $1,787.7 $16.1
Net earnings/(loss) (1) $(194.4) $(307.9) $113.5
Net earnings/(loss) per share(1) $(0.21) $(0.32) $0.11
Mine operating earnings $77.7 $(414.9) $492.6
G&A expense (excluding Brio Gold and stock based
$82.9 $82.7 $0.2
expenses)
DD&A $426.8 $462.3 $(35.5)
Sustaining Capital $204.7 $280.5 $(75.8)
Expansionary Capital $320.3 $134.5 $185.8
Exploration capitalized/expensed $82.5/$21.2 $80.4/$14.9 $2.1/$6.3
Cash flows from operating activities(3) $484.0 $651.9 $(167.9)
Cash flows from operating activities before net
$498.0 $626.6 $(128.6)
change in working capital(2)
Cash flows from operating activities before income
$593.7 $690.5 $(96.8)
taxes and net change in working capital(2)
1. Attributable to Yamana equity holders.
2. A non-GAAP measure. A reconciliation of the IFRS measure to this non-GAAP measure can be found at www.yamana.com/Q42017. 20
3. FY 2017 includes $76.7M in payments made to Brazilian tax matters and FY 2016 includes $64.0M in advanced payments received on metal purchase agreements.2017 Cost Overview
Full Year Costs Were In Line with Guidance
2017 Co-product Costs per 2017 Co-product Costs per
2017 Co-product Costs per
Gold oz. Silver oz.
Copper lbs.
$1,200 $16
$2.50
$14
$1,000
$1,023 $14
$13 $2.00
$12
$800 $888
$10 $1.73 $1.74
$10 $1.50
$600 $672 $8 237k $1.54
$400
$6 215k
$1.00
$4
$0.50
$200
$2
$0 $0 $0.00
Cost of Sales Cash Costs (1) AISC (1) Cost of Sales Cash Costs (1) AISC (1) Cost of Sales Cash Costs (1) AISC (1)
Actual Guidance Actual Guidance Actual Guidance
By-product cash costs(1) and AISC(1) for Full Year 2017
$561 and $820/oz. Au
1. A non-GAAP measure. A reconciliation of the IFRS measure to this non-GAAP measure can be found at www.yamana.com/Q42017. 212018 Production Outlook
Increasing Production Compared to 2017
2017 2018E Extra 10,000 oz. as part of
Gold Ounces total gold guidance has not
Chapada 119,852 110,000 been allocated to specific
El Peñón 160,509 145,000 mines
Canadian Malartic (50%) 316,731 325,000
Jacobina 135,806 135,000 At Yamana’s existing mines,
Minera Florida 90,366 90,000 ~47% of gold and 46% of
Cerro Moro - 85,000 copper, are expected in H1
Yamana Gold Production (1) 823,264 900,000 For Yamana’s new mine,
Silver Ounces Cerro Moro, ~25% to 30% of
El Peñón 4.28M 4.40M both gold and silver are
Cerro Moro - 3.75M expected in H1
Yamana Silver Production 4.28M 8.15M
Gualcamayo’s expected
Copper Pounds 110,000 oz. is excluded from
Chapada 127.3M 120.0M total gold production
Historical trend going back to 2010 includes an average of approximately
54% of production in H2 for existing mines
1. Excludes Gualcamayo which produced 154,052 ounces of gold in 2017 and is expected to produce 110,000 ounces of gold in 2018. 222018 Capital Spending and Other Guidance(1)
Lower Expansionary Capex Year-on-Year
Capital Spending 2017 2018E
Sustaining Capital Significant portion of 2018
Chapada $27.9M $25M
expansionary budget relates to
Cerro Moro and the Canadian
El Peñón $38.5M $35M
Malartic Extension Project
Canadian Malartic (50%) $48.2M $50M
Cerro Moro - $21M Significant development,
Minera Florida $24.6M $16M optimization and expansion
Jacobina $21.7M $20M opportunities at Chapada are
Other $2.1M $3M not included
Total Yamana Sustaining $163.0M $170M DDA is impacted with the start-
Total Exploration $83.8M $89M up of production at Cerro Moro
Total Yamana Expansionary $279.9M(1) $192M 2018 capital spending excludes
Gualcamayo and Brio Gold
Other Guidance 2017 2018E
Cash based G&A $82.9M $85M
Depreciation, Depletion,
$384.3M(1) $450M
& Amortization
Note: All figures exclude attribution from Brio Gold.
1. 2017 actuals include Gualcamayo, while 2018 guidance excludes Gualcamayo as it is an asset held for sale. 23Operating Outlook By Mine
Chapada – El Peñón
North Pit Chapada (100%)
Plant
Tailings
Cleaner circuit expansion driving higher recoveries
Pond Central
Pit
IPC
Crusher
An initial study in Q2 ’18 of the opportunities
integrating the Suruca complex (oxides/sulphides);
Sucupira/Baru, a processing plant expansion, and a
South Pit stockpiling strategy is expected
2018 mining rates to remain elevated and to include
stockpiling of 15 million tonnes of low-grade ore
H1: ~44% of Au and ~46% of Cu production
El Peñón (100%)
2018 to be a continuation of successful right-
sizing completed in 2017
Continue productivity improvements,
internalize mine development and ore
haulage
Continue exploration plan in the core mine
and district, and develop new targets
3-year production maintained ~145k oz per
year with AISC projected to be below
$950/oz
24Operating Outlook By Mine
Canadian Malartic - Jacobina
Canadian Malartic (50%)
Extension Project is advancing according to plan
2018 expansionary capex of $52M attributable to
Extension Project ($37M), and remainder
predominantly for studies relating to Odyssey and East
Malartic
Higher grades from the main pit are contributing to
increased production over the guidance period, with
Barnat’s contribution ramping up in 2020/21
Jacobina (100%)
2018 production guidance of 135k oz reflective of
the higher run-rates achieved in 2017
50,000 tonne surface stockpile has increased
flexibility.
Preparation work toward the strategic production
target of 150,000 oz. is expected to impact AISC in
2018
Focus in 2018 will be on expanding inferred
mineral resource estimate and drilling around
higher grade zones
25Operating Outlook By Mine
Minera Florida
Minera Florida (100%)
Spreading out sustaining capital and
exploration expenditures across a number
of years
Lower spending and flat production is
consistent with the transformational
strategy that was implemented in 2017
$28M expansionary capital budget supports
the completion of land concession
acquisition, and mine development in new
ground
Expect production to increase to 120,000
oz. in 2021 with longer term objective of
130,000 oz
Opportunities across the portfolio
to increase production, decrease costs and
increase cash flow generation
26Cerro Moro
Ramp Up Remains on Schedule
Mill commissioning expected in Q1
2018, ramp up to commercial
production expected in Q2 2018
Underground development progressed
according to plan producing a high
grade stockpile of approximately
16,265 tonnes grading 27 g/t gold and
1,725 g/t silver(1)(2)
Open pit operations have commenced
while development activities are
underway at the high grade Escondida
Central pit
Capital Spending Guidance
2018E
Construction Capital $61M
Sustaining Capital $21M
Total Exploration Budget $9M
1. Refer to the Company’s press release issued on January 11, 2018 27
2. A non-GAAP measure. A reconciliation of the IFRS measure to this non-GAAP measure can be found at www.yamana.com/Q42017.Metal Price and Fx Protection
Overview
Metal prices:
Gold option contracts through Q1 2018 (131,900 oz remain outstanding as of
December 31, 2017). Minimum price of $1,300/oz and a maximum price of
$1,414/oz
Copper option contracts over H1 2018. Approximately 7.5M lbs/month with a
minimum price of $2.85/lb and a maximum of $3.33/lb
Copper advance sales program - received $125.0 million on January 12, 2018 in
exchange for approximately 40.3 million pounds of copper to be delivered in H2
2018 and H1 2019 (1/3 of planned production in the period)
Currency:
CAD - C$5 million per month, approximately 30% of the expected operating costs
over the period from January 2018 to December 2018 at a forward rate of 1.25
BRL – R$30 million per month, approximately 30% of the expected operating costs
over the period from January 2018 to June 2019, with average call and put strike
prices of R$3.15 and R$3.47 per US Dollar, respectively
28Delivering Financial Performance
Cash Flow Generation to Drive Deleveraging
Consensus and Target Net Debt/EBITDA
Significant reductions in total debt
since year-end 2014
2.85x Expected step change in cash flow
beginning in 2018 to drive reduction in
net debt
Consensus
~ 2.0x Target Manageable debt repayments through
~1.5x the planned completion of Cerro Moro
Efforts to rationalize and create value
from non-strategic assets provides
FY 2017A(1) Short Term
(1) Intermediate optionality
Term
1. Source: FactSet. Based on Consensus estimates as of February 21, 2018. Consensus EBITDA estimates based on an average 2018 gold price estimate of $1298/oz. 29Scheduled Debt Repayments
Manageable Principal Repayments
($ Millions)
350
300
250
200
150
100 $193
$134
50 $110
0
2018 2019 2020 2021 2022
Senior Notes as of January 29th, 2018 including redemption of $181.5 million of 6.97% senior notes due December 2019 at a make-whole price of 108.12. Excludes revolving
credit facility, obligations under finance lease of $3.3m. 302017 Exploration Success
Replacing Production and Increasing Resource Quality(1)
• Added 405k oz Au and 315 Mlb Cu of new Mineral Reserves before
depletion at Chapada and 498k oz Au and 410 Mlb Cu to M&I. At the
Chapada Suruca SW deposit drilling added 518k oz and 245 Mlb Cu to the M&I
category
• Added 1.2 Moz to Inferred Mineral Resources (above 1,000m) at East
Canadian Malartic Malartic
• Odyssey Inferred Mineral Resources are estimated at 838,000 ounces
• Replaced production depletion by adding 160k oz of Au to Mineral
Reserves
El Peñón • All Mineral Reserves and Resources meet minimum economic mining
parameters
• Discovery of the 1500 m long high grade Veronica vein that will be added to
Cerro Moro resources in 2018, adjacent planned infrastructure
• Exploration replaced production with new Mineral Reserves and also saw a
strong increase in M&I Mineral Resources by adding 1.5 M oz Au
Jacobina • All Mineral Reserves and Mineral Resources meet minimum economic
mining parameters
• Replaced production depletion in Mineral Reserves and saw a very strong
Minera Florida addition to inferred Mineral Resources with 429k oz of new Inferred
Mineral Resources and replacement of converted ounces in M&I
Exploration success in 2017 will contribute to and grow Mineral
Reserve and Mineral Resource ounces in 2018
31
1. Refer to the Company’s press release issued on February 15, 2018.2018 Exploration Program
Focus On Improving Quality of Mineral Resources
• Focus on identifying near mine inferred Resources, both oxide and sulphide
Chapada ($8M) • Target higher grade gold deposits to help improve gold feed grade
• Follow up on regional targets to outline future opportunities for growth
• Continue to drill Odyssey and East Malartic targets to expand resources
Canadian Malartic ($5M) • Continue to look for potential to expand in pit reserves
• Expand Measured, Indicated & Inferred Mineral Resource estimates
El Peñón ($12M) • Test deep extensions of larger veins (ie. Quebrada Colorada)
• Continue to test secondary structures to identify ore opportunities
• Expand Measured & Indicated Mineral Resource estimates
Cerro Moro ($9M) • Add Inferred resources within core mine
• Develop new targets for 2019 through ground program
• Continue to seek quality resources by identifying opportunities for higher
Jacobina ($6M) grade material near infrastructure
• Explore broader land package, only 10-20% covered to date
• Expand Measured, Indicated and Inferred Mineral Resource estimates by
Minera Florida ($10M) following up recent success at Las Pataguas, Tribuna Este, Los Patos & Volga
• Complete regional program to identify new veins near mine
$16M in discretionary exploration spending to
be allocated during 2018 based on results
32Mineral Reserve and Mineral Resource Summary Note: As of December 31, 2017 Note: Refer to the Mineral Reserves and Resources table available at www.yamana.com for further detail on Mineral Reserves and Resources discussed in this presentation. 33
You can also read


