3M FY21 RESULTS PRESENTATION 28.05.2021 - Food Delivery Brands

Page created by Robert Hanson
 
CONTINUE READING
3M FY21 RESULTS PRESENTATION 28.05.2021 - Food Delivery Brands
3M FY21
RESULTS PRESENTATION

28.05.2021
3M FY21 RESULTS PRESENTATION

     DISCLAIMER

This presentation (the “Presentation”) has been prepared and is issued by, and is the sole responsibility of Tasty Bidco, S.L. (together        This Presentation contains financial information derived from Telepizza’s unaudited quarterly financial information for 2020 and 2021.
with its consolidated subsidiaries, "Telepizza" or the "Company"). For the purposes hereof, the Presentation shall mean and include             Financial information by business segments is prepared according to Telepizza’s internal criteria as a result of which each segment
the slides that follow, any prospective oral presentations of such slides by the Company, as well as any question-and-answer session            reflects the true nature of its business. These criteria do not follow any particular regulation and can include internal estimates and
that may follow that oral presentation and any materials distributed at, or in connection with, any of the above.                               subjective valuations which could be subject to substantial change should a different methodology be applied.
Prior to March 31, 2020, the Company reported at the level of Telepizza Group, S.A. As of March 31, 2020, and, as permitted by                  In addition, the Presentation contains certain quarterly alternative performance measures which have not been prepared in
Section 4.02(b) of the indenture governing Foodco Bondco, S.A.'s €335,000,000 6 1⁄4% Senior Secured Notes due 2026, Foodco Bondco               accordance with International Financial Reporting Standards, as adopted by the European Union, nor in accordance with any
S.A. has elected to report at the level of the Company as a parent entity, in lieu of providing consolidated financial statements of            accounting standards, such as “system sales”, “like-for-like chain sales growth”, “EBITDA” and “digital sales” and others. These
Foodco Bondco S.A. Accordingly, comparative figures included in this presentation correspond to the financial results of Telepizza              measures have not been audited or reviewed by our auditors nor by independent experts, should not be considered in isolation, do
Group, S.A. and its subsidiaries as of and for the periods presented. There are no material differences between the consolidated                not represent our revenues, margins, results of operations or cash flows for the periods indicated and should not be regarded as
financial statements of Foodco Bondco S.A. and the Company.                                                                                     substitutes to revenues, cash flows or net income as indicators of operational performance or liquidity.
The information contained in the Presentation has not been independently verified and some of the information is in summary form.               Market and competitive position data in the Presentation have generally been obtained from industry publications and surveys or
No representation or warranty, express or implied, is made by the Company or its affiliates, nor by their directors, officers, employees,       studies conducted by third-party sources. There are limitations with respect to the availability, accuracy, completeness and
representatives or agents as to, and no reliance should be placed on, the fairness, accuracy, completeness or correctness of the                comparability of such data. Telepizza has not independently verified such data and can provide no assurance of its accuracy or
information or opinions expressed herein. Neither Telepizza, nor its directors, officers, employees, representatives or agents shall            completeness. Certain statements in the Presentation regarding the market and competitive position data are based on the internal
have any liability whatsoever (in negligence or otherwise) for any direct or consequential loss, damages, costs or prejudices                   analyses of Telepizza, which involve certain assumptions and estimates. These internal analyses have not been verified by any
whatsoever arising from the use of the Presentation or its contents or otherwise arising in connection with the Presentation, save with         independent source and there can be no assurance that the assumptions or estimates are accurate. Accordingly, no undue reliance
respect to any liability for fraud, and expressly disclaim any and all liability whether direct or indirect, express or implied, contractual,   should be placed on any of the industry, market or Telepizza’s competitive position data contained in the Presentation.
tortious, statutory or otherwise, in connection with the accuracy or completeness of the information or for any of the opinions
                                                                                                                                                You may wish to seek independent and professional advice and conduct your own independent investigation and analysis of the
contained herein or for any errors, omissions or misstatements contained in the Presentation.
                                                                                                                                                information contained in this Presentation and of the business, operations, financial condition, prospects, status and affairs of
Telepizza cautions that the Presentation contains forward looking statements with respect to the business, financial condition, results         Telepizza. The Company is not nor can it be held responsible for the use, valuations, opinions, expectations or decisions which might
of operations, strategy, plans and objectives of the Company. The words "believe", " expect", " anticipate", "intends", " estimate",            be adopted by third parties following the publication of this Presentation.
"forecast", " project", "will", "may", "should" and similar expressions identify forward-looking statements. Other forward-looking
                                                                                                                                                No one should purchase or subscribe for any securities in the Company on the basis of this Presentation. This Presentation does not
statements can be identified from the context in which they are made. While these forward-looking statements represent our
                                                                                                                                                constitute or form part of, and should not be construed as, (i) an offer, solicitation or invitation to subscribe for, sell or issue,
judgment and future expectations concerning the development of our business, a certain number of risks, uncertainties and other
                                                                                                                                                underwrite or otherwise acquire any securities, nor shall it, or the fact of its communication, form the basis of, or be relied upon in
important factors, including risk factors currently unknown or not foreseeable, which may be beyond Telepizza’s control, could
                                                                                                                                                connection with, or act as any inducement to enter into any contract or commitment whatsoever with respect to any securities; or (ii)
adversely affect our business and financial performance and cause actual developments and results to differ materially from those
                                                                                                                                                any form of financial opinion, recommendation or investment advice with respect to any securities.
implied in the forward-looking statements. There can be no assurance that forward-looking statements will prove to be accurate, as
actual results and future events could differ materially from those anticipated in such statements. Accordingly, readers should not             The distribution of this Presentation in certain jurisdictions may be restricted by law. Recipients of this Presentation should inform
place undue reliance on forward-looking statements due to the inherent uncertainty therein.                                                     themselves about and observe such restrictions. Telepizza disclaims any liability for the distribution of this Presentation by any of its
                                                                                                                                                recipients.
The information contained in the Presentation, including but not limited to forward-looking statements, is provided as of the date
hereof and is not intended to give any assurances as to future results. No person is under any obligation to update, complete, revise or        By receiving or accessing this Presentation, you accept and agree to be bound by the foregoing terms, conditions and restrictions.
keep current the information contained in the Presentation, whether as a result of new information, future events or results or
otherwise. The information contained in the Presentation may be subject to change without notice and must not be relied upon for
any purpose.

                                                                                                                                                                                                                                                                                            2
Executive
Summary
EXECUTIVE SUMMARY

 Food Delivery Brands Group

     • Market leading pizza delivery operator in core markets: Spain, Portugal, México, Chile and Ecuador
     • Strategic shift to being a “Brand Operator” following the completion of the transformational partnership with
         Yum! Brands

     • Diversified business model, with profitability generated from
         • Own store sales
         • Royalties and services from franchisees
         • Supply chain sales
     • Vertically integrated supply chain is a key differentiating factor: provides full production and food service
         offering to franchisees

                                                  Key Facts – 3M FY21

                                                                                       Vertically Integrated Supply Chain

                      36           €254m          2,270               77%                   5          +20             2
                                                  Stores in the     Franchised            Dough
 2 Global           Countries   System Sales                                                          Logistics   Innovation
                                                  MF perimeter        Stores            Production
 Brands                                                                                                Centers       Labs
                                                                                         Facilities
EXECUTIVE SUMMARY

Key Messages 1/2

• Strong EBITDA improvement in Q1 of +56% vs. PY despite still down on sales and revenues vs. Q1 2020 (-9.5%
  and -7.2% respectively) due to the restrictions related to the pandemic
   • Q1 FY21 adjusted EBITDA reached c.€6m, +56% vs. PY, above company’s targets
   • Group chain sales amounted to €254m in Q1 FY21 (-9.5% vs. FY20)

• As of 31 March 2021, 94% of our store network were already reopened (97% in EMEA and 92% in Latam)
   • Restrictions to dine in, and to a certain extent, for takeaway and delivery, were still in place in most of our markets
   • The Company expects, although difficult to foresee precisely, that restrictions will be gradually released during H2 but
     still be relevant during Q2

• FDB (Telepizza) and Yum! have adapted the terms of their alliance to reflect the new market and business
 environment arising in the post COVID world. Main changes in respect of the original terms are:
       • Openings: extending the ten-year target by an additional year and revising the net new unit splits by market
       • Conversions: slowing the conversion schedule for Telepizza stores in Chile and Colombia
       • Shortfall fees: postponing the period and increasing the threshold under which shortfall fees would apply
       • Incentive fees: revising the terms and targets for earning the incentive
                                                                                                                                5
EXECUTIVE SUMMARY

    Key Messages 2/2

   • Additionally, Yum! has exercised its call option over the Telepizza brand
         • FDB will retain the usufruct over the Telepizza brand and their distinctive signs and will continue to operate the brand as permitted by
           the agreement

   • The completion of these two milestones, the new contractual framework as well as the refinancing process (completed
     in Jan, as announced in the FY20 results presentation), provides FDB with the best grounds to capture the market
     opportunities arising from the post Covid environment

   • In this still changing scenario, the company restates it confidence to deliver the Guidance for 2021 provided in April of
     €39 to 41m Adjusted EBITDA and CFADS1 of -€10 to -€14m

Note:
1.    Cash Flow Available for Debt Service defined Cash Flow from Operations less Cash Flow from Investing
                                                                                                                                                      6
EXECUTIVE SUMMARY

       3M FY21 Current trading

                             € in millons                   3M FY20   3M FY21   YoY (%)    YoY Change   Apr. 20212   May. 20212

                                      (1)
           Total Owned Stores                                 551       521      -5.4%
                                                                                #¡DIV/0!      -30          520          518
                                            (1)
           Total Franchised Stores                           1,830     1,749     -4.4%
                                                                                #¡DIV/0!      -81         1,751        1,757
           Chain Sales                                        281       254      -9.5%        -27          85           90
           Revenues                                           96        89       -7.2%         -7          29          30-32
           EBITDA                                              4         6       56.3%         2          2.5-3        2.5-3
           Net Debt                                           301       357      18.8%        57           367        365-370
           Cash                                               83        71      -13.7%        -11          62          57-60

Note:
1.    Only includes stores in the MF YUM! Perimeter
2.    These figures are preliminary and subject to change
                                                                                                                                  7
EXECUTIVE SUMMARY

      3M FY21 Trading

                     € in millons                     3M FY20   3M FY21   YoY (%)    YoY Change   January   February   March

                              (1)
     Total Owned Stores                                 551       521      -5.4%
                                                                          #¡DIV/0!      -30        521        518       521
                                    (1)
     Total Franchised Stores                           1,830     1,749     -4.4%
                                                                          #¡DIV/0!      -81        1,740     1,746     1,749
     Chain Sales                                        281       254      -9.5%        -27         91         78       85
     Revenues                                           96        89       -7.2%         -7         31         28       29
     EBITDA                                              4         6       56.3%         2           2         1         2
     Net Debt                                           301       357      18.8%        57         352        354       357
     Cash                                               83        71      -13.7%        -11         78         74       71

Note:
1.    Only includes stores in the MF YUM! Perimeter
                                                                                                                               8
COVID-19
 Update
COVID-19 UPDATE

       COVID-19 Impact

                                                    EMEA                                          Latin America
                                                                     System Sales                                              System Sales
               Region                            Store Closures(1)                   Region          Store Closures(1)
                                                                     YoY Change(2)                                             YoY Change(2)

                                                                                                     c.25% of TPZ              Jan: c (19%)
                                                                     Jan: c (13%)
                                                  c.1% of TPZ                                        c.19% of PH               Feb: c (24%)
                                                                     Feb: c (17%)
                                                  c.6% of PH                                                                   Mar: c 16%
                                                                     Mar: c 33%

                                                                                                                               Jan: c (16%)
                                                                                                       c.3% of PH              Feb: c (23%)
                                                                                                                               Mar: c 42%
                                                                     Jan: c (17%)
                                                  c.2% of TPZ
                                                                     Feb: c (27%)
                                                  c.23% of PH
                                                                      Mar: c 1%
                                                                                                                               Jan: c (20%)
                                                                                                         c.4% of JP
                                                                                              all locations of PH are opened   Feb: c (15%)
                                                                                                                               Mar: c 53%

                                                                     Jan: c 25%
                                         all locations are opened     Feb: c 8%                                                 Jan: c 2%
                                                                     Mar: c 35%                   c.1% of all locations        Feb: c (7%)
                                                                                                                               Mar: c 3%

Note:
1.    Temporary store closures as of the end of March 2021
2.    YoY change on a constant currency basis                                                                                                  10
Financial
 Update
FINANCIAL UPDATE

 System Sales and Revenues

Group System Sales and Revenues (€m)

                          System sales                                                     Revenues

                   281
                                    -9.5%         254                                         -7.2%
                                                                           96
                                                                                                                   89

               232               -8.8%                                    49                                        43
                                                  212                                       -13.0%

                                 -13.1%                                   47                 -1.2%                  47
                   49                             43
             3M FY20                            3M FY21                 3M FY20                                   3M FY21
                                                              Supply chain, Royalties, Marketing & Other income       Own Store Sales
           Franchise Locations              Owned Locations

                                                                                                                                        12
FINANCIAL UPDATE

       Segment Performance – 3M FY21
       System sales across regions
                                                                                                                                             vs 2020 € in millons                   EMEA     LATAM    TOTAL

                                                                                                                                                                      ( 1)
                                                                                                                                        S yste m S a le s G rowth            (% )   -3.7%    -15.5%   -9.5%

                                                                                                                                                               ( 1)
                                                                                                                                     S yste m S a le s G rowth    c onsta nt
                                                                                                                                                                                    -3.4%    -6.5%    -4.9%
                                                                                                                                                 c urre nc y (% )

                                                                                                                                                               ( 1)
                                                                                                                                     S yste m S a le s G rowth      c onsta nt
                                                                                                                                                                                    1.4%     -16.1%   -0.6%
                                                                                                                                          c urre nc y (% ) - Te le pizza

                                                                                                                                                               ( 1)
                                                                                                                                     S yste m S a le s G rowth     c onsta nt
                                                                                                                                                                                    -32.1%   -5.2%    -9.4%
                                                                                                                                          c urre nc y (% ) - P izza Hut

EMEA                                                                   Latam                                                           Te le pizza S yste m S a le s we ight
                                                                                                                                                       (% )
                                                                                                                                                                                    89.9%    11.2%    53.6%
• Spain and Portugal: Good performance vs. PY with only                • As seen during Q4 FY20, the deconfinement process is
  single digits system sales drop (-3.4%) with Telepizza stores          taking longer, relative to EMEA. Also, as seen in Europe,
                                                                         performance by country and brand varies materially as
                                                                                                                                     P izza Hut S yste m S a le s we ight (% )      10.1%    88.8%    46.4%
  already growing vs. Q1 2020, pushed by strong Delivery
  sales with +18% increase vs. PY, meanwhile Pizza Hut sales             result of the diversity of measures applied and the
  still decreasing due to its wider presence in shopping malls           different exposure to dine in and take away
  and other high traffic locations now severely impacted by            • Q1 FY21 system sales decreased by c.6.5% (at constant
  the restrictions (-32% vs. PY). The company expects a                  FX), with Telepizza stores heavily impacted (-16%) due
  gradual release of the measures during H2 2021. As of                  to its mayor presence in Chile, one of the countries with
  March 31st 2021, 96% of stores were opened but subject to              the tougher restriction during this quarter
  opening limitations.
                                                                       • As of March 31st 2021, 92% of stores in the region were
• Rest of Europe: Sales are substantially less impacted by the         opened, also subject to opening limitations
  pandemic with Ireland growing double digits in Q1 2021

Note:
1.    Excluding discontinued operations in Poland and Czech Republic                                                                                                                                          13
FINANCIAL UPDATE

       Unit Expansion 3M FY21

        -108 net stores(1) in the MF perimeter, with 58 openings

        +18 Telepizza stores converted to Pizza Hut
                                                                                             2
                                                                                                                                                                                     2
                                                                                     2
                                                                                                                                                                           2
                                                                     2,381                                                                                    2,270

                                                                    1,038                                                                                   1,006
               EMEA
               LATAM

                                                                    1,343                                                                                   1,264

                                                                    3M FY20                                                                                 3M FY21

Note:
1.    Total openings minus total closures in the Pizza Hut master franchise perimeter (Spain, Portugal, Switzerland and Latam ex-Brazil), including Telepizza and Pizza Hut stores
2.    Only includes stores in the MF Yum! perimeter                                                                                                                                      14
FINANCIAL UPDATE

 Adjusted EBITDA Bridge – 3M FY20 to 3M FY21

                                                                   (€m)

                                                     Other
                                                     operational
                                                     savings to
                                                     increase
                                                     business
                                                     efficiency
                                     Cost cutting
                    Decrease in
                                     actions to
                    sales of 9.5%
                                     adapt
                    due to
                                     overhead
                    restrictions
                                     structure and
                    related to the
                                     phasing
                    pandemic
                                     effects

                                                                          15
FINANCIAL UPDATE

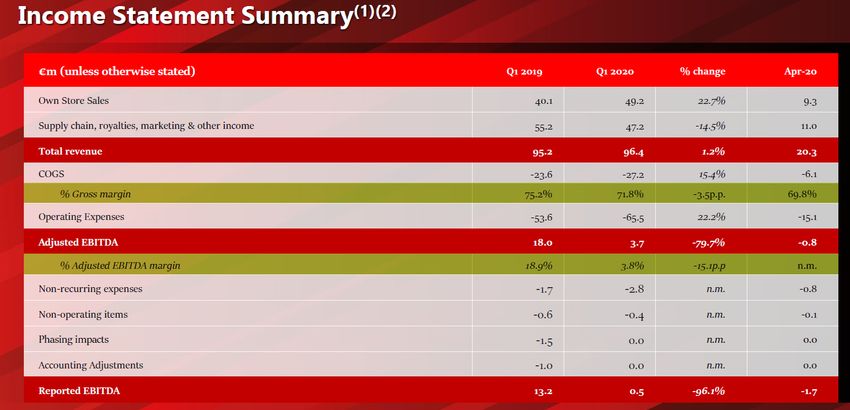
       Income Statement Summary1

         €m (unless otherwise stated)                        3M FY20    3M FY21    % change
         Own Store Sales                                         49.2       42.8    -13.0%
         Supply chain, royalties, marketing & other income       47.1       46.5     -1.2%
         Total revenue                                           96.2       89.3     -7.2%
         COGS                                                   -27.2      -26.6     -2.2%
          % Gross margin                                       71.7%      70.2%      1.5 p.p
         Operating expenses                                     -65.2      -56.7    -13.0%
         Adjusted EBITDA                                          3.8        6.0     56.3%
          % Adjusted EBITDA margin                              4.0%       6.7%     -2.7 p.p
         Non recurring /operating expenses                       -3.3       -5.2      n.m.
         Reported EBITDA                                          0.5        0.8     54.9%

Notes:
1.Financial information excluding impact of IFRS-16.
                                                                                               16
FINANCIAL UPDATE

                     Capital Expenditure1 – 3M FY21

                    (€m)

                                                                                           4.5
                         M&A                                   2.8
                                                                                                                                •   Q1 FY21 Capex of €4.2m with
                         Maintenance                                                                                                main investments focused on
                                                               1.0                7.2                 7.0                           store      maintenance    and
                         Supply Chain                                                     2.2                                       refurbishments       and  the
                                                               1.3                                                                  development of the new digital
Operational Capex

                         Digital & IT                                                                         4.2                   capabilities and upgrading of
                                                                                           0.7                                      the back-office functions
                         Conversions & relocations                                                             1.1
                                                               2.5

                                                                                           2.4                 0.4              •   Store       openings    backend
                         Store Openings                                                                                             towards H2 to be ready for the
                                                               0.9                                                                  expected relaunch of the
                                                                                                               2.2
                         Buybacks                              0.3                         0.6                                      activity after the summer
                                                               0.8                                                        0.2
                                                                                  0.4      0.9        0.1
                         Others                                                                                 0.3       0.1

                                                       3M FY19 (1)                      3M FY20 (1)         3M FY21 (1)

Note:
1.    Capex does not include non cash-out investments (e.g . Non cash Buybacks)
                                                                                                                                                                      17
FINANCIAL UPDATE

   Cash Flow Statement Summary

€m (unless otherwise stated)      3M FY20   3M FY21   % change   €m                  3M FY20        3M FY21

Adjusted EBITDA                     3.8       6.0      56.3%     Cash Balance
Non-recurring / Operating costs    -3.3      -5.2      56.5%     Cash BoP (5)             47.9                45.1
Reported EBITDA                     0.5       0.8      54.9%     Δ Cash                   35.0                26.4
Tax and Others                     -2.6      -3.6      37.0%
                                                                 Cash EoP                 82.8                71.5
Change in Working Capital          16.8      -4.3     -125.8%
Operating Cash Flow                14.7      -7.1     -148.2%          Note:
                                                                       1.      Maintenance capex is recurring capex for existing stores required to
Maintenance Capex (1)              -2.2      -1.1      -51.5%
                                                                               support continued operation
Expansion Capex (2)                -4.8      -3.1      -34.2%          2.      Expansion capex is growth capex associated with i) new store
M&A                                -4.5       0.0     -100.0%                  openings, relocations, refurbishment, ii) IT & digital improvements, iii)
                                                                               investments in factories and iv) other growth initiatives. Excludes non-
Investing Cash Flow                -11.5     -4.2      -63.3%
                                                                               cash out capex (e.g. buybacks)
Cash Flow Available For Debt                                           3.      Cash Flow Available for Debt Service defined as Cash Flow from
                                    3.3      -11.3    -445.8%
Service (CFADS) (3)                                                            Operations less Cash Flow from Investing
Cash Interest                      -14.8     -11.4     -23.2%          4.      Underlying free cash flow is Adjusted EBITDA minus tax and others,
Financing sources                  46.5      49.1                              expansion incentive and maintenance capex
                                                        n.m.
                                                                       5.      Cash position of new perimeter with Tasty Bidco
Financing Cash Flow                31.7      37.7      18.9%

Cash Flow for the period           35.0      26.4      -24.6%
                            (4)
Underlying Free Cash Flow          -0.9       1.4     -245.9%

                                                                                                                                                           18
FINANCIAL UPDATE

      Net Debt and Leverage – 3M FY21

      Capital Structure                                                   428.9                                       -72                                                         Net
                                                                                                                                                                  357          Leverage(2):
                                                                                                                                                                                 11.0x
    Bond Debt:          €335m
    RCF:                 €45m
    ICO Loan:            €40m
    Shareholders Loan: €3m
    Reverse Factoring: €3m
    Chilean Credit Line: €2m

                                                                     Gross Debt                                       Cash                                     Net Debt

                                                              Bond Debt       RCF     Reverse Factoring      Chilean Credit Line      ICO + Shareholders Loan        Cash   Net Debt
    Credit Metrics                                                                      LTM Adjusted EBITDA Metric
                                                    FY 2020     3M FY21                 €m
      Fixed charge Coverage (3)                       1.1x        1.2x                  March, 31,2021 Adjusted EBITDA (1)                             31.8
      Gross Leverage                                 13.2x        13.2x
                     (2)
      Net Leverage                                   11.7x        11.0x

Notes:
1.    Pro forma EBITDA not provided as pro forma adjustments could not be reliably estimated in the current COVID-19 environment
2.    Net Leverage is the ratio between Senior Secured Indebtedness minus cash and cash equivalents and LTM adjusted EBITDA. LTM EBITDA does not include any pro forma on
      acquisitions due to COVID uncertainty
3.    Fixed charge coverage ratio is the ratio between LTM Adjusted EBITDA and Consolidated Interest Expense                                                                                  19
Closing
remarks
Closing remarks

 • Q1 FY21 sales, revenues and EBITDA in line with Company’s target for the period, already
   reflecting the gradual recovery of the business thanks to the progressive release of the
   restrictions and the success of the management actions deployed to cope with the pandemic

 • The completion on the new financing and the revised terms of our alliance with YUM!’ provide
   FDB with a stable and sound financial and commercial framework to capture the opportunities
   that this new environment will bring to our Group

 • Although we still see some uncertainty in the coming months, we restate our confidence to
   deliver the guidance provided for this FY21 of Adjusted EBITDA in the range of €39 to 41m and
   CFADS of -€10 to -€14m

                                                                                                   21
APPENDIX
3M FY21 RESULTS PRESENTATION

       Adjusted LTM Mar-21 EBITDA(1) Reconciliation

       (€m)

                                                                                                                                                      Q2 2020   €3.1m

                                                                            9.0                                                             31.8
                                                                                                      0.5                        2.8
                                                   6.5                                                                                                Q3 2020   €6.7m
                         12.9

                       Reported              Non recurring             Severance                 Board fees               COVID-19
                                                                                                                                       -   Adjusted
                                                                                                                                                      Q4 2020   €16.0m
                        EBITDA                  Costs                  Payments /                                          Related          EBITDA
                                                                      Restructuring
                                                                        Charges                                                                       Q1 2021   €6.0m

Note:
Finantial information excluding impact of IFRS-16 and calculated as per the definition of Consolidated EBITDA in the indenture                                           23
3M FY21 RESULTS PRESENTATION

       Revenues to EBITDA bridge

                       •
                           System Sales                                     Revenues                            COGS          SG&A           EBITDA

                                                                                            %
              LfL Own                                                                      Margin
               Stores                                                                                     Raw Materials,
                                                                            Own Stores                        etc.
                                                                              Sales
                                           Own Stores
                                             Sales

              New Own
               Stores

                                                                              Supply                 3.5%                   Royalties to
                                                                               Sales                Royalties                Pizza Hut2
                 LfL
             Franchised
               Stores
                                            Franchised
                                              Stores                                                                       SG&A and others
                                               Sales
                New
             Franchised                                                                                                     Fees to Pizza
               Stores                                                                                                      Hut and others
                                                        6% Royalties +      Royalty fees
                                                       6% Marketing fee 1
                                                                                                                                             EBITDA

Notes:
1.    Marketing fee expended in full
2.    Net royalty paid reduced due to royalty credit                                                                                                  24
STORE COUNT

       Store Count(1) – 3M FY21

                                                                  Actual                                                             Actual

                                                                   Owned        Franchise                                            Owned    Franchise
                                                  3M FY21                                                                  3M FY21
                                                                   stores         stores                                             stores     stores

                    TELEPIZZA                      1,350            204          1,146                    PIZZA HUT        1,107      317       790
                    EMEA                           1,031            111            920                    EMEA              162        21       141
                      Spain                         697              61            636                     Spain             66        21        45
                                                                                                           Portugal          96         -        96
                      Portugal                      140              50             90
                                                                                                          LATAM EQUITY      411        296      115
                      Ireland                       165               -            165
                                                                                                           Chile             89        78       11
                      Rest of EMEA                   29               -             29
                                                                                                           Colombia          32        32        -
                    LATAM                           319              93            226                     Ecuador           69        67        2
                                                                                                           Mexico           221        119      102
                      Chile                         114              84             30
                      Colombia                       48               9             39
                                                                                                          LATAM MF          534         -       534
                      Ecuador                         -               -              -                     Peru             106         -       106
                                                                                                           El Salvador       62         -       62
                      Rest of Latam                 157               -            157
                                                                                                           Guatemala         54         -       54
                                                                                                           Costa Rica        55         -       55
                                                                                                           Honduras          57         -       57
                                                                                                           Puerto Rico       56         -       56
                                                                                                           Panama            12         -       12
                                                                                                           Rest of Latam     59         -       59
                                                                                                           Caribbean         73         -       73
                                                                                                          TOTAL GROUP      2,457      521     1,936

Notes:
1.    Includes stores within the MF YUM! perimeter plus other geographies (Ireland, Russia, and Angola)                                                   25
GLOSSARY 1/2

  ◼   System sales / chain sales: System sales / chain sales are own store sales             monthly average euro exchange rate of the operating month in the
      plus franchised and master franchised store sales as reported to us by                 most recent period to the comparable operating month of the prior
      the franchisees and master franchisees                                                 period

  ◼   LfL system sales growth: LfL system sales growth is system sales growth         ◼   Reported EBITDA: EBITDA is operating profit plus asset depreciation and
      after adjustment for the effects of changes in scope and the effects of             amortization and other losses, excluding the effect of IFRS 16
      changes in the euro exchange rate as explained below
                                                                                      ◼   Adjusted EBITDA: Adjusted EBITDA is Reported EBITDA adjusted for
      –   Scope adjustment. If a store has been open for the full month, we               costs that are non-operating in nature, non cash adjustments, and non-
          consider that an “operating month” for the store in question; if not,           recurring costs related to; severance payments of restructuring
          that month is not an “operating month” for that store. LfL system               processes, the Pizza Hut alliance, the new corporate structure, the
          sales growth takes into account only variation in a store’s sales for a         refinance and COVID related expenses
          given month if that month was an “operating month” for the store in
          both of the periods being compared. The scope adjustment is the             ◼   Non-operating items: Certain expenses, mainly related to onerous leases
          percentage variation between two periods resulting from dividing (i)            that are non-operating in nature
          the variation between the system sales excluded in each of such
          periods (“excluded system sales”) because they were obtained in             ◼   Non-recurring costs: Extraordinary expenses related to the set-up of the
          operating months that were not operating months in the comparable               Pizza Hut alliance (strategy consulting, legal fees, performance bonuses
          period, by (ii) the prior period’s system sales as adjusted to deduct the       and other expenses), also extraordinary expenses related to the set-up
          excluded system sales of such period (the “adjusted system sales”). In          of new corporate structure (finance consulting, legal fees and other
          this way, we can see the actual changes in system sales between                 expenses), severance payments of restructuring process, non-recurring
          operating stores, removing the impact of changes between the                    COVID related expenses, onerous leases and minor impact related to
          periods that are due to store openings and closures; and                        discontinued operations

      –   Euro exchange rate adjustment. We calculate LfL system sales growth
          on a constant currency basis in order to remove the impact of
          changes between the euro and the currencies in certain countries
          where the Group operates. To make this adjustment, we apply the
                                                                                                                                                                     26
GLOSSARY 2/2

  ◼   Accounting adjustments: It refers to the expense in 2019 for the
      cancellation of a management share-based incentive plan resulting from
      the acceleration of vesting due to the takeover bid

  ◼   Cash Flow Available for Debt Service (“CFADS”): Cash Flow Available for
      Debt Service defined Cash Flow from Operations less Cash Flow from
      Investing

  ◼   Underlying free cash flow: Underlying free cash flow is Adjusted EBITDA
      minus tax and others, expansion incentive and maintenance capex

  ◼   Net debt: Net debt is total outstanding amount of issued senior secured
      notes and bank debt (including the RCF, Chilean credit line, and reverse
      factoring lines) minus cash position at the end of the period

  ◼   Net Leverage: Ratio between Senior Secured Indebtedness minus cash
      and cash equivalents and LTM adjusted EBITDA

  ◼   Maintenance Capex: Maintenance capex is recurring capex for existing
      stores to support their continued operation

  ◼   Expansion Capex: expansion capex is growth capex associated with i) new
      store openings, relocations, refurbishment, ii) IT & digital improvements,
      iii) investments in factories and iv) other growth initiatives

                                                                                   27
You can also read