2020 FULL-YEAR RESULTS - Écully | February 25, 2021
←
→
Page content transcription
If your browser does not render page correctly, please read the page content below
2020 FULL-YEAR
RESULTS
Écully | February 25, 2021

      Follow the webcast of the meeting here or at www.groupeseb.com
2020 FULL-YEAR RESULTS

                 NOTE

                 This presentation may contain certain forward-looking statements regarding Groupe SEB’s activity, results and
                 financial situation. These forecasts are based on assumptions which seem reasonable at this stage, but which depend
                 on external factors including trends in commodity prices, exchange rates, the economic environment, demand in the
                 Group’s large markets and the impact of new product launches by competitors.

                 As a result of these uncertainties, Groupe SEB cannot be held liable for potential variance on its current forecasts,
                 which result from unexpected events or unforeseeable developments.

                 The factors which could considerably influence Groupe SEB’s economic and financial result are presented in the
                 Annual Financial Report and Universal Registration Document filed with the Autorité des Marchés Financiers, the
                 French Financial Markets’ Authority. The balance sheet and income statement included in this press release are
                 excerpted from financial statements consolidated as of December 31, 2020 examined by SEB SA’s Statutory Auditors
                 and approved by the Group’s Board of Directors, dated February 23, 2021.

2   02/25/2021   2020 Full-year results
CONTENTS
1. 2020: a very particular year
2. Strong resilience and solidity of the Group
   in the face of the crisis
3. Projects continued
4. Conclusion and outlook
5. Appendixes
01
2020: A VERY
PARTICULAR YEAR
A generally unprecedented environment

                             ▪ Covid-19: an unprecedented health and economic crisis

                             ▪ Impacts on retail and consumption

                             ▪ Solid momentum in the Small Domestic Equipment market, specifically cooking
                               appliances and Cookware
                                     ➔ Driven by the “stay at home” obligation...
                                     ➔... and the strong acceleration in online sales

                             ▪ Highly impacted Professional Market (HORECA)

                             ▪ Volatile currency and commodity environment

5   02/25/2021   2020 Full-year results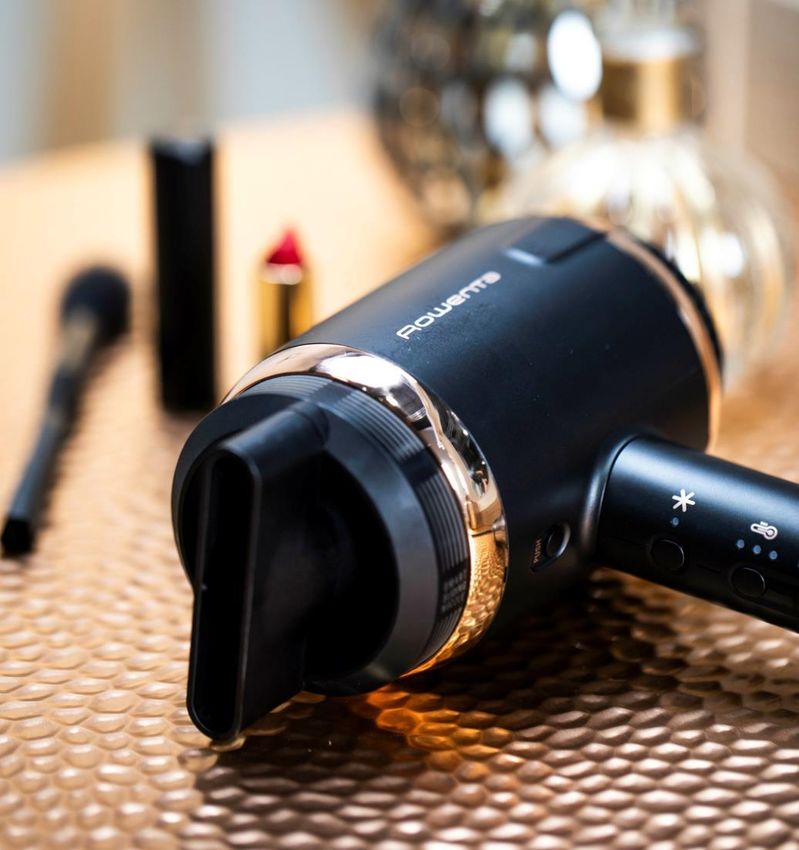
Committed and responsive Groupe SEB teams across the globe

                                                                           Active liquidity
      Priority to employees’                 Business continuity
                                                                                 and                 Projects continued
          health & safety                           ensured
                                                                          cost management

        Widespread health                                                                                Digital First
           measures                                                       New bond issue
                                             Operational flexibility                            Acquisitions and interest taken
           Remote work
                                                                                   c
                                                                       Credit risk management                 c
                                          Acceleration in e-commerce                                Sustainable approach
                                                                           Debt reduction
       Solidarity initiatives                                                                        Product innovation

6   02/25/2021   2020 Full-year results                                                                                    6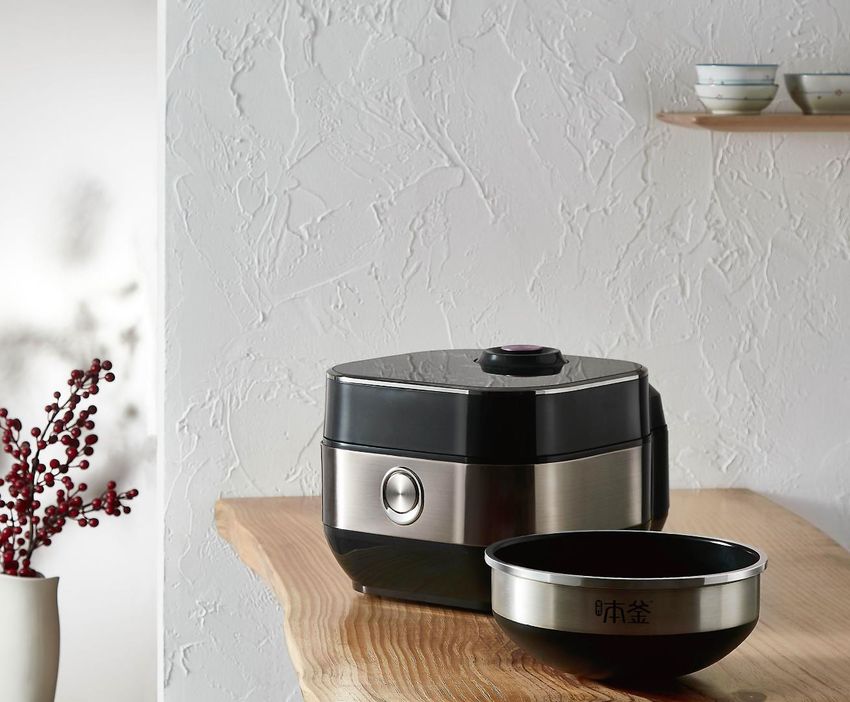
THANK
              YOU

7   02/25/2021   2020 Full-year results
Resilient activity supported by the Consumer business

                                                        Sales
                                                  €6,940m
                                                -5.6%      -3.8% LFL

                   Professional                                         Consumer
                        €575m                                          €6,365m
                 -28.0%            -30.7% LFL                          -2.9%   -0.5% LFL

8   02/25/2021   2020 Full-year results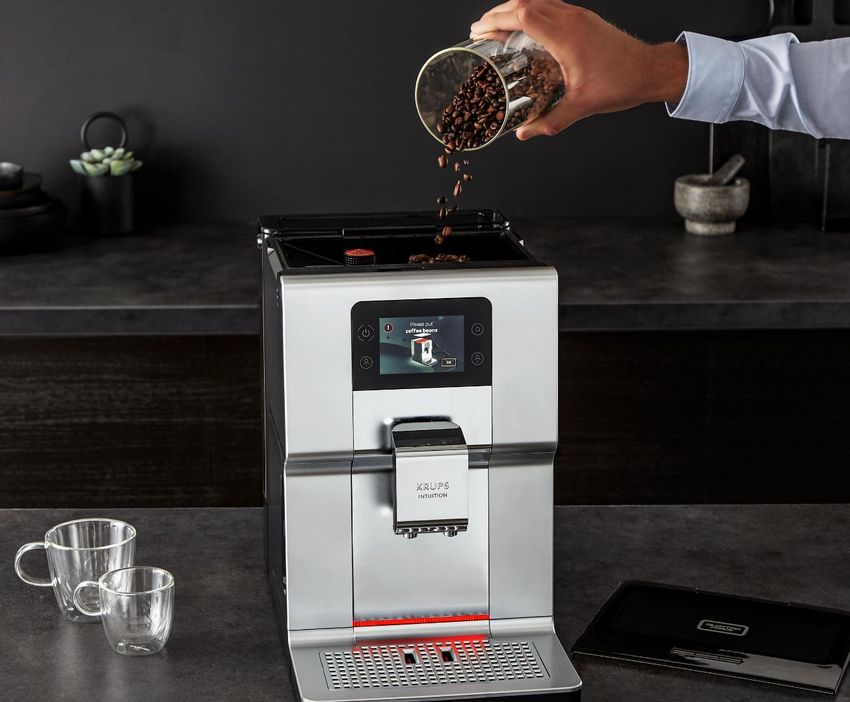
2020 Key figures

                                                         Operational Result
                                                           from Activity
                    Sales                                         €605m                     Net debt
                                                             -18.2%    -4.8% LFL
                 €6,940m                                                                 €1,518m
         -5.6%               -3.8% LFL                                                   -€479m vs. 2019
                                                                  Net profit
                                                                  €301m
                                                                    -20.9%

                                  Dividend proposed at the 2021 AGM                €2.14
                                          in respect of FY 2020                    After free allocation of 1 new share
                                                                                   per 10 existing
9   02/25/2021   2020 Full-year results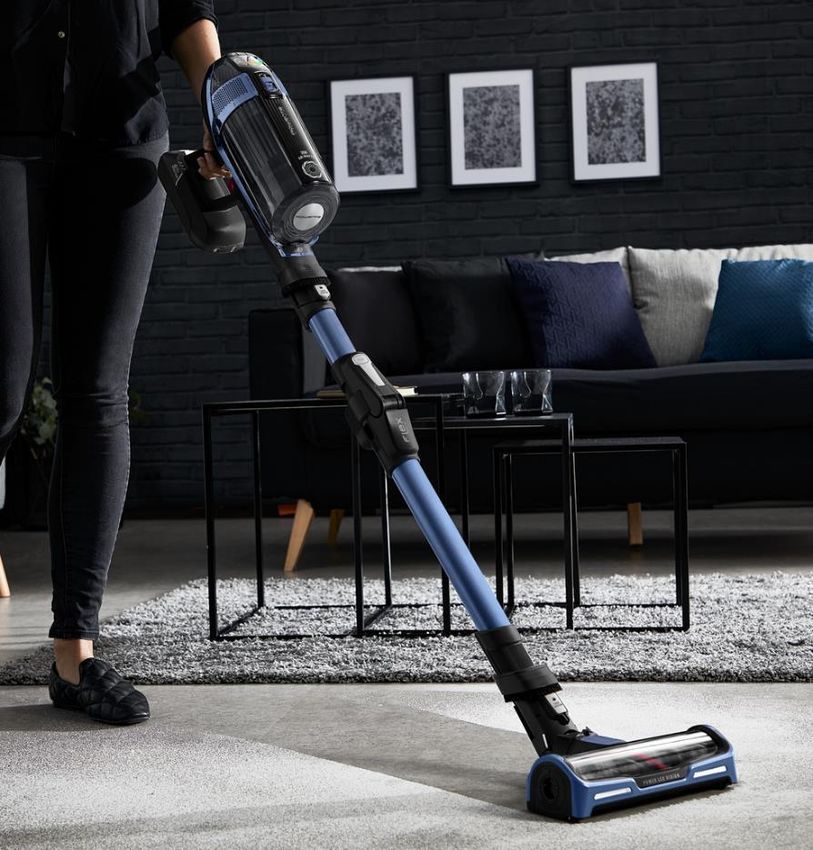
STRONG
        02
RESILIENCE AND
SOLIDITY OF THE
GROUP IN THE FACE
OF THE CRISIS
1 Sales
2 Results
11 02/25/2021 2020 Full-year resultsDevelopment in sales 2019→ 2020
In €m 7,354
-276
-219 6,940
+81*
Organic Currency
growth effect Scope
-3.8% -3.0% +1.2%
-5.6%
2019 2020
*o/w €60m for StoreBound (5-month consolidation)
12 02/25/2021 2020 Full-year resultsCurrency impact on 2020 sales
In €m
0
-10
-20
-€219m
-30 Q1: +€3m
Q2: -€23m
-40 Q3: -€90m
Q4: -€109m
-50
-60
EGP
KRW
CHF
THB
CAD
ARS
UAH
TRY
CNY
RUB
BRL
GBP
MXN
COP
PLN
USD
13 02/25/2021 2020 Full-year resultsVolatile activity, with a brisk H2 performance in the Consumer business
LFL development in sales (% vs. 2019)
10,0% 7.8%
CONSUMER 3.6%
0,0%
-0.5%
PRO -3.8%
-10,0%
-10.6%
-12.6%
GROUP
TOTAL -20,0%
-30,0% -27.6%
-30.7%
-33.8%
-40,0%
% of 2020 sales H1 42% H2 58% FY 100%
14 02/25/2021 2020 Full-year resultsConsumer
15 02/20/2021
02/25/2021 2020 Full-year resultsConsumer sales – LFL
2020 total: €6,365m / -0.5%
AMERICAS EMEA ASIA
€876m/-0.2% €3,307m/+1.5% €2,182m/-3.4%
+ 8.5% + 9.1%
+ 5.2%
-13.3% -9.0% -11.6%
H1 H2 H1 H2 H1 H2
+7.8% sales growth in H2
16 01/21/2021 2020 Full-year resultsWestern Europe
Sales Organic growth
€2,406m -1.5%
+ 5.1 %
- 11.0 %
H1 H2
▪ Good performances in H2, driven by almost all
countries
▪ Solid momentum in all product categories, incl. WMF
▪ Strong acceleration in online sales vs. 2019
17 02/25/2021 2020 Full-year resultsOther EMEA countries
Sales Organic growth
€901m +9.6%
+ 18.6%
-3.4%
H1 H2
▪ Outstanding recovery in sales in H2
▪ Penalizing currency effects, offset in part by price
increases
▪ Momentum largely propelled by e-commerce and the
roll-out of our DTC activities
▪ Performances driven by versatile and robot vacuum
cleaners : 2020 sales +20% LFL
18 02/25/2021 2020 Full-year resultsNorth America
Sales Organic growth
€622m -0.3%
+ 3.7%
-6.9%
H1 H2
▪ Performances fueled by Cookware (T-Fal, All-Clad, Imusa)
▪ Acceleration in e-commerce vs. exclusive offline
distribution
▪ StoreBound integration: annual sales > $120m
19 02/20/2021
02/25/2021 Presentation titleresults
2020 Full-year *Market shareSouth America
Sales Organic growth
€254m +0.1%
+ 17.8%
-23.7%
H1 H2
▪ Strong pick-up in sales in H2, notably driven by :
▪ Stepped-up e-commerce
▪ Good season for fans (growth >+20% LFL)
▪ Robust momentum in electrical cooking appliances
▪ Sales penalized by weakening currencies
20 02/25/2021
02/25/2021 2020
2020Full-Year
Full-yearResults
resultsChina
Sales Organic growth
€1,626m -6.1%
+ 3.5%
-14.4%
H1 H2
▪ Contrasted market between solid momentum in e-
commerce vs. decline in the physical trade
▪ 2020 Cookware sales penalized by the closure of
the Wuhan plant in H1
▪ Small electrical appliance sales driven by food
preparation
21 02/25/2021 2020 Full-year resultsOther Asian countries
Sales Organic growth
€556m +5.2%
+ 10.1%
-0.9%
H1 H2
▪ Good overall performances in the region, particularly
owing to the acceleration in e-commerce
▪ Japan: sales driven by electrical cooking and
Cookware
▪ South Korea: extended offering and product listing
gains
22 02/25/2021 2020 Full-year resultsDevelopment in sales per product line
15,0% 2020 sales
growth, LFL Annual Consumer sales: €6,365m, -0.5% LFL
10,0%
5,0%
Food
Home preparation
0,0% comfort
Electrical
cooking
Personal
-5,0% Home care
care
Beverage Cookware
-10,0%
LKA* Linen care
-15,0%
*Large Kitchen Appliances
23 02/25/2021 2020 Full-year resultsDevelopment in sales per product line
H2 Consumer sales: €3,756m, +7.8% LFL
25,0%
H2 2020
sales growth, LFL
20,0%
15,0% Food
Home
preparation
comfort
10,0%
Home
care Electrical
cooking
5,0% Personal
Cookware care
Beverage
0,0% LKA*
-5,0%
Linen care
-10,0%
*Large Kitchen Appliances
24 02/25/2021 2020 Full-year resultsProfessional
25 02/20/2021
02/25/2021 Presentation titleresults
2020 Full-yearProfessional
Sales Organic growth
€575m -30.7%
-27.6%
-33.8%
H1 H2
▪ Sales down significantly, equipment and
maintenance/service
▪ Unfavorable comparatives in Professional Coffee Machine
(PCM)
▪ HORECA industry severely hit by health restrictions
26 02/25/2021 2020 Full-year results1 Sales
2 Results
27 02/25/2021 2020 Full-year resultsOperating Result from Activity (ORfA)
In €m 2019 2020 Δ Δ LFL
Sales 7,354 6,940 -5.6% -3.8%
ORfA 740 605 -18.2% -4.8%
Op. margin 10.1% 8.7% -1.4 pt
28 02/25/2021 2020 Full-year resultsORfA bridge, 2019 ➔ 2020
In €m
740
-126
705
+23 -109
+9 -1
+60 605
+9
Volumes Price COGS Growth Administrative Currencies Scope
Mix drivers & commercial effect
expenses
2019 2020 2020
LFL
29 02/25/2021 2020 Full-year resultsGrowth drivers
Advertising and marketing
Half-year phasing
In €m 2019 2020 ~+€50m
Innovation 267 240
Advertising
461 472
and marketing
Total growth drivers 728 712
~-€40m
H1-2020 vs. H1-2019 H2-2020 vs. H2-2019
Innovation: gross amount, before French research tax credit and capitalized costs
30 02/25/2021 2020 Full-year resultsOperating profit
2019 2020 Δ%
In €m
ORfA 740 605 -18.2%
Statutory and discretionary employee
-37 -24
profit-sharing
Other operating income and expense -82 -78
Operating profit 621 503 -18.9%
31 02/25/2021 2020 Full-year resultsNet profit
In €m 2019 2020 Δ%
Operating profit 621 503 -18.9%
Financial result -61 -60
Tax -131 -94
Non-controlling interests -49 -48
Net profit 380 301 -20.9%
32 02/25/2021 2020 Full-year resultsSimplified balance sheet
31/12/2019 31/12/2020 Δ €M
In M€
Tangible fixed assets 4,263 4,250 - 13
Operating WCR 1,215 848 - 367
Total capital employed 5,478 5,098 - 380
Equity 2,628 2,735 + 107
Provisions 423 454 + 31
Other current assets and liabilities 430 391 - 39
Net financial debt 1,997* 1,518* - 479
Total financing 5,478 5,098 - 380
*o/w €334m and €339m in IFRS16 impact for 2019 and 2020 respectively
33 02/25/2021 2020 Full-year resultsChange in Operating WCR
2019 2020
€m % Sales €m % Sales
€367m WCR improvement mainly due to:
Receivables 1,017 13.8% 841 12.1% ▪ A change in business model with a retailer in
China
Inventories 1,189 16.2% 1,212 17.4%
▪ Favorable seasonality effects on receivables
and payables
Payables - 991 - 13.5% - 1,205 - 17.3%
▪ Favorable currency effects
WCR 1,215 16.5% 848 12.2%
34 02/25/2021 2020 Full-year resultsCash flow generation/Free cash flow
In €m
+299 -274
Investments
Chg. Operating -194
WCR +69
+246
Tax and Chg. Non
interest operating WCR
and others +752
Amortization/
Statutory and
+605 discretionary
+851
employee profit-
sharing
ORfA Adjusted Free cash flow
EBITDA
35 02/25/2021 2020 Full-year resultsChange in debt
In €m
1,997 Free cash
flow
Currencies
1,518
-752 -17
+101
+189 Dividends
Acquisitions
and other non
operating
Net debt Net debt
end-2019 end-2020
36 02/25/2021 2020 Full-year resultsHealthy and well-balanced financing structure
Confirmed undrawn
credit lines 71
~€1.3bn ▪ Diversified sources of
Cash & equiv.
~€2.4bn financing (Bonds,
Schuldschein, ORNAE, NEU
MTN, NEU CP…)
1,601
▪ No financial covenants
66 52
43
▪ New €500m bond issue,
535
57
539 502 June 2020 (maturing 2025)
50
285
156
▪ Syndicated credit line
2021 2022 2023 2024 2025 2026 and
onwards maturity extended until
Financial debt IFRS 16 debt July 2022
Available liquidity Gross financial debt
~€3.7bn ~€4.0bn
As of 12/31/2020
37 02/25/2021 2020 Full-year resultsFinancial ratios
*excl. IFRS 16
2.8
2.4
2.1
1.9
1.8
1.3
1.2
1.9* 1.6*
1.1
1.0 1.0
0.9
0.7 0.8
0.6
0.5
0.3
0.4
0.3 0.3 0.6
0.1 0.2
10 11 12 13 14 15 16 17 18 19 20
Net debt/Adjusted EBITDA Net debt/Equity
Ratios at 12/31
38 02/25/2021 2020 Full-year results03 PROJECTS CONTINUED
1     Digital First

                            2     Acquisitions and interest
                                  taken

                            3     Sustainable approach

                            4     Product innovation

40   02/25/2021   2020 Full-year results
Digital First
Livestreaming
Virtual launches
DTC
E-commerce brand.com
35% of sales Market places
Digital investments
~60% of media investments
MORE CLOSER
to consumers
DIGITAL
M&A, stakes taken
StoreBound, ChefClub
Chefs
Influencers
41 02/25/2021 2020 Full-year resultsSubstantial e-commerce growth in 2020...
Pure players
Others
Eurasia: 35%, +10 pts
E-Commerce Market places China: 62%, +9 pts
Offline
Mass retail 35% of sales Russia: 40%, +20 pts
65%
+8 pts Click&Mortar Germany, Brazil, Poland:
vs. 2019 +10 pts
Group
retail DTC online
Specialists
Traditional
Groupe SEB
2020 Consumer sales
Group estimates/GfK
42 02/25/2021 2020 Full-year results… bolstered by major online events...
Livestreaming Moulinex, France G6 virtual launch, South Korea
Double 11, China
Livestreaming Krups, France
43 02/25/2021 2020 Full-year results... and an increased presence with our ambassadors: Chefs and influencers
Brazil + 40 countries Atelier De Roxane,
@latelierderoxane, Luderchris,
France @luderchris,
Germany
Alice Trewinnard,
@alicetrewinnard, Elif Tokdemir,
Portugal @eliftokdemir,
Turkey
Czech Republic Australia
Daniel Marin
Thiago Monteiro @dfmartin,
@tiagosworld18, UK
Portugal
44 02/25/2021 2020 Full-year resultsDevelopment of online Direct to Consumer...
~100 online DTC points of sale at end-2020
+30 over the year
45 02/25/2021 2020 Full-year results… via roll-out of brand.com and marketplaces … 46 02/25/2021 2020 Full-year results
… while continuing to leverage our store network

                                             ▪ ~1,300 stores worldwide, o/w 620 excl. China
                            c. 30% of
                            WMF sales
                                                 ➔ 50 openings in 2020 (net, excl. China)

                                             ▪ Home&Cook, WMF, Zahran, Supor Lifestores...
                                             ▪ Around 50 million visitors per year, excl. Supor
GERMANY

                                             ▪ ~6% of Group sales
EGYPT                                                                                                      COLOMBIA
                         +6 stores in
                         2020                                                                                         10% of sales
                                                           THAILAND                               NORWAY

  47   02/25/2021   2020 Full-year results
1 Digital First
2 Acquisitions and interest
taken
3 Sustainable approach
4 Products innovation
48 02/25/2021 2020 Full-year resultsOpening-up to new business models (1/2)
SEB Alliance investment
▪ Leader in the production and distribution of cooking content
▪ Online recipes with communities, multiplatform
▪ Wide geographic coverage: Europe, US, China
▪ Launch in H1 2021 of a range of products under the
"Chefclub by Tefal" brand license
Key figures
FoodTech brand reporting the strongest growth in 2020 worldwide on
social media
1.6bn monthly views in December and January
700,000 books sold
49 02/25/2021 2020 Full-year resultsOpening-up to new business models (2/2)…
Majority stake in StoreBound
Unrivaled know-how in digital marketing
▪ Expertise in community management
➔ Product development
➔ Marketing
▪ Priority to the consumer experience
Key figures
> 1 million Instagram followers
Important partnerships (brands, chefs, influencers…)
➔ Between 500,000 and 20m followers
2015-2020 sales: from ~ 25 M to > $120m ➔ CAGR > 35%
50 02/25/2021 2020 Full-year results... and exploring new consumer needs
Micro-filtered water fountains for
companies and restaurants + reusable New-generation electrically-assisted
containers bike
No distance to cover between the Exclusive industrial partnership with
source and the place of consumption Angell Bike ➔ Industrialization and
and no plastic waste generated production in Is-sur-Tille, France
Castalie Angell
51 02/25/2021 2020 Full-year results1 Digital First
2 Acquisitions and interest
taken
3 Sustainable approach
4 Products innovation
52 02/25/2021 2020 Full-year resultsContinuing our responsible approach in 2020 (1/2)
Launch in France in 2020, roll-out in
Professional insertion workshop in
other European countries as of 2021
Paris
Repair packages at a much lower cost
Repair of Small electrical appliances
than product replacement (< 40%)
Appliance rental service
Support from our network of repairers
Repair packages RépareSeb
53 02/25/2021 2020 Full-year resultsContinuing our responsible approach in 2020 (2/2)
6 sites equipped with solar panels:
Development of the Good Design Campus Ecully, Is-sur-Tille and Pont-Evêque
(France), Netherlands’ market company,
Playbook with APF France Handicap
Montebello (USA) and Rionegro (Colombia)
since 2020
Launch of a dedicated breakfast range:
Includeo Other projects being under study in
France, China, Egypt or Vietnam
Inclusive design Renewable energies
54 02/25/2021 2020 Full-year results1 Digital First
2 Acquisitions and interest
taken
3 Sustainable approach
4 Product innovation
55 02/25/2021 2020 Full-year resultsA product offering constantly adapted to meet new needs (1/3)
Innovations in Professional Coffee
WMF Expresso roll-out MyAppCafé coffee station
at McDonald’s robot barista
Schaerer Soul
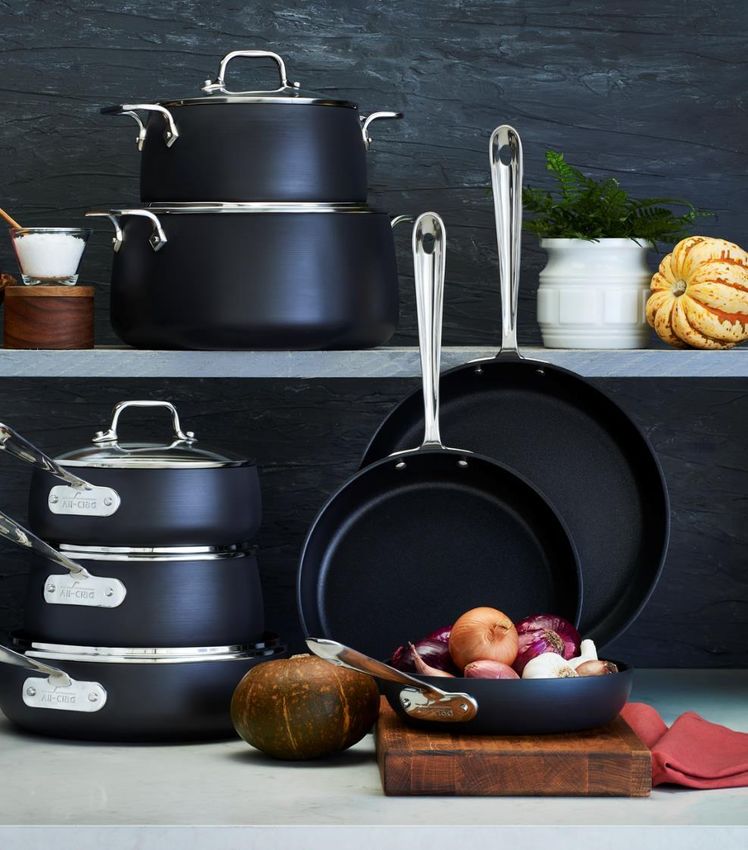
56 02/25/2021 2020 Full-year resultsA product offering constantly adapted to meet new needs (2/3)
Innovations in Small Domestic Equipment ➔ Home-made cooking
connected
Cookeo Touch & Icompanion XL Touch Easy Fry Arno New pan in South Korea
Kitchen Chef Supor & Steam Tender Fried Air Fryer
Nespresso Atelier Krups Silent Hi-Speed Blender Supor
57 02/25/2021 2020 Full-year resultsA product offering constantly adapted to meet new needs (3/3)
Innovations in Small Domestic Equipment ➔ Healthy home
connected
CUBE Robot X-PLORER SERIE 95
connected
Rowenta Xforce vacuum cleaner
(new generation)
Clean & Steam, latest génération
INTENSE PURE AIR Connect Rowenta
58 02/25/2021 2020 Full-year results04 CONCLUSION & OUTLOOK
2020: strong resilience and solidity of the Group in the face of the crisis

                               ▪ Fast adaptation and reaction to the economic context

                               ▪ Continuation/acceleration in long-term structural projects

                               ➔ Relevance of our business model, focused on the long term

60   02/25/2021     2020 Full-year results
2021: overall environment remains uncertain
▪ Health conditions still unstable
➔ Restrictions of movement effective in many countries
➔ Very difficult situation for the HORECA industry, mostly “closed”
▪ Starting vaccination campaigns
▪ A currency environment which could remain volatile in 2021
▪ High prices for commodities and freight in early 2021
▪ A context expected to remain favorable for e-commerce/digital
61 02/25/2021 2020 Full-year resultsOutlook: cautious optimism for 2021
▪ Still limited visibility
▪ Solid start to the year for the Consumer business
➔ Sustained demand, in line with H2-2020
➔ New product launches, strong advertising & marketing activation, stepped-up e-commerce
➔ Favorable comparable basis
▪ Assumption of a gradual return to normal of the Professional business as of H2-2021
▪ Expected penalizing currency, commodity and freight effects in H1
▪ 2021 objectives
➔ Return to organic sales growth
➔ Increase in Operating Result from Activity
62 02/25/2021 2020 Full-year results05 APPENDIXES
Free allocation of shares
                  Decision of the Board of Directors of February 23, 2021

                    ▪ Free allocation of ONE new share for TEN existing shares
                        ▪ To all shareholders registered on March 2, 2021
                    ▪ Share capital increase on March 3, 2021 through the incorporation of reserves and/or retained
                      earnings
                        ▪ Creation of 5,030,706 new shares with a par value of €1 each
                        ▪ Capital increased to €55,337,770
                    ▪ Attribution right detached on March 1, 2021 (opening of the Paris-Euronext stock exchange)
                        ▪ Corresponding adjustment of the share price
                    ▪ Newly issued shares with the same specifications and rights as those from which they are
                      derived
                    ▪ Effective date: January 1, 2020
                        ▪ Right to dividend in respect of 2020 financial year, paid in 2021

64   02/25/2021     2020 Full-year results                     This free share allocation will be the subject of a detailed Euronext release as of Feb 25, 2021
Recognized extra-financial performance
**
Joined A* list Industry leader “Prime” status
Score of 4.4/5 and +11 pts in 3 years
member of the index
32 pts vs. company
industry average
*CDP: Carbon Disclosure Project
**Entity of Ethifinance agency
65 02/25/2021 2020 Full-year resultsBreakdown of 2020 sales by region
Other Asian countries
9%
Western
Europe
39%
China
24% €6,940m
-3.8% LFL
South America
4%
Other countries
EMEA
North America 13%
11%
66 02/25/2021 2020 Full-year resultsTop 20 countries
TOP 10 COUNTRIES
FRANCE RUSSIA Colombia USA
Poland JAPAN Ukraine Turkey South Korea
BRAZIL Mexico CHINA Canada ITALY Belgium
Austria NETHERLANDS United Kingdom GERMANY SPAIN
Consumer sales LFL
67 02/25/2021 2020 Full-year results2020 sales by region
In €m Q4 2020
2019 2020 As reported 2020 LFL
LFL
EMEA 3,339 3,307 -1.0% +1.5% +7.0%
Western Europe 2,442 2,406 -1.5% -1.5% +2.5%
Other countries 897 901 +0.4% +9.6% +19.7%
AMERICAS 915 876 -4.2% -0.2% +6.3%
North America 589 622 +5.7% -0.3% -0.8%
South America 326 254 -22.1% +0.1% +20.4%
ASIA 2,301 2,182 -5.2% -3.4% +4.5%
China 1,762 1,626 -7.7% -6.1% +3.1%
Other countries 539 556 +3.2% +5.2% +8.3%
TOTAL Consumer 6,555 6,365 -2.9% -0.5% +6.2%
Professional 799 575 -28.0% -30.7% -28.5%
Groupe SEB 7,354 6,940 -5.6% -3.8% +2.9%
% based on non-rounded figures
68 02/25/2021 2020 Full-year results2020 quarterly sales
In €m Q1.. Q2 H1 Q3 9m Q4 2020
EMEA 641 631 1,272 846 2,118 1,189 3,307
Western Europe 445* 475* 920* 610* 1,530* 876 2,406
Other countries 196* 156* 352* 236* 588* 313 901
AMERICAS 149 149 298 286 584 292 876
North America 97 112 209 208 417 206 622
South America 52 37 89 78 167 86 254
ASIA 482 556 1,039 543 1,582 600 2,182
China 365 429 794 401 1,196 430 1,626
Other countries 117 127 245 142 386 170 556
TOTAL Consumer 1,272 1,336 2,608 1,675 4,284 2,081 6,365
Professional 182 124 306 122 428 147 575
Groupe SEB 1,454 1,460 2,914 1,797 4,712 2,228 6,940
* Including reclassifications, not material
69 02/25/2021 2020 Full-year resultsGlossary
On a like-for-like basis (LFL) – Organic
The amounts and growth rates at constant exchange rates and consolidation scope in a given year compared with the previous year are calculated:
• using the average exchange rates of the previous year for the period in consideration (year, half-year, quarter);
• on the basis of the scope of consolidation of the previous year.
This calculation is made primarily for sales and Operating Result from Activity.
Operating Result from Activity (ORfA)
Operating Result from Activity (ORfA) is Groupe SEB’s main performance indicator. It corresponds to sales minus operating expenses, i.e. the cost of sales, innovation
expenditure (R&D, strategic marketing and design), advertising, operational marketing as well as sales and marketing expenses. ORfA does not include discretionary
and non-discretionary profit-sharing or other non-recurring operating income and expense.
Adjusted EBITDA
Adjusted EBITDA is equal to Operating Result from Activity minus discretionary and non-discretionary profit-sharing, to which are added operating depreciation and
amortization.
Free cash flow
Free cash flow corresponds to adjusted EBTIDA, after considering changes in operating working capital, recurring capital expenditures (CAPEX), taxes and financial
expenses, and other non-operating items.
Net financial debt
This term refers to all recurring and non-recurring financial debt minus cash and cash equivalents, as well as derivative instruments linked to Group financing. It also
includes debt from application of the IFRS 16 standard “Leases” in addition to short-term investments with no risk of a substantial change in value but with maturities of
over three months.
Loyalty program (LP)
These programs, run by distribution retailers, consist in offering promotional offers on a product category to loyal consumers who have made a series of purchases
within a short period of time. These promotional programs allow distributors to boost footfall in their stores and our consumers to access our products at more attractive
prices.
.
70 02/25/2021 2020 Full-year resultsInvestor/Analyst relations Media Relations
Groupe SEB Groupe SEB
Financial Communication Corporate Communication Dept
and Investor Relations Dpt
C O N TA C T S
Cathy Pianon
Isabelle Posth Anissa Djaadi
Raphaël Hoffstetter
cpianon@groupeseb.com
iposth@groupeseb.com adjaadi@groupeseb.com
rhoffstetter@groupeseb.com
Phone: + 33 (0) 6 33 13 02 00
Phone: +33 (0) 4 72 18 16 04
Phone: + 33 (0) 6 88 20 90 88
comfin@groupeseb.com
Image Sept
Caroline Simon
Claire Doligez
Isabelle Dunoyer de Segonzac
www.groupeseb.com caroline.simon@image7.fr
cdoligez@image7.fr
isegonzac@image7.fr
Phone:+33 (0) 1 53 70 74 48
71 02/25/2021 2020 Full-year results2021 key dates
AGENDA
April 22 | after market closes Q1 2021 sales and financial data
May 20 | 3:00 p.m. Annual general meeting
July 23 | before market opens H1 2021 sales and results
October 26 | after market closes Nine-month 2021 sales and financial data
72 02/25/2021 2020 Full-year resultsYou can also read