Full Year 2014 Results - 19 February 2015

Page created by Wallace Chen
 
CONTINUE READING
Full Year 2014 Results - 19 February 2015
Full Year
2014 Results
19 February 2015
Full Year 2014 Results - 19 February 2015
Highlights of the Full Year 2014

        Operating environment                        Air France-KLM

   Weak economic environment                Unit cost reduction delivered
                                              as planned
   Significant currency volatility
                                             Roll-out of upgraded products
   Fuel price stable in first 9 months
    followed by large drop                   Transavia passengers up 26%
                                              in France
   Second Half impacted by industry
    overcapacity on certain long-haul        EBITDA up €159 million excluding
    routes                                    pilot strike impact
                                             Net debt stable, affected by pilot
                                              strike and Venezuela
                                             Launch of new strategic plan,
                                              Perform 2020

                                                            Full Year 2014 results   2
Full Year 2014 Results - 19 February 2015
Key data

 In € millions                                 Q4 2014        Q4 2013(1)            Change          FY 2014   FY 2013(1)    Change

 Revenues                                         6,212             6,123             +1.5%        24,912      25,520        -2.4%   
 Change like-for-like(3)                                                              -0.5%                                 +0.3%    
 EBITDA(2)                                           316               382            -66m          1,589       1,855      -266m     
 EBITDA excluding strike                             411               382            +29m          2,014       1,855      +159m 

 Change like-for-like(3)                                                                 -6m                                +216m    
 Operating result                                  -169                -63           -106m           -129         130      -259m     
 Operating result excl. strike                       -74               -63            -11m            296         130      +166m 

 Change like-for-like(3)                                                                 +6m                                +275m    
 Net result, group share                             316           -1,176        +1,492m             -198       -1,827    +1,629m    
 Adjusted net result(2)                            -304               -149           -155m           -535         -463      -72m     
 ROCE excluding strike(2)                                                                             5.1%        2.9%     +2.2 pts   
 Operating free cash flow(2)                                                                          -164         530      -694m     
 Net debt at end of period                                                                           5,407       5,348       +59m     
             (1) 2013 restated for IFRIC 21, CityJet reclassified as discontinued operation
             (2) See definition in press release
             (3) Like-for-like: excluding currency, pilot strike impact and Q4 one-offs. Same            Full Year 2014 results       3
                 definition applies in rest of presentation unless otherwise stated
Full Year 2014 Results - 19 February 2015
Significant currency impact on operating result

             Currency impact on revenues                      Revenues and costs per currency
                    and costs (€m)                                             (FY 2014)

                                              -65         Revenues

                                                   +163

                                             +98
                                                                       Other                     US dollar
                                                                                           25%   (and related
                                                                  currencies
                                                                                                 currencies)

                                     -44
          -94                  -90
   -120
                        -147     -46
                 -168
       -26                                                Costs
                   -21
   Q1 2014       Q2 2014       Q3 2014       Q4 2014

                                                                       Other
                                                                  currencies               42%   US dollar
       Currency impact on revenues                                   (mainly
                                                                       euro)
       Currency impact on costs, including hedging

 -xx   Currency impact on operating result

                                                                                Full Year 2014 results          4
Full Year 2014 Results - 19 February 2015
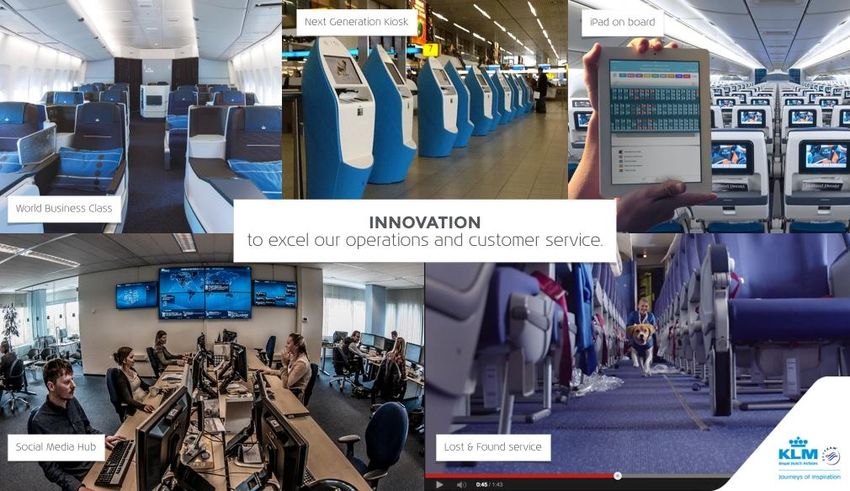
Contribution by business segment to Full Year 2014 results

                                      Reported     Change                         Reported     Change
                            Revenue    change    Like-for-like       Op. result    change    Like-for-like
                             (€bn)       (%)         (%)               (€m)         (€m)         (€m)

      Passenger    78%
                            19.57     -2.7%       +0.3%                -83        -257      +208        
         Cargo
                  9%
                             2.68     -4.8%       -2.4%              -212           -10       +33       
   Maintenance
                       5%    1.25     +2.1%       +3.5%               174          +15        +42       
          Other
                       8%
                             1.41     +3.1%       +3.0%                  -8          -7           -8   
                  Total     24.91     -2.4%       +0.3%              -129         -259      +275       

                                                                          Full Year 2014 results             5
Full Year 2014 Results - 19 February 2015
Passenger activity

                                                                                                          Activity
   Activity strongly affected by pilot                                      Capacity (ASK)                           -0.6%
    strike                                                                   Load factor
                                                                                                    83.8%            +0.9 pt         84.7%
        Capacity up 1.0% excluding strike

   Full Year unit revenue down 0.6%                                         Traffic (RPK)
                                                                                                                      +0.5%

    like-for-like
        Second Half unit revenue impacted
         by industry overcapacity on certain
         parts of the long-haul network                                                           FY 2013                          FY 2014
        Positive trend in premium cabins
                                                                                             Unit revenue                        Unit cost
             Premium: +3.0%*
             Economy: -0.9%*                                                        RRPK                    RASK                  CASK
        Positive impact of capacity reduction
         on medium-haul
                                                                                                                 -0.9%
                                                                                                                      -0.6%    -0.7% -0.3%

   Operating result up like-for-like                                            -3.1%
                                                                                         -1.9%           -2.0%                           -1.7%

    thanks to strong unit cost
                                                                                         Reported                At constant currency
    reduction delivery
                                                                                         Like-for-like

                                                                                                         Full Year 2014 results              6
              * Q4 one-offs taken at central level, no allocation by cabin
Full Year 2014 Results - 19 February 2015
Passenger capacity and unit revenue per quarter

              2012    Q1 2013   Q2 2013   Q3 2013   Q4 2013   Q1 2014   Q2 2014      Q3 2014   Q4 2014

                                +2,7%
                                          +1,6%     +1,8%     +1,3%                  +1,6%
              +0,6%                                                      +1,0%
                      +0,3%
Capacity
                                                                                               -0.2%
                                                                  Like-for-like

              +3,2%                       +2,7%
                      +1,3%                                              +1,3%                 +1,0%
                                                    +0,0%
  RASK
ex-currency
                                -1,3%                         -0.7%                             -1.1%
                                                                                      -1.8%

                                     +0.8%                                        -0.6%

                                                                  Like-for-like

                                                                           Full Year 2014 results        7
Full Year 2014 Results - 19 February 2015
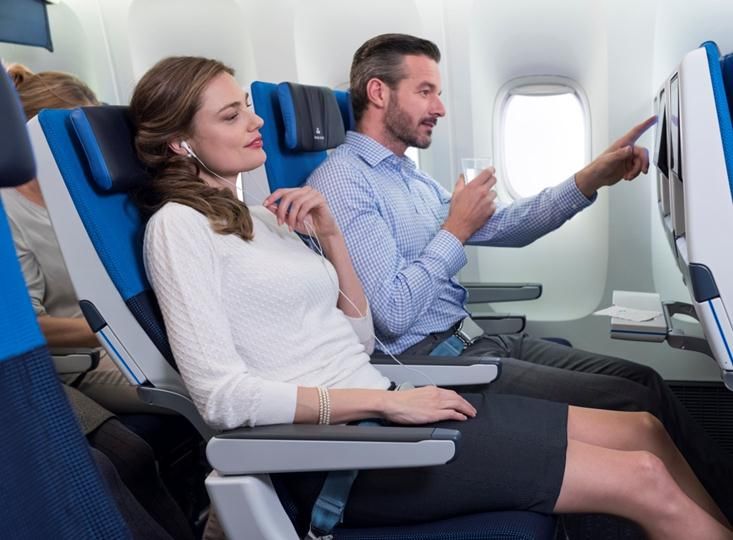
Full Year passenger unit revenue by network
Like-for-like
                                                       Medium-haul point-to-point

                                                                                           Total medium-haul
                                                        -12.8%       -9.5%      7.5%
                                                         ASK          RPK       RASK

                                                                                       -1.3%     1.3%     1.6%
           North America                                     Medium-haul hubs
                                                                                        ASK      RPK      RASK

    2.9%          2.6%         1.0%                      2.6%            4.4%   0.1%
    ASK           RPK          RASK                      ASK             RPK    RASK

            Latin America                                 Africa and Middle East                 Asia

    7.0%           5.6%        -6.2%                     -0.1%           0.8%   1.0%   -0.4%     0.9%     -0.5%
    ASK            RPK         RASK                       ASK            RPK    RASK    ASK      RPK      RASK

           Total long-haul                             Caribbean & Indian Ocean                 Total

    1.6%           2.3%        -0.3%                     -0.5%           2.4%   2.3%   1.0%      2.1%     -0.6%
    ASK            RPK         RASK                       ASK            RPK    RASK   ASK       RPK      RASK

                                                                                       Full Year 2014 results     8
           Q4 one-offs taken at central level, no allocation by region
Full Year 2014 Results - 19 February 2015
Cargo activity

                                                                          Activity
   Activity strongly affected
                                               Capacity (ATK)                         -2.3%
    by pilot strike
        Capacity down 0.9% excluding strike   Load factor                            -0.1 pt
                                                                    63.2%                            63.1%

   Full freighter capacity further            Traffic (RTK)                          -2.4%

    reduced by 7.8%
   Persistently weak demand                                      FY 2013                          FY 2014
        RATK -0.9% like-for-like

   Operating income up €33m                                   Unit revenue                      Unit cost
    like-for-like thanks to good                        RRTK                 RATK                  CATK
    performance on unit costs
                                                                                      -0.9%          -0.9%-1.9%
                                                         -1.1%                -1.2%             -1.3%
                                                    -1.8%                -2.0%
     Perform 2020: accelerated
      phase-out of 9 full-freighters                     Reported             At constant currency
                                                         Like-for-like

                                                                         Full Year 2014 results              9
Full Year 2014 Results - 19 February 2015
Maintenance activity

                                                                             Order book
   Third party revenue: +3.5% like-
    for-like                                                                      +28%
                                                                                                 €5.6bn
                                                                    €4.4bn
        Revenue pick up as expected
         in Second Half

   Dollar strength now supporting
    revenue and profitability
                                                                   31 Dec 2013              31 Dec 2014
   Increase in operating result
    and margin
        As a result of ongoing development                                                                Like-for-
                                                   In € millions                 FY 14   FY 13 Change         Like
         of higher margin activities
        Despite pilot strike impact on internal    Total revenue                3,392   3,280    +3.4%
         revenue and operating result
                                                    Third party revenue 1,251            1,225    +2.1%     +3.5%

                 Perform 2020:                     Operating result             174     159       +15       +42

              further development                   Operating margin             5.1%    4.8%     +0.3pt   +1.1pt

                                                                             Full Year 2014 results             10
Other businesses: strong development of Transavia

                                                       Transavia activity
   10 million passengers            Capacity (ASK)                    +8.3%
                                     Load factor                                        89.8%
                                                          90.0%
   Revenues surpassing €1 billion                                    -0.2 pt

   Load factor stable at almost     Traffic (RPK)                     +8.0%
    90%
   Accelerated ramp-up in France
                                                        FY 2013                        FY 2014
    on track
        Capacity up 21%
        Passengers up by 23%          In € millions                FY 14   FY 13        Change

                                       Total revenue                1,056       984        +7.3%
   Ongoing shift to LCC model
                                       RRPK (€ cts per RPK)          5.50       5.53       -0.5%
    in the Netherlands
                                       RASK (€ cts per ASK)          4.94       4.98       -0.7%
        Scheduled capacity up 12%
                                       CASK (€ cts per ASK)          5.11       5.09       +0.3%
        Charter capacity down 4%
                                       Operating result               -36        -23            -13

                                                              Full Year 2014 results            11
Full Year 2014: Change in operating costs

                                                                                                                 Change
                                                                                                     Reported   at constant     Like-for
                                                                                         €m           change     currency         -like

        Total employee costs including temps                                        7,510              -1.9%       -1.9%
  30%

 25%    Supplier costs(1) excluding fuel and                                        6,301             +0.7%       +1.3%
        purchasing of maintenance services and parts

 12%
        Aircraft costs(2)                                                           3,029              -2.1%       -1.4%

        Purchasing of maintenance services
  5%                                                                                1,356             +4.1%       +4.6%
        and parts
        Operating costs ex-fuel(3)                                                18,412              -0.4%       -0.2%          -0.5%

  26%   Fuel                                                                        6,629              -3.9%       -2.9%          -1.5%

        Grand total of operating costs                                            25,041              -1.4%       -0.9%          -0.8%
        Capacity (EASK)                                                                                             -0.3%         +1.2%

        (1) Catering, handling, commercial and distribution charges, landing fees and air-route
            charges, other external expenses, excluding temps
        (2) Chartering (capacity purchases), aircraft operating leases, amortization, depreciation
            and provisions                                                                             Full Year 2014 results        12
        (3) Including other taxes, other revenues, other income and expenses
Systematic fuel hedging

                  Percentage of fuel consumption already hedged
                                   (Picture at 9 February 2015)

      64%       66%
                          61%
                                   57%

                                              42%

                                                           31%
                                                                   22%

                                                                            10%

      Q1         Q2       Q3           Q4      Q1           Q2     Q3        Q4        Q1

                  2015: 62%                                  2016: 27%                2017

            2015 portfolio based on:
             93% Brent, 7% jet fuel

                                                                         Full Year 2014 results   13
Update on 2015 fuel bill

                                                   Fuel bill after hedging
                                                               (in billion dollars)
2014:    fuel bill $8.9bn /
         €6.6bn                               8.9                                                                                          2014
2015:    fuel bill $7.4bn /
                                                                                                                                           2015
         €6.3bn(2)                                  7.4  (1)
                                                                           $74/bbl                  7.5
                                                                           $68/bbl                  7.4
                                                                           $62/bbl                  7.4
                                                                           $55/bbl                  7.3
                                                                           $49/bbl                  7.2

                                                                                                      2.3             2.4            2.2
                                                                                      2.1                   1.9(1)          2.0(1)
                                                                                            1.7
                                                                                              (1)
                                                                                                                                            1.7(1)

                                                FY
                                             Jan-Dec                                    Q1                Q2            Q3             Q4

MARKET                Brent ($ per bbl)(1)        62                                    56                61            64             66
PRICE
          Jet fuel ($ per metric ton)(1)         605                                    574               602           616            629
 % of consumption already hedged                 62%                                   64%                66%           61%           57%

           (1) Based on forward curve at 9 February 2015 . Sensitivity computation based on
               February-December 2015 fuel price, assuming constant crack spread between
               Brent and Jet Fuel                                                                               Full Year 2014 results               14
           (2) Assuming exchange rate of 1.15 US dollar per euro
Update on employee costs

                                                                          Change in total employee costs
   Average headcount reduction                                                    (€m, including temporary staff)

    in 2014: -1,550 FTEs
    100,300          100,200           99,500
                           98,400           98,800        97,500
         97,100                                                 97,100                   Net
                                                                                       change
                                                                         7,655          -1.6%
                                                                                                                     7,510
                                                                                         -119           -26
        Q1                Q2                Q3                Q4
              2013        2014                  2014 activity in EASK*                                Pension
                                                                                                     expense,
                                                                                                   consolidation
   General pay freeze                                                                              impact and
                                                                                                       strike
    at both Air France and KLM
   Slower reduction employee
    costs in Second Half,
    in line with plan                                                    FY 2013                                     FY 2014

                                                                                           Full Year 2014 results            15
              * Excluding pilot strike impact
Well covered pension liabilities in spite of large impact from
falling discount rate
 Evolution of net pension balance sheet situation, in million euros

                                                  Change in       Change in
                                                 Dutch fiscal     actuarial
                              Regular             regulation     assumptions
                              evolution
                           of net pension            +824
          +601                situation

                                 +124

                           Cash out:       482

  Liabilities:   €16.6bn
                           - P&L expense: -388                        -3,837
                           - other:        +30
  Assets:        €17.2bn
                                                                                                        -710
                                                                                     +1,578       Liabilities: €20.1bn
                                                                                                    Assets: €19.4bn

                                                                Main discount rate   Change
                                                                  revised down       in asset
      Dec 2013                                                      ~130 bps                        Dec 2014
                                                                                      value

                                                                                         Full Year 2014 results          16
Expected impact on 2015 P&L

   Fall in discount rate leads                            Pension P&L expense
                                                              and cash out
    to significant increase in P&L                                      (€m)
    pension cost
   Cash outflow is determined                           454
                                                                               482
                                               429                431
    independently
                                                                                        Additional P&L
   Multiple impacts of new                                       379          388
                                                                                        expense
                                                         359
    Dutch fiscal regulation
       Reduction of cost of existing scheme
       Compensation for higher employee       206
        contributions under negotiation
   Net negative P&L impact of
    ~€100m (no additional cash out)            2011     2012     2013          2014   2015

   Pensions are part of the current                                IAS 19R
    Collective Labor Agreement                       Pension P&L expense
    negotiations                                     Pension cash out

                                                                  Full Year 2014 results        17
Full Year 2014: Further reduction in unit costs

 Net Costs: € 22,334m (-1.3%); excluding impact of pilot strike: €22,404m
 Capacity in EASK: 332,602m (-0.3%) ; excluding impact of pilot strike: 337,352m (+1.2%)
 Unit cost per Equivalent Available-Seat Kilometer (EASK): €6.71 cents ; excluding impact of pilot strike: €6.64 cents

                                 Net change                               Change
        Net change               Excluding change                   at constant currency,
                                                                                                             Reported
      Excluding Q4 one-offs     in pension expense                 excluding strike impact                    change

                                                                                                   Strike
                                                                                                  Impact
                                                +0.0%                                             1.1%

                                                Change                                                         -1.1%
                                    -1.1 %
                                               in pension
           -1.3 % -+0.2%                        expense
                     Q4 one-offs                (non cash)
                                                             --0.7%       -1.8%
                                                             Fuel price
                                                               effect                  -0.4%
                                                                                      Currency
                                                                                       effect

                                                                                             Full Year 2014 results      18
Results impacted by strike, currency and unit revenue weakness

 Operating result, in million euros

                                                                                     Unit      Change
                                                                                              in pension       Q4
                                                                                     cost
                                                                                               expense       One- offs        +296
                                                                                     +304     (non cash)

                                                                                                 -9            +48
                  Currency                                                                                                            Strike
    +130           Impact                                                                                  Revenues: +100      425   impact
                                                                                                             Costs: -52

                                    Activity          Unit
                                    change          revenue

                                      +0
                     -158
                                                                                     CEASK:
               Revenues: -279                                                         -1.3%
                 Costs: -121
                                                                                                                              -129
                                                                                                                         Reported operating
                                                     -180             +160                                                     result

                                                                    Fuel price
                                                     REASK:        ex-currency
                                                      -0.8%
  FY 2013*                                                                                                                  FY 2014

           * Restated for IFRIC 21, CityJet reclassified as discontinued operation                     Full Year 2014 results                  19
Full Year operating free cash flow

 Analysis of change in net debt, Full Year 2014, in million euros

                                    Operating free cash flow*: -164
                                                       (FY 2013: +530)
                                                                                            Gross
                                                                                         Investments
                                                                                            -1,360
                                                                                       (FY 2013: -1,064)
                             Cash flow                                                       Sale &
                            before VDP,                                                    Lease-Back
                           and change                                                        +198              +105
                              In WCR
                                                                                                                                  5,407
          5,348          (FY 2013**: 1,311)
                                                                                                                Other
                                                                                                                including
                                                                                                                 provision
                                                                                               Net
                                                                                                              on cash held
                                                                                           investments
                                                                                                           in Venezuela and
                                                                                            -1,162              Amadeus
                              +1,039             Voluntary                                                     transaction
                                                 Departure            Change
                                                    Plans              in WCR
                                               (FY 2013: -183)     (FY 2013: +343)

                                                    -154                +113

        Net debt at                                                                                                               Net debt at
    31 December 2013                                                                                                          31 December 2014

            *  Net cash flow from operating activities less net capex on tangibles and intangibles.
               All amounts excluding discontinued operations. See definition in press release              Full Year 2014 results                20
            ** 2013 restated for IFRIC 21, CityJet reclassified as discontinued operation
EBITDA and operating cash flow per airline

                           EBITDA                                                          EBITDA margin
                              (€m)

              1,270                                                                      7.9%               8.7%
    1,014                                                                                                                7.6%
                                                                       6.3%
                                           846
                                                        734
                845                                                                  5.4%

                                                                         2013            2014                2013        2014
     2013       2014                       2013         2014

             Operating Cash Flow                                             Operating Cash Flow margin
               (€m, before VDP and WCR)                                                   (before VDP and WCR)

              1,090                                                                      6.8%
                                                                       5.0%                                 5.3%
    813                                                                                                                  4.7%
                                           517          456
                665                                                                  4.3%

    2013        2014                       2013         2014            2013             2014                2013        2014

                                                                       Strike adjusted
       NB: Sum of airlines does not equate to total group because of                            Full Year 2014 results          21
       intercompany transactions and activity at group level
Financial ratios at 31 December 2014, trailing 12 months

               EBITDAR / adjusted net                                                  Adjusted net debt(2) / EBITDAR
                   interest costs(1)                                                5.7x     5.4x
                                                         4.3x(3)                                                 4.7x
                                         3.9x                                                         4.2x
      3.3x              3.5x                                                                                          4.0x(3)
                                                          3.7x

    31/12/2011       31/12/2012*     31/12/2013**      31/12/2014                31/12/2011   31/12/2012*   31/12/2013**   31/12/2014

             EBITDA / net interest costs                                                       Net debt / EBITDA
                                                         5.4x(3)                    4.8x
                                         4.6x                                                   4.3x
                        4.0x                                                                                                 3.4x
      3.6x                                                                                                     2.9x
                                                          4.3x                                                                      2.7x(3)

    31/12/2011       31/12/2012*     31/12/2013**      31/12/2014                31/12/2011   31/12/2012*   31/12/2013**   31/12/2014

              Strike adjusted (EBITDA(R) only, net debt not corrected for strike)
       *     IAS19 Restated
       **    Restated for IFRIC 21, CityJet reclassified as discontinued operation
       (1)   Adjusted by the portion of financial costs within operating leases (34%)
       (2)   Adjusted for the capitalization of operating leases (7x yearly expense)                  Full Year 2014 results            22
       (3)   Excluding strike impact on EBITDA(R) (net debt unchanged)
High level of liquidity

   Cash of €3.5 billion at 31 December 2014

   Undrawn credit lines of €1.75 billion
        Air France: €1.06 billion until 2016
        KLM: €540 million until 2016
        Air France-KLM: €150 million until 2017

   Active debt refinancing program
        Successful €600 million bond issue in June 2014
        Bonds representing €94 million euros repurchased on the same occasion

   Further Amadeus share sale in January
        Net proceeds of €327m
        Remaining 9.9m shares hedged in November 2014

                                                                Full Year 2014 results   23
Strategy
Agenda

   Conclusion of Transform 2015

   Update on Perform 2020
        Key growth initiatives
        Strict framework of financial discipline
        Deployment of cost reduction initiatives at Air France
        Deployment of cost reduction initiatives at KLM

                                                                  Full Year 2014 results   25
Transform 2015: first phase of group turnaround accomplished

   Strict capacity discipline
                                                            Capacity growth
                                                            (CAGR 2011-14)         +0.9%

                                                             Net employee
 Successful renegotiation of labour agreements              cost reduction
                                                             (2014 vs 2011)
                                                                                   -€300m

 Operational transformation
                                                             Point-to-point
    Short and medium-haul restructuring well underway       capacity 2012-15        -30%

                                                          Transavia passengers
    Accelerated development of Transavia
                                                                 2011-14            +60%

                                                              Full-freighter
    Full-freighter activity significantly downsized         capacity 2011-14        -23%

                                                           Number of aircraft
    Successful roll-out of new long-haul products
    underpinning upscaling strategy
                                                        equipped with new cabins       29
                                                              at 31/12/14

                                                              Full Year 2014 results        26
Transform 2015 has delivered on unit cost reduction…

 Ex-fuel net unit cost, in € cents per EASK, like-for-like

                       4.98

                                          4.86
                                                                                        -8%
                                                             4.72                     -0.38 cts

                                                                    4.63
                                                                                 4.60

                       2011               2012               2013   2014         2015
                                                                           With Transform 2015
                                                                               momentum

                                          Annual costs reduced by
                                           over €1 billion in 3 years

                                                                               Full Year 2014 results   27
…leading to a strong improvement in financial situation

       Full Year EBITDA                         Full Year                      Net debt/EBITDA ratio
                  (€bn)                    Operating cash flow                         trailing 12 months
                                             €bn, before change in WCR
                                            and Voluntary Departure Plans
                       1.85                                                     4.9
                                                                                         4.3
            1.39                                                    ~1.5
    1.34                                                    1.31                                            3.4
                                                                                                  2.9
                                                    0.83
                                                                                                            2.7
                                           0.50

 FY 2011 FY 2012 FY 2013 FY 2014           FY 2011 FY 2012 FY 2013 FY 2014      Dec      Dec      Dec       Dec
                                                                                2011     2012     2013      2014
                           Strike impact                       Strike impact                        Strike impact

          2014* vs 2011:                        2014* vs 2011:                  Dec 2014* vs Dec 2011:
            +€670m                                  +€960m                         almost halved

                                                                               Full Year 2014 results              28
             * Excluding strike impact
Agenda

   Conclusion of Transform 2015

   Update on Perform 2020
        Key growth initiatives
        Strict framework of financial discipline
        Deployment of cost reduction initiatives at Air France
        Deployment of cost reduction initiatives at KLM

                                                                  Full Year 2014 results   29
Perform 2020: growth and competitiveness

 Selective development            Capacity and
  on growth markets                 investment discipline
 Product and service              Further restructuring

  upgrade                           and unit cost reduction

                                             Full Year 2014 results   30
Key growth initiatives

   Smart growth in passenger operations
      Increased customer focus
      Upgraded product offer

      Leveraging brand portfolio

      Long-haul partnerships, with a focus on Asia-Pacific

   Accelerated development of Transavia

   Successful growth in maintenance

                                                              Full Year 2014 results   31
2015-17: customer experience improved thanks to €900m investment
in product and service upgrade across all segments

                                                     Customer scores
                                               on business class seat comfort
   Long-haul
        Ongoing deployment of new products                                    8.2
         at both Air France and KLM
        Two Skytrax awards for La Première                             6.0
         lounge                                             5.1
                                                 4.6

   Short and medium-haul
        New Air France product deployed               Previous seats         New
         as of April 2015                                                     seat

                                                           8.1                  7.6
   Digital
                                               4.1                      3.6

      37% of long-haul fleet equipped        Previous    New                  New
                                                                   Previous
            with new product at end 2015        seat      seat       seat      seat
                                               (B747)    (B747)     (B777)    (B777)

                                                           Full Year 2014 results      32
Transavia: a solid footprint in the growing low-cost market,
    targeting breakeven in 2017 and profitability by 2018

   Successful development in France                          Transavia passengers
                                                                          (million)
        Already low-cost leader in the Netherlands                                              >16
        2011-14 traffic growth in France: +78%
        2014 results better than expected

   Further momentum in 2015                                  +60%                                61
        Number 1 low-cost carrier at Orly in 2015,
                                                                           9,9
         operating 49 destinations out of France                    8,9
        Roll out of new positioning, brand image           7,6
         and digital platform                         6,3                   45
        Flying Blue earning and burning
        Order for 20 Boeing 737s
                                                      38
   Medium-term operating margin
    above 5%
        Ongoing efforts at cost control              2011 2012 2013 2014 2015 2016 2017
        2015-17 profitability impacted
         by ongoing ramp-up                           XX    Base fleet, excluding short term leases

                                                                      Full Year 2014 results           33
Maintenance: rapid growth of order book secures significant share
of future revenues

               Growth of order book                                          External revenue
                                                                            and operating result
                                                                                         (€m)
                                                              External revenue CAGR:    +6%
                                                 €5.6bn       Operating result CAGR:   +21%                 1,251
                            +70%                                                                1,225

                                                                                                             196*
                                      €4.4bn                                     1,096
                                                                                                159
                  €3.8bn                                           1,040
  €3.3bn
                                                    54                            145
                                                   months
                                                 of revenue
                                                                    110
     38
    months
  of revenue

  Dec 2011       Dec 2012             Dec 2013   Dec 2014           2011         2012           2013        2014
                                                                     xx     Operating result      External revenue

                                                                                   Full Year 2014 results            34
          * Excluding strike impact
Perform 2020: growth and competitiveness

 Selective development            Capacity and
  on growth markets                 investment discipline
 Product and service              Further restructuring

  upgrade                           and unit cost reduction

                                             Full Year 2014 results   35
Maintaining ongoing capacity discipline…

  Capacity growth plan (ASK)

                                                                                              Network airlines
                                                                                              (Air France, KLM, HOP!)

                                                                                                     Long-haul: +1.5%
                                                                                                     Hub feeding: +2%
                                                                                                     Point-to-point: -11%

                   Total group                                                        +1.2% +1.0%* +1.1%*
                                                                          +0.6%

        +1.8%                                                                  2012    2013       2014       2015       2016    2017
                  +1.5%* +1.6%*
                                                                                                      Transavia
+0.8%
                                                                                      +11.6%

2012     2013       2014         2015        2016        2017                                    +8.2%       +8%

                                                                          +3.1%

                                                                               2012    2013       2014       2015       2016    2017

          * Excluding strike impact                                                                    Full Year 2014 results          36
          Reported network airlines growth: 2014: -0.6%, 2015: approx. +2.7%
…while retaining leadership from Europe to long-haul routes

    Long-haul traffic                                Market share per long-haul region
                                                               (OAG, Winter 2014)
     to/from Europe
          (2014, bn RPK)
                                                                                          Asia

                                                North America*                      11%            12%
                  27% larger                                                               6%
                                               22%      24%    24%
    186           than peers
                                                                                AF-KL      IAG     LH
                 146           145
                                               AF-KL    IAG    LH                         Africa
                                                                                    26%
                                                                                           14%
                                                                                                   7%
                                                 Latin America
                                                21%      23%
                                                                                AF-KL      IAG     LH
                                                                10%
                                                                               Caribbean/Indian Ocean
                                                                                    28%
                                               AF-KL    IAG     LH
                                                                                            9%
2015-16 investment plan revised down by €600m

 Net investment plan, € billion

      Plan presented in September 2014

      Plan updated in February 2015
                                                     2.2                          2.2          2.2
                                  1.9                             1.9
                                               1.6

                      1.2
   0.9

  2013               2014               2015               2016                         2017

                                                                        Full Year 2014 results       38
Unit cost reduction target revised up to an average of 1.5% per year

 Net unit cost per EASK in € cents, at constant currency, fuel price and pension expense

                                            Change in unit cost

             TRANSFORM 2015
        2012           2013            2014           2015            2016           2017          2018-20

       -1.1%
                                                      -1%
                                      -1.4%
                                                    to -1.3%

                       -2.0%

                                                    Target: average -1.5%
                                                            per year                              Air France: €650m
                                                                                                  KLM:        €390m
                                                          2015-17: ~€1bn
                                                                                           Full Year 2014 results   39
Rigorous organization adapted to social context in each airline

 Phase 1      Gathering and validation of benchmarks                Sept-Nov 2014
              Budget and 3-year planning

 Phase 2      Bottom-up approach per cluster                        Dec 2014-
              Consolidation of plans                                March 2015

              Implementation of immediate measures

 Phase 3      Negotiations with all categories of staff
                   KLM negotiations started in December 2014        From Dec 2014
                    Air France presentation and negotiations
                                                                     From April 2015
                

                    after March 2015 union elections

 Phase 4      Implementation of plans                               Ongoing

                                                                Full Year 2014 results   40
Leveraging all contributions beyond traditional efforts
on operational excellence and external costs

                                    
       Operational excellence                     Restructuring
     Renewal of long-haul fleet         Point-to-point
     Fleet densification                Cargo
     Smarter processes                  Smaller underperforming
     Activity by activity                business units
      benchmarking                       G&A

                                    
        External cost reduction          Labor costs and productivity
     Procurement: make or buy           Amendments to Collective
     Fleet optimization                  Labor Agreements:
                                          “productivity and flexibility
     IT and overheads                    for growth”
     …                                  Internal mobility as process
                                          change enabler

                                                       Full Year 2014 results   41
Agenda

   Conclusion of Transform 2015

   Update on Perform 2020
        Key growth initiatives
        Strict framework of financial discipline
        Deployment of cost reduction initiatives at Air France
        Deployment of cost reduction initiatives at KLM

                                                                  Full Year 2014 results   42
Air France approach to Perform 2020

    Perform 2020 plans
   defined per business
  area, along a common
        framework

     Bottom-up workshops per               Early launch of cross-
          business area :                  functional measures
      bring additional ideas               to secure 2015 result
      and refine initial plans
                                         General wage increase freeze
                                          for all categories of staff
                                         New Voluntary Departure Plan
                                         Procurement actions
                                         Stricter capacity discipline
                                         Reduction of investments

                                                   Full Year 2014 results   43
Air France: phasing of cost reduction plan

                                               Perform 2020 schedule
       Reducing the cost base by an average
                                                of cost saving initiatives
            of -1.5% per year means                      (€ million)
  €650m net cost savings by 2017
                                                                        650
    2015 driven by Transform 2015
     momentum                                                            150

    2016-17 projects under review
                                                          180
         65% of savings already
          identified
                                              140

                                              2015        2016          2017
                                                Ongoing/identified projects
                                                Projects to identify

                                                      Full Year 2014 results   44
Main Air France 2015 initiatives

      Main actions already             Additional actions
          implemented                    recently initiated

  Full impact of 2014 Voluntary    Extension of general pay
   Departure Plans                   freeze
  Capacity discipline              New Voluntary Departure

  Further cargo restructuring       Plan targeting 800 FTEs
   (phase out of B747-F)            Reinforced capacity

  Further restructuring             discipline
   of point-to-point network        New procurement actions

  Launch of new                    Reduction of investment plan

   Medium-Haul offering

                                               Full Year 2014 results   45
Air France initiatives generate cost reductions across all areas

                   Transform 2015                                                     Fleet renewal
               €      carry over
                                Groupwide G&A reduction                                    Ground purchasing

      Large               2015 VDP                              Pilot              Cabin crew
    projects                                                 productivity             CLA
                         Point-to-point restructuring                                           Maintenance
                                                                                                infrastructures

                                        Distribution costs
Medium-size
   projects                                                                               Passenger
                    AF Full freighter                                                 sales effectiveness
                    fleet reduction

       Small             Finalization
    projects         of Transform 2015
                   labor cost measures

                          2015                          2016                       2017

                    Operational excellence                        Restructuring
                    External cost reduction                       Labor cost and productivity

                                                                                  Full Year 2014 results          46
Key Air France projects under implementation

   Passenger      Ground process automation
     business           Self-boarding
                        Automatic baggage drop-off

                   Point-to-point restructuring
                        Single Hop! Air France business unit
                        Network restructuring and capacity reduction
                        Voluntary Departure Plan targeting French stations

 Maintenance    Optimization of maintenance facilities
   business      Change in internal vs external workload allocation

                 Process optimization and shorter engine
                  turnaround times

                                                            Full Year 2014 results   47
Perform 2020 timeline for Air France

   Works council: new 2015 measures                 22 January 2015

   Internal communication initiatives
   Continued Perform 2020 bottom-up
    working groups                                   February-March 2015
   Task-setting per cluster at 2017 horizon
   Union elections

   Presentation of Perform 2020 projects to works
    councils, including social consequences          April-May 2015
    of business rationalization (examples: CLA
    amendments and potential FTE reduction)

   Negotiations with all categories of staff
    in parallel with progressive implementation      May to October 2015
    of Perform 2020 measures

                                                      Full Year 2014 results   48
Agenda

   Conclusion of Transform 2015

   Update on Perform 2020
        Key growth initiatives
        Strict framework of financial discipline
        Deployment of cost reduction initiatives at Air France
        Deployment of cost reduction initiatives at KLM

                                                                  Full Year 2014 results   49
KLM approach to Perform 2020

                                                                                                                            
                Our vision                                         Our transformation agenda                                                Our flight plan 2015
   Inspirational view of our end-point                        Concrete projects to reach our vision & strategic objectives       Our concrete management agenda & targets for this year
Supported by specific strategic objectives                        Needs to balance between Funding the Journey                         As such, subset of the Transformation agenda
                 & targets                                                  and “transformation projects"

                                   Becoming Europe's
                                 most customer centric,
                                      innovative and
                                efficient network carrier

    Customer-            Innovative               Efficient
     Centric

                       Network Carrier

           Supported by Highly Engaged Organization

                                                                                                                                         Full Year 2014 results                    50
Sense of urgency created amongst KLM staff
Change, participate and win

                                             Full Year 2014 results   51
Short-term KLM initiatives within Perform 2020 framework

                                           Labour
                    Investments         & Organization

        Suppliers           Other initiatives       Bottom-up

                                                    Full Year 2014 results   52
KLM: phasing of cost reduction plan

     Reducing the cost base by an average     Perform 2020 schedule
           of -1.5% per year means             of cost saving initiatives
                                                           (€ million)
     €390m cost savings by 2017

                                                                             390
    2015: “funding the journey”
     short-term projects and start
                                                                             100
     of Transformation

    2016-17: Winning in                                    110
     the mid term, execution
     of transformation                       90

                                             2015           2016             2017

                                               Ongoing/identified projects
                                               Projects to identify

                                                       Full Year 2014 results       53
KLM: initiatives generate cost reductions across all areas

               €                                 Fleet renewal
                               Cargo             (2016 impact)
                            Restructuring
                                                                                        Fleet renewal
                                                                                        (2017 impact)
                                                                                  CLA
      Large                                                                   negotiations
                                                                             (2017 impact)
    projects                                      CLA
                                              negotiations
                                             (2016 impact)

Medium-size               CLA
   projects           negotiations                                           Distribution
                     (2015 impact)                                               cost
                                                             High performance             Passenger sales
                                                                organization               effectiveness
                                       Operational
       Small                           excellence
    projects

                        2015                         2016                           2017

                   Operational excellence                    Restructuring

                   External cost reduction                   Labor cost and productivity

                                                                                   Full Year 2014 results   54
KLM: examples of major transformation projects
Coordinated by a transformation office

     High performance organization           Operational excellence

   De-layer organization by              Structurally & integrally improve
    optimizing span of control             operational performance related
                                           to customer demand
   Optimize/centralize support
    functions (incl. minimize waste)      Achieve excellent performance
                                           in operations – simultaneously
   Behavior and performance reboot        financially and operationally
   Optimize our workplace for
    productivity and engagement

                                                        Full Year 2014 results   55
Customer centricity as core KLM value

                                        Full Year 2014 results   56
Status of KLM Collective Labor Agreement negotiations

   Negotiations started on 18 December 2014

   Framework established with most unions
        Framework finalized with Cockpit & Ground unions
        No consensus on framework with Cabin unions; negotiations continue without
         framework

   Current focus on detailing commitment of unions and specific
    measures for the first 12-18 months

   In parallel, discussions to address specific restructuring plans:
    cargo, airframe maintenance

                                                                Full Year 2014 results   57
In conclusion

            Development initiatives moving at full speed
            Rigorous approach to investments, capacity
             and cost actions
            Timeline adapted to social context of each
             airline

                         A de-risked business and
                       a deleveraged balance sheet,
                          delivering healthy ROCE

                                                      Full Year 2014 results   58
Outlook
Outlook

   Full Year 2015 targets
       The significant upside expected on the fuel bill could be
        almost completely offset by unit revenue pressure and
        negative currency impacts
       Further cost reduction: 1 to 1.3% unit cost reduction,
        equivalent to €250m to €350m
       Net debt around 5 billion euros at end 2015

   Medium-term objectives
       Adjusted net debt / EBITDAR ratio around 2.5 by end 2017
       Base businesses to consistently generate annual positive
        free cash flow
       EBITDAR growth target no longer applicable in view of
        significant fall in fuel price and implications on unit revenue
        development
                                                       Full Year 2014 results   60
Appendix
Fourth Quarter 2014: Contribution by business segment

                                       Reported Change                                    Change
                             Revenue   Change Like for like       Op. result   Change   Like for like
                              (€ bn)      (%)     (%)               (€m)        (€m)        (€m)

      Passenger    79%
                              4.86     +0.3%      -1.4%           -171         -112       -19      
         Cargo
                  11%         0.71     -1.2%      -2.8%             -31         -13         10     
   Maintenance
                        5%
                              0.36 +19.5% +11.6%                     61         +13        +9      
          Other
                        5%
                              0.28     +9.3%     +9.3%              -28          +6        +6     
                  Total       6.21     +1.5%      -0.5%           -169         -106        +6      

                                                                       Full Year 2014 results           62
Fourth Quarter passenger unit revenue by network
Like-for-like

                                                        Medium-haul point-to-point

                                                                                                    Total medium-haul
                                                         -15.6%        -11.7%           8.4%
                                                          ASK            RPK            RASK

                                                                                                -1.9%     1.0%     0.9%
             North America                                    Medium-haul hubs                   ASK      RPK      RASK

      1.9%         2.5%         2.7%                       2.7%         4.6%            -0.9%
      ASK          RPK          RASK                       ASK          RPK             RASK

             Latin America                                 Africa and Middle East                         Asia

      4.1%         3.5%         -8.0%                     -2.9%        -4.1%        -2.6%       -0.6%    -0.3%     -3.5%
      ASK          RPK          RASK                       ASK          RPK         RASK         ASK      RPK      RASK

             Total long-haul                            Caribbean & Indian Ocean                         Total

      0.2%         0.6%         -1.7%                     -1.3%         1.4%            2.2%    -0.2%     0.7%     -1.1%
      ASK          RPK          RASK                       ASK          RPK             RASK     ASK      RPK      RASK

              *: Q4 one-offs taken at central level, no allocation to specific region           Full Year 2014 results     63
Cargo capacity and unit revenue per quarter

              2012    Q1 2013   Q2 2013   Q3 2013   Q4 2013   Q1 2014   Q2 2014        Q3 2014   Q4 2014

Capacity
                                                                                       -0.5%     -0.3%
                                                    -0.9%     -0.9%
                                          -1.5%
                                                                         -2.0%
              -3.5%
                      -4.1%     -4.2%
                                                                    Excluding strike

                                                                         +1.1%

  RATK
ex-currency
                      -1.0%                                   -1.0%                              -1.2%
                                                                                       ~-2.1%
              -3.8%
                                -4.8%     -5.2%     -5.7%

                                     -4.2%                                     -0.9%
                                                                  Excluding strike

                                                                           Full Year 2014 results          64
Fourth Quarter: Change in operating costs

                                                                                                                    Change
                                                                                                   Reported        at constant            Like-for
                                                                                     €m             change          currency               -like(4)

       Total employee costs including temps                                         1,859            +1.4%             +1.1%
 30%

 25%   Supplier costs(1) excluding fuel and                                         1,578            +2.1%             +1.0%
       purchasing of maintenance services and parts

 12%
       Aircraft costs(2)                                                               821           +6.6%             +3.6%

       Purchasing of maintenance services
 5%                                                                                    377         +14.9%              +7.0%
       and parts
       Operating costs ex-fuel(3)                                                   4,678            +3.2%             +2.0%                0.7%

 26%   Fuel                                                                         1,703            +3.1%              -3.3%              -3.3%

       Grand total of operating costs                                               6,381            +3.2%             +0.5%               -0.4%
       Capacity (EASK)                                                                                                   +0.5%

       (1)Catering, handling, commercial and distribution charges, landing fees and air-route charges, other external expenses,
           excluding temps
       (2) Chartering (capacity purchases), aircraft operating leases, amortization, depreciation and provisions
       (3)Including other taxes, other revenues, other income and expenses
       (4)Like-for-like: at constant currency, excluding strike impact and Q4 one-offs
                                                                                                                 Full Year 2014 results         65
Impact of pilot strike on Full Year 2014 profit and loss statement

 14 days of strike from 15 to 28 September, plus one day affected by cancellations

              Activity: ~-4.75bn EASK                                                Traffic revenues: ~-€495m
             Passenger                               Cargo
                                                                                             Passenger                Cargo
            -4,249m ASK                            -213m ATK

        -18%                                -16%
                                                                                                                      -44

                  Strike impact on September activity                                            -451

                  Net Costs*: ~-€70m                                         Operating result: ~-€425m
                                                                                     Passenger     Cargo    Maintenance       Other
                                          22                                                                                  -7
                                                        7                                           -24         -22

                            -20

               -79                                                                    -372
            Passenger      Cargo Maintenance          Other

           * Including impact on intersegment revenues (eliminated at group level)                       Full Year 2014 results       66
Other businesses: Catering

   Increase in third party
    revenues excluding impact
    of disposal of Air Chef
        Examples: Jet Airways, US Airways,
         Cathay Pacific

   Improvement in profitability
    while continuing to reduce
    cost for internal customers
                                                                                      Catering         FY 14   FY 13   Change Like-for-Like*
   Emphasis on quality of service                                                     Total revenue    871     915      -4.8%        +2.1%
                                                                                       Third party
   Further extension of operations                                                    revenue
                                                                                                        311     341      -8.8%        +5.9%

        Launch of operations in Sao Paulo                                             Operating
                                                                                                         18      24     -25.0%       +20.8%
                                                                                       result
        Extension with partners in Belgium,
         Canada, Chile and DR Congo

             * Like-for-like: FY 2013 restated for sale of Air Chef and excluding strike impact          Full Year 2014 results        67
Full Year 2014: Adjusted net result

 Calculation of Full Year 2014 adjusted net result, in million euros

            Net result,                                                                                                Adjusted
           group share                                                                                                 net result
                                                       Non current
                                     +4                  result

                -198
                               Discontinued
                                operations
                                  (CityJet)                                                          Asset
                                                                                                   valuation

                                                                                                                        -535
                                                          -880
                                                                                                    +447
                                                                              Value of
                                                                              hedging
                                                                              portfolio
                                                                                +92
                                                                                          De-recognition
                                                                                          deferred tax asset:   + 89
                                              Legal modification
                                                                                          Deferred tax modification
                                              NL pension plan:        - 824
                                                                                          on pension plans:     +206
                                              Amadeus:                -187
                                                                                          Unrealized foreign
                                              Impairment Cargo fleet: + 113               exchange result:      +122
                                              Other:                  + 18                Other:                +30

                                                                                                        Full Year 2014 results      68
Adapting capex levels to cash generation

     € million

                                                                                                  Operating                    Operating
                                                                                                Free cash Flow               Free cash Flow
                                                                                                                             excluding strike

                                                                                              343
                      Operating
                    Free cash Flow                                                                                        Strike
                                                                                                                                          VDP
                                                           Operating                                                                      154
                                                         Free cash Flow
                                   VDP                                                                      VDP           113
                                   140                                  VDP                                                         VDP
                                                                                                            183
                                                                         32                                                         154
                                                       49

                                                                                                                                           Net
   Change
                 331               Net                                                    1,311                           1,039           Capex
    in WCR                                                                                                  Net
                                  Capex                                 Net                                Capex
                                                                       Capex                                                              1,162
                                   998                834                                                   941
  Cash flow                                                             898
 before VDP
and change       448
     in WCR

                         2011                                 2012                                  2013                           2014

                 Operating free cash flow: net cash flow from operating activities less net
                 capex on tangibles and intangibles. All amounts excluding discontinued
                 operations. See definition in press release                                                      Full Year 2014 results          69
Debt reimbursement profile at 31 December 2014*

                                                                                                           Convertible bonds
2009 4.97% convertible
    bond (€661m)                                                                                           Plain vanilla bonds
  Maturity: April 2015                                                                                     October 2016: Air France-KLM 6.75% (€700m)
  Conv. price: €11.80                                    2013 2.03% convertible                            January 2018: Air France-KLM 6.25% (€500m)
                                                             bond (€550m)                                  June 2021: Air France-KLM 3.875% (€600m)
                                                           Maturity: Feb. 2023
                                                             Put: Feb. 2019
                                                                                                           Other long-term debt – mainly
                                                           Conv. price: €10.30                             asset-backed (net of deposits )
                                  2005 2.75% convertible
                                      bond (€420m)
                                    Maturity: April 2020
                                    2nd put: April 2016
                                    Conv. price: €20.50

                                                      500
                         606

                                                                                                     600

         970                           980
                                                      720
                         610                                          620
                                                                                     470             420
                                                                                                                    220          160          210

        2015             2016         2017           2018            2019           2020            2021           2022          2023     2024 and
                                                                                                                                           beyond

               * In € millions, net of deposits on financial leases and excluding KLM perpetual debt (€564m)     Full Year 2014 results             70
You can also read