JUNE INVESTOR PRESENTATION - June 2021 - cloudfront.net

Page created by Mary Robles
 
CONTINUE READING
JUNE INVESTOR PRESENTATION - June 2021 - cloudfront.net
JUNE INVESTOR PRESENTATION
June 2021
JUNE INVESTOR PRESENTATION - June 2021 - cloudfront.net
IMPORTANT DISCLOSURES – EARNINGS DECK
FORWARD LOOKING STATEMENTS

This presentation contains forward-looking statements within the meaning of Section 27A of the Securities Act of 1933 and Section 21E of the Securities Exchange Act of 1934.
Forward-looking statements include all statements regarding wells anticipated to be drilled and placed on production; future levels of development activity and associated production,
capital expenditure, expense, and cash flow returns, and earnings expectations; the Company’s 2021 production, expense and capital expenditure guidance; estimated inventory and
reserve quantities and the present value thereof; and the implementation of the Company’s business plans and strategy, as well as statements including the words “believe,” “expect,”
“plans”, "may", "will", "should", "could" and words of similar meaning. These statements reflect the Company’s current views with respect to future events and financial performance
based on management's experience and perception of historical trends, current conditions, anticipated future developments and other factors believed to be appropriate. No assurances
can be given, however, that these events will occur or that these projections will be achieved, and actual results could differ materially from those projected as a result of certain factors.
Any forward-looking statement speaks only as of the date on which such statement is made and the Company undertakes no obligation to correct or update any forward-looking
statement, whether as a result of new information, future events or otherwise, except as required by applicable law. Some of the factors which could affect our future results and could
cause results to differ materially from those expressed in our forward-looking statements include the volatility of oil and natural gas prices; changes in the supply of and demand for oil
and natural gas, including as a result of the COVID-19 pandemic and various governmental actions taken to mitigate its impact or actions by, or disputes among, members of OPEC
and other oil and natural gas producing countries, such as Russia, with respect to production levels or other matters related to the price of oil; our ability to drill and complete wells,
operational, regulatory and environment risks; the cost and availability of equipment and labor; our ability to finance our activities; and other risks more fully discussed in our filings with
the SEC, including our most recent Annual Reports on Form 10-K and subsequent Quarterly Reports on Form 10-Q, available on our website or the SEC’s website at www.sec.gov.

SUPPLEMENTAL NON-GAAP FINANCIAL MEASURES

This presentation includes non-GAAP financial measures such as “Adjusted Free Cash Flow,” “Adjusted G&A,” “Full Cash G&A Costs,” and “Adjusted EBITDA”. These measures,
detailed below, are provided in addition to, and not as an alternative for, and should be read in conjunction with, the information contained in our financial statements prepared in
accordance with GAAP (including the notes), included in our filings with the U.S. Securities and Exchange Commission (the “SEC”) and posted on our website. Please see the appendix
for reconciliations to the nearest GAAP measures.

Adjusted free cash flow is a supplemental non-GAAP measure that is defined by the Company as adjusted EBITDA less operational capital, cash capitalized interest, net cash interest
expense and capitalized cash G&A (which excludes capitalized expense related to share-based awards). We believe adjusted free cash flow is a comparable metric against other
companies in the industry and is a widely accepted financial indicator of an oil and natural gas company’s ability to generate cash for the use of internally funding their capital
development program and to service or incur debt. Adjusted free cash flow is not a measure of a company’s financial performance under GAAP and should not be considered as an
alternative to net cash provided by operating activities, or as a measure of liquidity, or as an alternative to net income (loss).

Adjusted G&A is a supplemental non-GAAP financial measure that excludes certain non-cash incentive share-based compensation valuation adjustments. Callon believes that the non-
GAAP measure of adjusted G&A is useful to investors because it provides a meaningful measure of our recurring G&A expense and provides for greater comparability period-over-
period.

Full cash G&A is a supplemental non-GAAP financial measure that Callon defines as adjusted G&A – cash component plus capitalized G&A excluding capitalized expense related to
share-based awards. Callon believes that the non-GAAP measure of full cash G&A is useful because it provides users with a meaningful measure of our total recurring cash G&A costs,
whether expensed or capitalized, and provides for greater comparability on a period-over-period basis.

Callon calculates adjusted EBITDA as net income (loss) before interest expense, income tax expense (benefit), depreciation, depletion and amortization, (gains) losses on derivative
instruments excluding net settled derivative instruments, impairment of evaluated oil and gas properties, non-cash stock-based compensation expense, merger and integration
expense, (gain) loss on extinguishment of debt, and other operating expenses. Adjusted EBITDA is not a measure of financial performance under GAAP. Accordingly, it should not be
considered as a substitute for net income (loss), operating income (loss), cash flow provided by operating activities or other income or cash flow data prepared in accordance with
GAAP. However, the Company believes that adjusted EBITDA provides additional information with respect to our performance or ability to meet our future debt service, capital
expenditures and working capital requirements. Because adjusted EBITDA excludes some, but not all, items that affect net income (loss) and may vary among companies, the adjusted
EBITDA presented above may not be comparable to similarly titled measures of other companies.

                                                                                                                                                                                                   2
JUNE INVESTOR PRESENTATION - June 2021 - cloudfront.net
A DIFFERENTIATED VALUE PROPOSITION
COMPLIMENTARY ASSET PORTFOLIO                                                                            ▪ Premier asset portfolio for sustained free cash flow generation
                                                           Midland Basin:                                        – Over 1,100 risked locations with breakeven pricing at $40/Bbl (WTI) and
                                                           Mid-cycle co-development of                             below
                                                           high return multi-zone
                                                           inventory                                             – Diversification from Permian and Eagle Ford positions provides balanced
                                                                                                                   corporate cash conversion cycles
                                                                                                                 – “Life of field” development philosophy preserves inventory economics and
                                                                                                                   underpins net asset value
                                                                                                                 – Moderated reinvestment rates1 and resultant production growth

                                                                                                         ▪ Clear path to shareholder value creation from reduction of absolute
                                                                                                           debt levels
Delaware Basin:                                                                                                  – Transfer of enterprise value composition from debt to equity
Long-term growth driver shifting
into development mode                                                                                            – Industry leading cash margins accelerate pace of deleveraging
                                                                                                                 – Between $500-$800 million2 in estimated adjusted FCF3 at $50-$60/Bbl WTI
                                            Eagle Ford Shale:                                                    – Current forecast of over $200 million in FY21 at strip pricing4
                                            Highly efficient cash flow machine with
                                            repeatable, low-risk inventory
                                                                                                         ▪ Tangible financial goals provide clarity for priorities
KEY STATISTICS                                                                                                   – Target Net Debt to Adjusted EBITDA3 < 2.5x by year end 2022

Total Net Acres                                                         ~180,000                                 – Medium-term target Net Debt to Adjusted EBITDA3 < 2.0x from FCF3 and
                                                                                                                   asset monetizations

1Q21 Total Production (Mboe/d)                                               80.1                        ▪ Continuous improvement culture around ESG
                                                                                                                 – 2020 a record year for safety and spill management
1Q21 Oil Production (MBbl/d)                                                 51.8
                                                                                                                 – Investing to actively reduce flaring and lower overall emissions
Market Cap4 ($BN)                                                            $2.2                                – Increasing compensation alignment with sustainability related corporate goals
                                                                                                                 – Targeting 40%-50% reduction in GHG Emissions Intensity by 20255
Enterprise Value4 ($BN)                                                      $5.2

         1.   Callon defines “reinvestment rate” as (Accrued Operational Capital Expenditures) / (Adjusted Discretionary Cash Flow - Capitalized Expenses).
         2.   Estimated value for combined FCF generation from 2021-2023 using a reinvestment rate assumption of 65% - 75%.
         3.   Adjusted EBITDA and adjusted FCF are non-GAAP measures. Please see the appendix for reconciliations to the nearest GAAP measures.                                               3
         4.   As of 6/7/2021.
         5.   Versus 2019 levels.
JUNE INVESTOR PRESENTATION - June 2021 - cloudfront.net
PATH TO DECARBONIZATION
2021 INITIATIVES                                                          GREENHOUSE GAS (GHG) INTENSITY REDUCTION TARGETS1
                                                                          50%                       Targeting 40-50% reduction in
                              Expand field                                                          GHG Emissions Intensity by 20252
                            electrification to                                                                                                                                By 2025
                                                                                                                                                                              By 2030
                            eliminate diesel
                               generators
 Electrification
                                                                          25%

                          Field compression
                             optimization
                               projects
 Compression                                                                                                                                       No disclosed reduction goals
                                                                            0%

                           Expanding gas
                               gathering
                                                                          ROUTINE FLARED GAS REDUCTION TARGETS
                            optionality to
                           mitigate 3rd party
                                                                                          100% Elimination                                              No Flaring Target Disclosed
Gas Gathering                 flaring risk
                                                                                   By 2025                        By 2030                             APA               MTDR
                                                                                                                                                      CLR               OVV
                                                                               CPE                            HESS                                    CXO               PDCE
                           Utilizing dual fuel                                 CDEV                           OXY                                     DVN               PVA
                            and tested first                                   COP                            PXD                                     EOG               SM
                           electric frac fleet                                 LPI                            XOM                                     FANG              XEC
 Dual Fuel &                                                                                                                                          MRO
  Electric
       1. Data from company presentations. Peers include: APA, CDEV, CLR, COP, CXO, DVN, EOG, FANG, HES, LPI, MRO, MTDR, OVV, OXY, PDCE, PVA, PXD, SM, XEC, AND XOM.
       2. Versus 2019 pro forma.
                                                                                                                                                                                        4
JUNE INVESTOR PRESENTATION - June 2021 - cloudfront.net
EVOLVING EXECUTIVE COMPENSATION FOR 2021
ANNUAL BONUS ALIGNED WITH SHAREHOLDER PRIORITIES                                                                   REDESIGNED ANNUAL INCENTIVE FRAMEWORK - 2021

                                                                        Returns                                    Advancement of
                                                                                                                  strategic initiatives                 80% Quantitative Metrics
                                                                                                                         20%                                         •
    Prioritizing                                            ESG Performance                                                                                              Leverage

                                                                                                                                                         Financial
                                                                                                                                                                     •   CROCI
     financial                                                                                                                                                       •   Corporate cash margins
   performance                                             Reduced Leverage                                                                                          •   Relative Total
                                                                                                                                                                         Shareholder Returns1
     and ESG                                                                                                      ESG metrics
    initiatives                                                Corporate Cash                                       15%                                              •   Flaring metrics
                                                                  Margins                                                                                            •

                                                                                                                                                         ESG
                                                                                                                                                                         Total Recordable
                                                                                                                                                                         Incident Rate (TRIR)
  Payout capped at                                          Relative Total                                                                                           •   Fluid Spills
                                                                                                                                           Financial
target if absolute TSR                                   Shareholder Returns                                                              performance
  is negative for the                                                                                                                       65%
          year

PROACTIVE COMPENSATION MANAGEMENT                                                                                  LONG TERM INCENTIVE PLAN UPDATES

                                                       CEO Target                                                  ▪ Introduction of new cash performance units (“CPUs”)
      17.5%                                         Long Term Incentive                                              with 60% weighting

                                                                                                                   ▪ Payout value to be determined by adjusted free cash
      12.5%                              CEO Total Target Compensation
                                                                                                                     flow and average annual return on capital employed
                                                                                                                     (“ROCE”) over three-year performance period
                                                 Executive Officer Target
      >10%                                        Long Term Incentive                                              ▪ Alignment with Callon strategic initiatives
                                                                                                                         ▪ Achieving sustainable free cash flow generation
      12.5%                                       Director Compensation                                                  ▪ Competitive returns within and outside energy industry

    1. Annual incentives capped at a maximum of 100% of Target payout if absolute TSR for the year is negative.

                                                                                                                                                                                                5
JUNE INVESTOR PRESENTATION - June 2021 - cloudfront.net
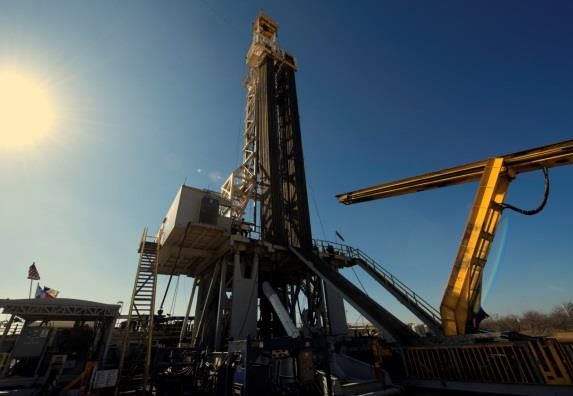
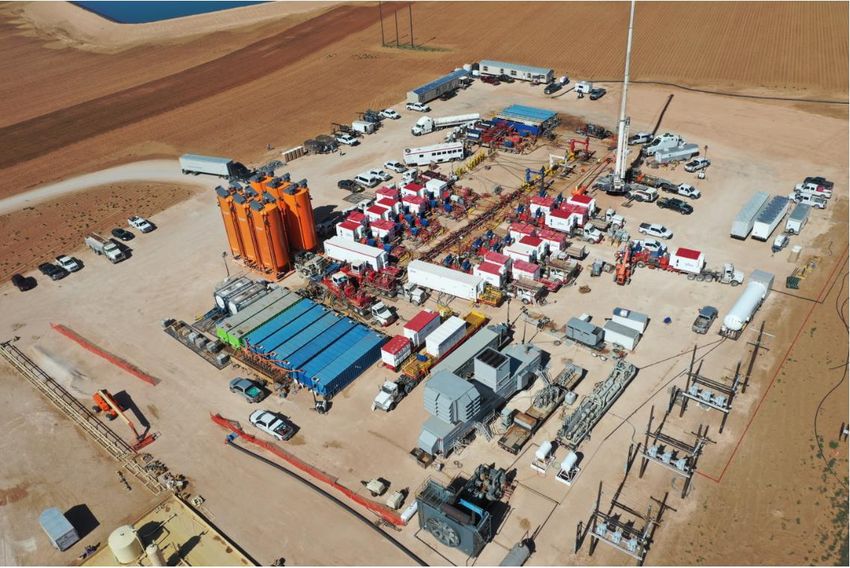
SUCCESSFUL TEST OF E-FRAC TECHNOLOGY1
INITIAL E-FRAC PROJECT OVERVIEW

▪ Chapparal Unit (Howard County)

  ‒ Three-well pad targeting Lower Spraberry, WCA,
    and WCB

  ‒ 160 total stages completed

  ‒ More than 56 million pounds of proppant delivered
    over ~34,000 lateral feet

  ‒ Average number of stages per day2 : 9

                                                                                              ▪ Critical project elements and key learnings

                                                                                                   ‒ “Rich” field gas management and entrained liquids handling

                                                                                                   ‒ Piping and compression management hurdles and opportunities

                                                                                                   ‒ Evaluation of grid power options and full cycle investment cost for
                                                                                                     future development

      1. Photo courtesy of USWS who performed the completion work for Callon on the Chapparal pad in Howard County within the Midland Basin,
      2. Excludes the initial setup, compression, and safety days to ramp activity,
                                                                                                                                                                           6
JUNE INVESTOR PRESENTATION - June 2021 - cloudfront.net
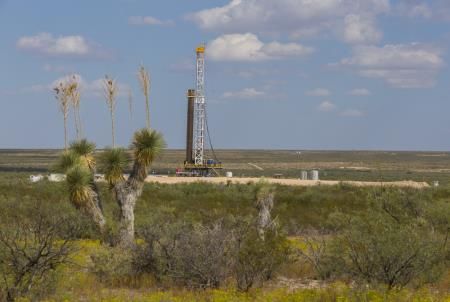
STRONG ADJUSTED FCF FOR ABSOLUTE DEBT REDUCTION1
                                                                                                   OPERATIONAL CAPITAL EXPENDITURES
  Planning                      Price                       Reinvestment
   Period                    Assumption                         Rate2                                              $1,100
                                                                                                                                                                     >50%
                                                                                                                    $900                                           reduction
                                   $50/Bbl                             75%

                                                                                                  $MM
                                                                                                                    $700
 2022E / 2023E                     $55/Bbl                             70%                                          $500

                                                                                                                    $300
                                   $60/Bbl                             65%                                                  2019                    2020            2021E          2022E        2023E

HIGHLIGHTS                                                                                         CUMULATIVE ADJUSTED FREE CASH FLOW
▪ FY 2021 Plan                                                                                                     $1,000
                                                                                                                    $800
  ‒ $430 MM Operational Capex
                                                                                                                    $600

                                                                                                  $MM
    (12% YoY Reduction)
                                                                                                                    $400                                 @ $50/Bbl
  ‒ Implied 75% Reinvestment Rate2 at $50/Bbl                                                                       $200

  ‒ Sustains production and increases FCF for debt                                                                    $0
                                                                                                                               2020                        2021E               2022E           2023E
    repayment @ $50/Bbl, while positioning for
    medium-term activity
                                                                                                  NET DEBT / ADJUSTED EBITDA3
▪ 2022 and 2023 scenarios at or below 75%
  reinvestment rates provide acceleration of                                                                         4.5x
  FCF generation and associated deleveraging                                                                         4.0x
                                                                                                  Leverage Ratio

                                                                                                                     3.5x
▪ $500 MM to $800 MM of cumulative adjusted
                                                                                                                     3.0x                                      @ $50/Bbl
  FCF over next three years (2021E @ $50/Bbl)
                                                                                                                     2.5x
▪ Production CAGRs of 1% - 4% over FY 2021                                                                           2.0x
  (approximates FY 2020 volumes by 2023 at                                                                           1.5x
                                                                                                                            2019                   2020            2021E          2022E        2023E
  top end of range)
                                                                                                                                     $50 / 75%                 $55 / 70%           $60 / 65%

      1. 2019 figures include Carrizo acquisition.
      2. Callon defines “reinvestment rate” as (Accrued Operational Capital Expenditures) / (Adjusted Discretionary Cash Flow - Capitalized Expenses).
      3. No assumed proceeds from asset monetizations included.                                                                                                                                         7
JUNE INVESTOR PRESENTATION - June 2021 - cloudfront.net
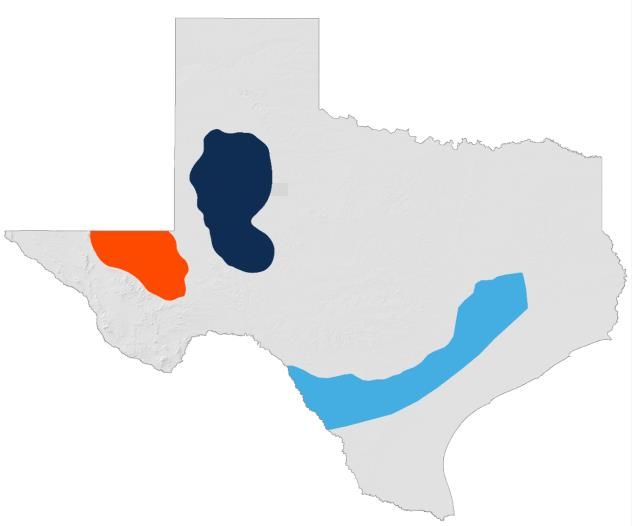
MANAGING CASH COSTS FOR IMPROVED MARGINS
 “ALL-IN” CASH COSTS1 VS REALIZATIONS2
                                                                                                                          1Q21 Results                                                       Permian                   Eagle Ford

        $50
                                                                                                                          Daily production (MBoe/d)                                              57.8                        23.2

                                                                                                                                % Oil                                                            59%                         76%
        $40                                                                                                                                                                              Cash G&A

                                                                                                                                % NGL                                                 Prod &21%
                                                                                                                                                                                             Ad Val                          11%

                                                                                                                          Realized price3 ($/Boe)                                      Cash$42.06
                                                                                                                                                                                            Interest                       $48.85
        $30
$/Boe

                                                                                                                          Production Costs:

                                                                                                                                                                                               LOE
        $20                                                                                                                     LOE ($/Boe)                                                     $4.31                       $8.65

                                                                                                                                Production and ad
                                                                                                                                                                                                $2.32                       $3.07
                                                                                                                                valorem taxes ($/Boe)
        $10
                                                                                                                                GP&T ($/Boe)                                                    $2.54                       $2.29

                                                                                                                          Operating margin ($/Boe)                                             $32.89                      $34.84
         $0
                        2020 Actual                    1Q21 Actual                         2021E

                                                                                                                               Comparable operating cost structures with
              LOE                                                  GP&T                                                         diversification across commodity mix and
              Production & Ad Valorem Tax                          Cash G&A4
                                                                                                                               physical pricing points contribute to strong
              Cash Interest                                        Unhedged Price Realizations
              Hedged Price Realizations                                                                                                      corporate margins

              1. “All-in” Cash Costs include LOE, GP&T, Cash G&A, Cash Interest Expense, and Production and Ad Valorem Taxes.
              2. Price realizations for 2020 and 1Q21 are unhedged and hedged price per Boe per our earnings release. Price realizations for 2021E assumes midpoint of cost guidance and consensus benchmark prices of $58.67 WTI
                 and $2.70 Henry Hub as of May 3, 2021, accounting for Company differential assumptions and current hedges.                                                                                                         8
              3. Prices are exclusive of hedging.
              4. Cash G&A is a non-GAAP measure. Please see the appendix for reconciliations to the nearest GAAP measures.
ROBUST PORTFOLIO FOR SCALED DEVELOPMENT
 PRIMARY ZONE INVENTORY OVERVIEW                                                                                                  DEVELOPMENT STRATEGY
                                                                                                                                  ▪ “Primary zone” inventory limited to delineated zones in active
                                                                                                                                    development
                                                                                                                                  ▪ Over 1,100 risked locations with breakeven economics at
  INVENTORY BY AREA

                                                                                                                                    $40/Bbl or lower
                                                                   >1,700                                                                 – All type curve economics risked for development interference
                                                                                                                                            learnings from scaled project deployment
                                                                      Gross
                                                                     Locations                                                            – Engineered spacing on a pad-by-pad basis

                                                                                                                                  ▪ Delaware Basin
                                                                                                                                          – Primary zones: 2BS / 3BS / WCA / WCB / WCC
                                                                                                                                          – Average lateral: ~8,700’         Average W.I.: ~83%
                                                                                                                                          – Up to six wells per zone, with tailored spacing for offset wells
                                           Delaware Basin            Midland Basin             Eagle Ford
                                                                                                                                          – Other potential zones: Canyon Sands / Avalon

                                       1,800                                                                                      ▪ Midland Basin
                                                                                                                                          – Primary zones: MS / LS / WCA / WCB
                                       1,500
                                                                                                                                          – Average lateral: ~7,000’         Average W.I.: ~87%
                                                                                                                                          – Six to eight wells per zone, with custom spacing for offset wells
                      # of Locations

                                       1,200
ECONOMICS(1)

                                                                                                                                          – Other potential zones: Clearfork / Jo Mill / Penn Shale / Atoka
                                        900
                                                                                                                                  ▪ Eagle Ford
                                        600
                                                                                                                                          – Primary zone: Lower Eagle Ford
                                        300                                                                                               – Average lateral: ~7,200’        Average W.I.: ~90%
                                          0                                                                                               – Average lateral spacing of ~525’
                                                $40 / $2.50              $50 / $2.50               $60 / $2.75                            – Other potential zones: Austin Chalk
                                           Delaware Basin            Midland Basin              Eagle Ford                                – Enhanced oil recovery being evaluated

                              1. Number of gross locations with breakeven PV10 economics at or below assumed NYMEX benchmark oil and natural gas flat price scenarios.

                                                                                                                                                                                                                9
OPTIMIZING INVENTORY VALUE1
COMPLETION EVOLUTION                                 ACCELERATED OIL PEAK                               INCREASED OIL CUT

                                                           80                                              100%                                  >55
       80                                                                               AFE
                                                                                                                                                 45-55
                                                                                        2020 WELLS                                               55 BWPF           45-55 BWPF   55 BWPF             45-55 BWPF   55                        45-55
DRILLING AND COMPLETIONS CONTINUE TO IMPROVE
LOWERING COSTS FOR FULL FIELD DEVELOPMENT                                                                                         DRILLING PRODUCTIVITY DRIVES SAVINGS1

▪ Continued application of combined learnings driving
                                                                                                                                 $400                                                                                          25%
  consistent well results at low cost
▪ First quarter average DC&E cost of ~$500 per lateral
  foot across all asset areas
▪ Recently set a new company record for Delaware
                                                                                                                                                                                                                               20%
  lateral efficiency drilling 11,359' in just 75 hours
                                                                                                                                 $300

EAGLE FORD COMPLETION EFFICIENCY ADVANCES
                                                                                                                                                                                                                               15%

2,500
                                                                                                                                 $200

                                                                                                                                                                                                                               10%
2,000

                                                                                                                                 $100
                                                                                                                                                                                                                               5%
1,500

1,000                                                                                                                                $0                                                                                        0%
                     1Q19                                1Q20                                 1Q21                                           Delaware East Delaware West                            Midland     Eagle Ford

                                  Completed Lateral Feet per Day                                                                               Drilling $ per Effective Lateral Foot                      Percentage Savings

        1. Drilling cost per lateral foot represent FY21 drilling activity YTD. Percentage savings are calculated as the improvement in effective cost per lateral foot for YTD FY21 versus 2020.

                                                                                                                                                                                                                                11
CASH FLOW PROTECTION WITH UPSIDE PARTICIPATION
                             2Q-4Q FY21 Oil Hedges1                                                                  2021 PROTECTED WITH 2022 UPSIDE POTENTIAL
                                                                                                                    ▪ 2Q-4Q FY21 oil production ~70% hedged
                                                                          Unhedged
                                                                                                                                             − ~60% hedged in 2H21
0%             20%                 40%                 60%                 80%                100%                  ▪ Ongoing optimization has increased exposure to higher oil
     NYMEX WTI Collars                NYMEX WTI Swaps                    ICE Brent Collars                                           prices across physical pricing points
     ICE Brent Swaps                  MEH Collars                                                                   ▪ 2Q21-4Q21 natural gas ~63% hedged

                      2Q-4Q FY21 Natural Gas Hedges1                                                                ▪ 2022 oil production ~20% hedged2
                                                                                                                                             -~13% of production hedged with collars at $49 / $62
                                                                    Unhedged                                                                 -~7% of production hedged with WTI swaps at $60
                                                                                                                                             − Cash flow protection to support debt reduction goals
0%             20%                 40%                 60%                 80%                100%

                                                                                                                      WTI INDEX PRICE SENSITIVITY3
                 NYMEX HH Collars                      NYMEX HH Swaps

                                                                                                                                             $65
                                  2022 Oil Hedges1,2
                                                                                                                                             $60

                                                                                                                       Realized Oil Prices
                                        Unhedged                                                                                             $55

0%             20%                 40%                 60%                 80%                100%                                           $50
           NYMEX WTI Collars               NYMEX WTI Swaps                 MEH Collars
                                                                                                                                             $45
                            2022 Natural Gas Hedges2
                                                                                                                                             $40

                                     Unhedged                                                                                                $35
                                                                                                                                                      2Q21          3Q21           4Q21              1Q22
                                                                                                                                                                    Benchmark WTI Prices
0%             20%                 40%                 60%                 80%                100%
                   NYMEX HH Collars                NYMEX HH Swaps                                                                                    $45.00    $50.00    $55.00   $60.00    $65.00

       1. Excludes short call positions in 3Q21 and 4Q21, and swaptions in 2022. Please see hedging details in Appendix for more information.
       2. Based on FY22 consensus estimate as of June 7, 2021.
       3. Realized WTI price after hedges. Assumes constant MEH and Brent pricing. Based on quarterly consensus production as of June 7, 2021.                                                              12
MULTIPLE INITIATIVES DRIVING DEBT REDUCTION
▪ Organic adjusted free cash flow generation

  ‒ Combined $146.8 million in adjusted FCF since 2Q201
                                                                                                                                                        Monetization
  ‒ Projecting $500 to $800 million through 2023 at oil                                                                                                 opportunities
    prices between $50 and $60 WTI per barrel2

▪ Monetization opportunities

  ‒ Recently signed PSAs for ~$40 million

  ‒ Currently targeting $125 to $225 million for FY 2021

  ‒ Completed transactions for $170 million in 2020                                                                                                Deleveraging                                 Improved
                                                                                                     Organic FCF
                                                                                                      generation                                      of the                                   operational
▪ Enhanced marketing realizations and cost control                                                                                                                                             cost control
                                                                                                                                                     balance
  ‒ Operating profit margin of $33.46 per Boe in 1Q21                                                                                                 sheet
  ‒ Unhedged EBITDA3 of $31.97 per Boe in 1Q21

  ‒ Pre-hedge oil realization of 99% of NYMEX

  ‒ Weighted average barrel increasingly exposed to
    Brent-linked pricing                                                                                                                                  Enhanced
                                                                                                                                                          marketing
                                                                                                                                                         realizations

      1. Adjusted free cash flow total based on 2Q FY20 to 1Q FY21. Adjusted Free Cash Flow is a non-GAAP measure. Please see the appendix for reconciliations to the nearest GAAP measures.
      2. Estimated value for combined FCF generation from 2021-2023 at $50-$60/Bbl WTI utilizing a reinvestment rate of 75% for 2022 and 2023.
      3. Unhedged EBITDA excludes gain/loss on commodity derivative settlements.                                                                                                                              13
FINANCIAL POSITION
HIGHLIGHTS                                                                            CAPITALIZATION TABLE
▪ Path to further debt reduction                                                     $ Million                               1Q21
   − Adjusted FCF positive in 1Q21 despite winter storm impact
                                                                                     Cash                                     $24
   − Monetization opportunities improving with increasing commodity prices
                                                                                     Credit Facility                          $950
▪ Advancing our financial priorities
                                                                                     Second Lien Notes                        $517
   − Borrowing base reaffirmed at $1.6 billion as of May 3, 2021
   − Net Debt / LQA EBITDA1 estimated < 3x by 3Q21                                   Senior Notes                            $1,511
   − Bonds trading near par, no further Second Lien exchanges                        Total Net Debt                          $2,954
▪ Key near-term goals                                                                Total Borrowing Base                    $1,600
   − < 2.5x Net Debt / Adjusted EBITDA by YE 2022
   − Opportunistic refinancing of near-term maturities
   − Absolute debt reduction from organic free cash flow
      and asset monetizations

LONGER DATED MATURITIES

                                                          $543 Million                             $187 Million
                                                      6.25% Sr Notes Due                       8.25% Sr Notes Due

                                                                               $460 Million                             $321 Million
      No Maturities Before 2023
                                                                           6.125% Sr Notes Due                      6.375% Sr Notes Due

      2021                                2022                     2023          2024                  2025                 2026
                                                                                                         $517 Million
                                                                                RBL Maturity
                                                                                                       9% Secured Notes
      1. Annualized Adjusted EBITDA, a non-GAAP measure.

                                                                                                                                          14
GUIDING PRINCIPLES FOR A SUSTAINABLE BUSINESS

                                                        65% - 75%
                                                       Reinvestment
                                                           Rate
              < 5%
                                          Continued
         Year-Over-Year                      ESG
           Production                    Improvement
             Growth
                           Returning
                            Value to
                          Shareholders

          Commitment                                                   Commitment
         to Sustainable                                               to Life-of-Field
           Free Cash                                                        / Co-
              Flow                                                     development
APPENDIX

           16
2021 GUIDANCE
                                                                                                                                       PRIOR               PENDING
                                                                                                                                      GUIDANCE             GUIDANCE

Total production (MBoe/d)                                                                                                              90.0 - 92.0          89.0 - 91.0

  Oil                                                                                                                                     63%                  64%
  NGL                                                                                                                                     18%                  19%
  Gas                                                                                                                                     19%                  17%

Income statement expenses (in millions, except where noted)

 LOE, including workovers                                                                                                            $190.0 - $210.0      $185.0 - $205.0
 Gathering, Processing, and Transportation                                                                                            $70.0 - $80.0        $67.5 - $77.5
 Production and ad valorem taxes
                                                                                                                                          6.5%                 6.5%
 (% of total oil, natural gas, and NGL revenues)
 Adjusted G&A: cash component1                                                                                                        $35.0 - $45.0        $35.0 - $45.0

 Adjusted G&A: non-cash component2                                                                                                    $5.0 - $15.0         $5.0 - $15.0

 Cash interest expense, net                                                                                                           $80.0 - $90.0        $80.0 - $90.0

 Estimated effective income tax rate                                                                                                      22%                  22%

Capital expenditures (in millions, accrual basis)

 Total Operational Capital3                                                                                                              $430.0               $430.0

   Capitalized interest4                                                                                                             $95.0 - $105.0       $95.0 - $105.0

   Capitalized G&A                                                                                                                    $28.0 - $38.0        $28.0 - $38.0

Gross Operated Wells Drilled / Completed                                                                                            55 - 65 / 90 - 100   55 - 65 / 90 - 100

        1.   Excludes the change in fair value and amortization of share-based incentive awards and other non-recurring expenses.
        2.   Amortization of equity-settled, share based incentive awards and other non-recurring expenses.
        3.   Includes drilling, completions, facilities, and equipment, but excludes land, seismic, and capitalized expenses.                                                 17
        4.   Capitalized interest includes both cash and non-cash capitalized items.
OIL HEDGES(1)
                                                       2Q21               3Q21                4Q21            2Q21-4Q21              1Q22               2Q22            3Q22            4Q22             FY 2022
NYMEX WTI (Bbls, $/Bbl)
Sw aps
 Total Volumes                                           728,000            552,000             552,000           1,832,000            225,000          227,500         460,000         460,000          1,372,500
 Total Daily Volumes                                       8,000              6,000               6,000               6,662              2,500            2,500           5,000           5,000              3,760
    Avg. Sw ap                                            $44.98             $42.10              $42.10              $43.24             $60.00           $60.00          $60.00          $60.00             $60.00
Collars
    Total Volumes                                     2,776,025           2,772,325           2,750,450          8,298,800           1,440,000          910,000             -               -            2,350,000
    Total Daily Volumes                                  30,506              30,134              29,896             30,177              16,000           10,000             -               -                6,438
    Avg. Short Call Price                                $46.59              $49.14              $49.18             $48.30              $61.80           $61.88             -               -               $61.83
    Avg. Long Put Price                                  $39.30              $40.68              $40.73             $40.24              $48.13           $48.75             -               -               $48.37
Total WTI Volume Hedged (Bbls)                        3,504,025           3,324,325           3,302,450         10,130,800           1,665,000        1,137,500         460,000         460,000          3,722,500
 Average WTI Ceiling Price ($/Bbl)                       $46.26              $47.97              $47.99             $47.39              $61.55           $61.50          $60.00          $60.00             $61.15
 Average WTI Floor Price ($/Bbl)                         $40.48              $40.92              $40.96             $40.78              $49.73           $51.00          $60.00          $60.00             $52.66

ICE BRENT (Bbls, $/Bbl)
Sw aps
  Total Volumes                                          221,300                  -                   -             221,300                  -               -                -               -               -
  Total Daily Volumes                                      2,432                  -                   -                 805                  -               -                -               -               -
    Avg. Sw ap                                            $37.35                  -                   -              $37.35                  -               -                -               -               -
Collars
    Total Volumes                                        182,000            184,000             184,000             550,000                  -               -                -               -               -
    Total Daily Volumes                                    2,000              2,000               2,000               2,000                  -               -                -               -               -
    Avg. Short Call Price                                 $50.00             $50.00              $50.00              $50.00                  -               -                -               -               -
    Avg. Long Put Price                                   $45.00             $45.00              $45.00              $45.00                  -               -                -               -               -
Total Brent Volume Hedged (Bbls)                         403,300            184,000             184,000             771,300                  -               -                -               -               -
 Average Brent Ceiling Price ($/Bbl)                      $43.06             $50.00              $50.00              $46.37                  -               -                -               -               -
 Average Brent Floor Price ($/Bbl)                        $40.80             $45.00              $45.00              $42.81                  -               -                -               -               -

MAGELLAN EAST HOUSTON FIXED PRICE (Bbls, $/Bbl)
Collars
   Total Volumes                         409,500                                  -                   -             409,500            225,000          227,500               -               -           452,500
   Total Daily Volumes                     4,500                                  -                   -               1,489              2,500            2,500               -               -             2,500
   Avg. Short Call Price                  $47.00                                  -                   -              $47.00             $63.15           $63.15               -               -            $63.15
   Avg. Long Put Price                    $41.00                                  -                   -              $41.00             $51.25           $51.25               -               -            $51.25

MIDLAND-CUSHING DIFFERENTIAL (Bbls, $/Bbl)
Sw aps
 Total Volumes                             667,500                          612,000             892,400           2,171,900                  -               -                -               -               -
 Total Daily Volumes                         7,335                            6,652               9,700               7,898                  -               -                -               -               -
   Avg. Sw ap Price                          $0.21                            $0.13               $0.33               $0.24                  -               -                -               -               -
              1. Callon hedge portfolio as of 06/07/2021. In addition to the above hedges, Callon holds short the following positions: 13,220 bpd 2H21 WTI calls (avg. strike $63.62), 5,000 bpd Cal22
              $52.18-strike WTI swaptions. Callon owes deferred premiums for 2Q21-2Q22 of the following amounts ($MM): $6.7, $2.7, $2.7, $2.0, $0.9. In February 2021, we executed offsetting ICE
              Brent swaps on 159,300 Bbls, resulting in a locked-in loss of approximately $2.9 million which we will pay as the applicable contracts settle.                                                  18
GAS AND NGL HEDGES(1)
                                                      2Q21                3Q21                4Q21             2Q21-4Q21              1Q22               2Q22           3Q22         4Q22        FY 2022
NYMEX HENRY HUB (MMBtu, $/MMBtu)
Sw aps
 Total Volumes                                        3,822,000           3,864,000           3,437,000          11,123,000                   -          910,000        920,000      310,000     2,140,000
 Total Daily Volumes                                     42,000              42,000              37,359              40,447                   -           10,000         10,000        3,370         5,863
    Avg. Sw ap Price                                      $2.59               $2.59               $2.62               $2.60                   -            $2.65          $2.65        $2.65         $2.65
Collars
    Total Volumes                                     1,820,000           1,840,000           1,840,000           5,500,000           3,600,000              -              -            -       3,600,000
    Total Daily Volumes                                  20,000              20,000              20,000              20,000              40,000              -              -            -           9,863
    Avg. Short Call Price                                 $2.80               $2.80               $2.80               $2.80               $3.75              -              -            -           $3.75
    Avg. Long Put Price                                   $2.50               $2.50               $2.50               $2.50               $2.83              -              -            -           $2.83
Total NYMEX Volume Hedged (MMBtu)                     5,642,000           5,704,000           5,277,000          16,623,000           3,600,000          910,000        920,000      310,000     5,740,000
 Average NYMEX Ceiling Price ($/MMBtu)                    $2.66               $2.66               $2.69               $2.67               $3.75            $2.65          $2.65        $2.65         $3.34
 Average NYMEX Floor Price ($/MMBtu)                      $2.56               $2.56               $2.58               $2.57               $2.83            $2.65          $2.65        $2.65         $2.76

WAHA DIFFERENTIAL (MMBtu, $/MMBtu)
Sw aps
 Total Volumes                                        4,095,000           4,140,000           4,140,000          12,375,000           1,350,000        1,365,000       1,380,000    1,380,000    5,475,000
 Total Daily Volumes                                     45,000              45,000              45,000              45,000              15,000           15,000          15,000       15,000       15,000
   Avg. Sw ap Price                                      ($0.42)             ($0.42)             ($0.42)             ($0.42)             ($0.21)          ($0.21)         ($0.21)      ($0.21)      ($0.21)

MT. BELVIEU PURITY ETHANE (Bbls/$/Bbl)
Sw aps
 Total Volumes                                          455,000             460,000             460,000           1,375,000                   -                -             -            -            -
 Total Daily Volumes                                      5,000               5,000               5,000               5,000                   -                -             -            -            -
   Avg. Sw ap Price                                       $7.62               $7.62               $7.62               $7.62                   -                -             -            -            -

          1.   Callon hedge portfolio as of 06/07/2021. In addition to the above hedge positions, Callon holds short 20,000 mmbtu/d Cal21 calls (avg. strike $3.09).
                                                                                                                                                                                                      19
NON-GAAP ADJUSTED EBITDA1
($000s)                                                                                                                              1Q 21
Net loss                                                                                                                          ($80,407)
 Loss on derivative contracts                                                                                                      214,523
 Loss on commodity derivative settlements, net                                                                                     (62,280)
 Non-cash stock-based compensation expense                                                                                           7,608
 Other income                                                                                                                       (3,306)

 Income tax benefit                                                                                                                   (921)
 Interest expense                                                                                                                   24,416
 Depreciation, depletion and amortization                                                                                           70,987
Adjusted EBITDA                                                                                                                   $170,620
  Loss on commodity derivative settlements, net                                                                                     62,280
Unhedged EBITDA                                                                                                                   $232,900

Total MBOE                                                                                                                           7,286
Unhedged EBITDA per Boe                                                                                                             $31.97

           1. See “Important Disclosures” slide for additional information related to Supplemental Non-GAAP Financial Measures.

                                                                                                                                       20
NON-GAAP ADJUSTED FREE CASH FLOW1
($000s)                                                                                                                                                    2Q 20                      3Q 20                      4Q 20                     1Q 21
Net cash provided by operating activities                                                                                                               $97,801                  $135,701                   $134,578                 $137,665
 Changes in working capital and other                                                                                                                     40,078                     14,473                     12,011                    30,913
 Change in accrued hedge settlements                                                                                                                   (14,480)                     (5,993)                    (5,055)                   (20,117)
 Cash interest expense, net                                                                                                                               21,944                     24,246                     24,167                    22,159
 Merger and integration expense                                                                                                                             8,067                      2,465                      2,120                           --

Adjusted EBITDA                                                                                                                                       $153,410                   $170,892                   $167,821                 $170,620

Less: Operational capital expenditures (accrual)                                                                                                          85,087                     38,408                     87,488                    95,545
Less: Capitalized interest                                                                                                                                20,924                     20,675                     23,015                    21,817
Less: Interest expense, net of capitalized amounts                                                                                                        22,682                     24,683                     26,486                    22,159
Less: Capitalized cash G&A                                                                                                                                  6,740                      6,831                      6,465                    6,913
                                    2
Adjusted Free Cash Flow                                                                                                                                 $17,977                    $80,295                    $24,367                    $24,186

          1. See “Important Disclosures” slide for additional information related to Supplemental Non-GAAP Financial Measures.
          2. Effective January 1, 2021, non-cash interest expense amounts consisting primarily of amortization of debt issuance costs, premiums, and discounts associated with our long-term debt are excluded from our calculation of
             adjusted free cash flow.                                                                                                                                                                                                        21
NON-GAAP ADJUSTED G&A – CASH COMPONENT
AND FULL CASH G&A COSTS1
($000s)                                                                                                                           FY 20     1Q 21
Total G&A                                                                                                                        $37,187   $16,799
 Change in the fair value of liability share-based awards (non-cash)                                                               4,110   (5,943)
Adjusted G&A – total                                                                                                              41,297    10,856
 Equity-settled, share-based compensation (non-cash) and other non-recurring expenses                                            (7,771)   (1,665)
Adjusted G&A — cash component                                                                                                    $33,526    $9,191
 Capitalized cash G&A                                                                                                             27,606     6,913

Full Cash G&A                                                                                                                    $61,132   $16,104

          1. See “Important Disclosures” slide for additional information related to Supplemental Non-GAAP Financial Measures.

                                                                                                                                              22
NON-GAAP NET DEBT RECONCILIATION1
                                                                                                                                  As of March 31, 2021
                                                                                                                                              (in millions)

Long-term debt                                                                                                                                   $2,978

Less: Cash and cash equivalents                                                                                                                       24

Net Debt                                                                                                                                         $2,954

           1. See “Important Disclosures” slide for additional information related to Supplemental Non-GAAP Financial Measures.

                                                                                                                                                         23
You can also read