BARCLAYS GLOBAL CONSUMER STAPLES CONFERENCE - SEPTEMBER 2018 - Flowers Foods

Page created by Johnny Moody
 
CONTINUE READING
BARCLAYS GLOBAL CONSUMER STAPLES CONFERENCE - SEPTEMBER 2018 - Flowers Foods
BARCLAYS GLOBAL CONSUMER
STAPLES CONFERENCE         SEPTEMBER 2018

                                            1
BARCLAYS GLOBAL CONSUMER STAPLES CONFERENCE - SEPTEMBER 2018 - Flowers Foods
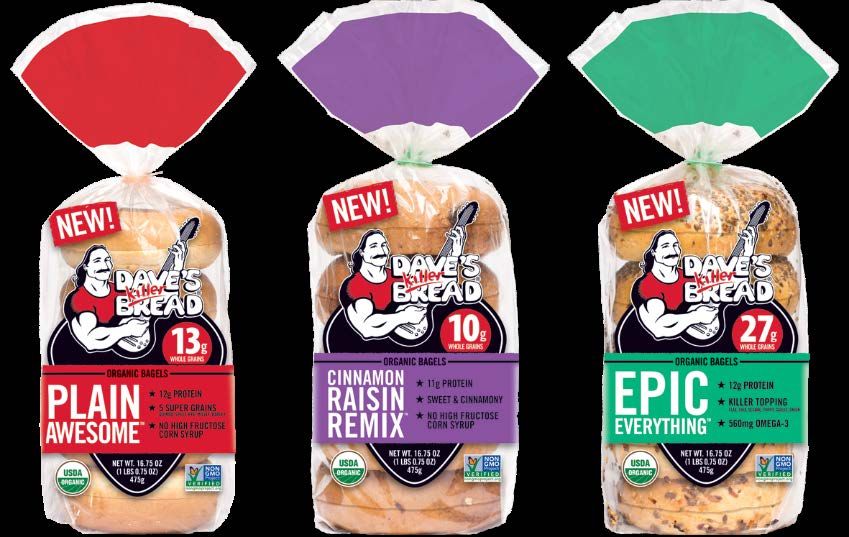
REGARDING FORWARD-LOOKING STATEMENTS

 Statements contained in this press release that are not historical facts are forward-looking statements. Forward-looking statements relate to current expectations regarding
 our future financial condition, performance and results of operations, planned capital expenditures, long-term objectives of management, supply and demand, pricing
 trends and market forces, and integration plans and expected benefits of transactions and are often identified by the use of words and phrases such as "anticipate,"
 "believe," "continue," "could," "estimate," "expect," "intend," "may," "plan," "predict," "project," "should," "will," "would," "is likely to," "is expected to" or "will continue," or
 the negative of these terms or other comparable terminology. All forward-looking statements are subject to risks and uncertainties that could cause actual results to differ
 from those projected. Other factors that may cause actual results to differ from the forward-looking statements contained in this release and that may affect the company's
 prospects in general include, but are not limited to, (a) general economic and business conditions and the competitive conditions in the baked foods industry, including
 promotional and price competition, (b) changes in consumer demand for our products, including changes in consumer behavior, trends and preferences, including health
 and whole grain trends, and the movement toward more inexpensive store-branded products, (c) the success of productivity improvements and new product introductions,
 (d) a significant reduction in business with any of our major customers including a reduction from adverse developments in any of our customer's business, including as a
 result of product recalls or safety concerns related to our products, (e) fluctuations in commodity pricing, (f) energy and raw material costs and availability and hedging and
 counterparty risk, (g) our ability to fully integrate recent acquisitions into our business, (h) our ability to achieve cash flow from capital expenditures and acquisitions and
 the availability of new acquisitions that build shareholder value, (i) our ability to successfully implement our business strategies, including those strategies the company has
 initiated under Project Centennial, which may involve, among other things, the integration of recent acquisitions or the acquisition or disposition of assets at presently
 targeted values, the deployment of new systems and technology and an enhanced organizational structure, (j) consolidation within the baking industry and related
 industries, (k) disruptions in our direct-store delivery system, including litigation or an adverse ruling from a court or regulatory or government body that could affect the
 independent contractor classification of our independent distributors, (l) increasing legal complexity and legal proceedings that we are or may become subject to, (m)
 product recalls or safety concerns related to our products, and (n) the failure of our information technology systems to perform adequately, including any interruptions,
 intrusions or security breaches of such systems. The foregoing list of important factors does not include all such factors, nor necessarily present them in order of
 importance. In addition, you should consult other public disclosures made by the company, including the risk factors included in our most recently filed Annual Report on
 Form 10-K and Quarterly Reports on Form 10-Q filed with the Securities and Exchange Commission ("SEC") and disclosures made in other filings with the SEC and company
 press releases, for other factors that may cause actual results to differ materially from those projected by the company. We caution you not to place undue reliance on
 forward-looking statements, as they speak only as of the date made and are inherently uncertain. The company undertakes no obligation to publicly revise or update such
 statements, except as required by law.

                                                                                                                                                                                           2
BARCLAYS GLOBAL CONSUMER STAPLES CONFERENCE - SEPTEMBER 2018 - Flowers Foods
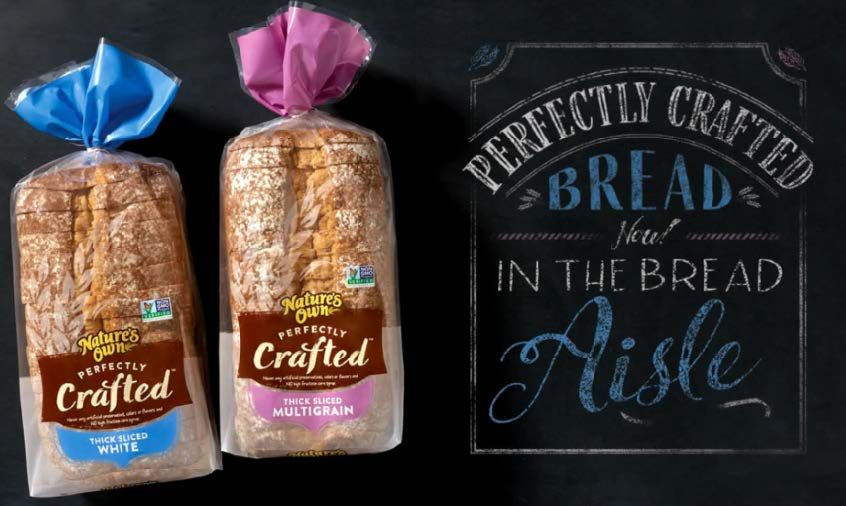
PRESENTERS AND AGENDA

               Allen L. Shiver                          R. Steve Kinsey
               President &                              Chief Financial Officer &
               Chief Executive Officer                  Chief Administrative Officer

 •   Business & Category Overview        •   Profit Initiatives Update

 •   Growth Initiatives Update           •   Financial Review & Outlook

                                                                                       3
BARCLAYS GLOBAL CONSUMER STAPLES CONFERENCE - SEPTEMBER 2018 - Flowers Foods
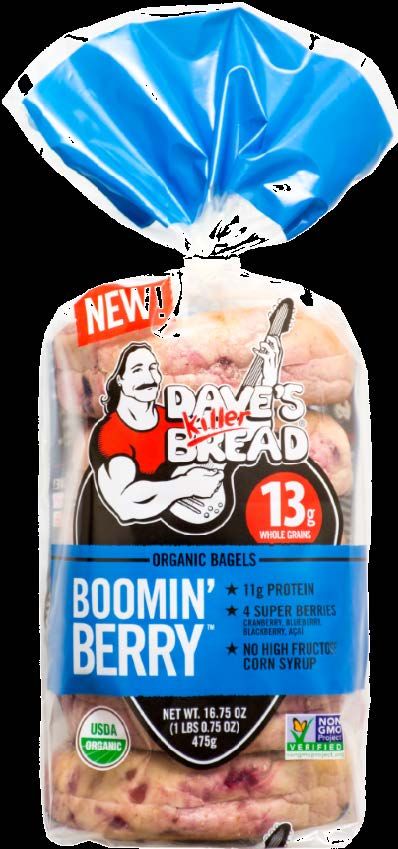
LEADING FRESH BAKERY BRANDS DRIVE OUR BUSINESS

  Sales Overview                                                           Brand Portfolio Highlights
  TTM* Sales $3.9 billion
                                                Branded                                   #1 loaf bread brand
                                                 breads
                                                  49%
         Store
      branded
         retail                                                                           #1 organic bread brand
          16%
                    Branded retail
                        59%
     Non-retail &
       other
        24%                                                                               98% consumer awareness

                                            Branded snack
                                                cakes
                                                 11%
                                                                                          Iconic snack cakes since 1914

                      * 52 weeks ended Q2 2018
                      Source: SDW DSD + WD 52 Weeks Ending July 14, 2018                                                  4
BARCLAYS GLOBAL CONSUMER STAPLES CONFERENCE - SEPTEMBER 2018 - Flowers Foods
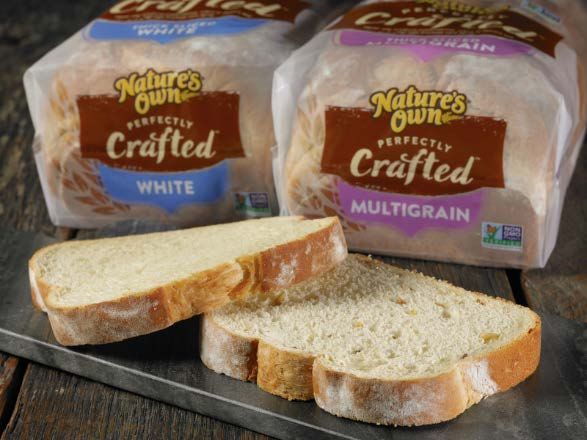
BROAD SCALE IS A PLATFORM FOR PROFITABLE GROWTH

  47                                                          Channels served
                                                              •   Grocery / Mass / Club
  Operating bakeries                                          •   Natural & Organic
                                                              •   Discount / C-store
                                                              •   Foodservice & Vending
  Direct-store-distribution access to
                                                              •   E-commerce

          85%                          of the U.S.

                                                                                          5,500
                                                              9,800
                                       population

    Warehouse                                                 employees                   independent
    distribution     NATIONWIDE                                                            distributors

                     Information as of year-end fiscal 2017                                               5
BARCLAYS GLOBAL CONSUMER STAPLES CONFERENCE - SEPTEMBER 2018 - Flowers Foods
MULTI-YEAR TRANSFORMATION UNDERWAY

         PROJECT CENTENNIAL
         STRATEGIC PRIORITIES                      FY17
                                                   • Attacked indirect spend
                                                   • Clarified brand roles
  DRIVE           • Reinvigorate the Core
  GROWTH          • Capitalize on Adjacencies      FY18
                                                   • Streamlining organization
                                                   • Investing in capabilities and brands

  IMPROVE         • Generate Fuel for Growth       FY19 and beyond
  PROFITABILITY   • Develop Leading Capabilities
                                                   • Optimize supply chain
                                                   • Grow sales with innovation,
                                                     adjacencies, and proactive M&A
                                                   • EBITDA margin goal: 13-14%

                                                                                            6
BARCLAYS GLOBAL CONSUMER STAPLES CONFERENCE - SEPTEMBER 2018 - Flowers Foods
FRESH BAKERY MARKET IS LARGE AND GROWING

                                                                                                       US Fresh Bakery - Retail Outlets(1)
 Retail Outlets = $24.1 billion(1)

                                                                           Billions
                                                                                                                        $23.7      $23.9     $24.1
                                                                                      $25 .0

                                                                                               $22.5         $23.1
  •   Fresh packaged breads                                                           $20 .0

  •   Commercial cake
      Tortillas
                                                                                      $15 .0

  •
                                                                                      $10 .0

 Foodservice = $7.4 billion(2)                                                         $5. 0

      Fresh and frozen breads, buns, rolls
                                                                                       $0. 0

  •                                                                                            2013          2014       2015       2016      2017

                  (1) Data for Retail Outlets sourced from IRI. FY 2017.
                  (2) Data for Foodservice sourced from Techonomic 2017                                                                              7
BARCLAYS GLOBAL CONSUMER STAPLES CONFERENCE - SEPTEMBER 2018 - Flowers Foods
STRONG COMPETITIVE POSITION

Flowers is growing share with differentiated products

       Fresh Packaged Bread Dollar Share                                                                        Flowers Dollar Share
                                                                                                               Fresh Packaged Breads

                               FLOWERS, 15.9
                                                                                                                                             15.9
            STORE BRAND,
                24.5                                                                                                               15.4
                                                                                                              15.1       15.1
                                      BBU, 29.6
            INDEPENDENT                                                                     14.7
             BAKERS, 24.2

                                     PEPPERIDGE                                         Q2 2014            Q2 2015      Q2 2016   Q2 2017   Q2 2018
                                      FARM, 5.8

                     IRI Flowers custom data base Total US Multi Outlet + Convenience – 12 weeks ending July 15, 2018                                 8
BARCLAYS GLOBAL CONSUMER STAPLES CONFERENCE - SEPTEMBER 2018 - Flowers Foods
POSITIVE UNDERLYING CONSUMER TRENDS

Strong demand for differentiated products
                                                                                                           Organic Fresh Packaged Bread Market
          Store Brand Fresh Packaged Breads Share                                                          Organic Fresh Packaged Bread Market
                                                                                                                                                     $566.1
  26.9%
                                                                                                           Flowers organic               $490.4
             26.5%
                                                                                                           bread share:
                      26.0%
                                                                                                           58.5                 $357.8
                                                                                                                       $275.5
                                     24.9%
                                                      24.6%                                                  $220.9
                                                                      24.4%                       $179.8

  13 FY       14 FY    15 FY          16 FY            17 FY         52 WE                         13 FY       14 FY    15 FY    16 FY    17 FY   52 WE 07/15/18
                                                                    07/15/18

                               Source: IRI Custom Database Total US Multi Outlet + Convenience.                                                                    9
BARCLAYS GLOBAL CONSUMER STAPLES CONFERENCE - SEPTEMBER 2018 - Flowers Foods
TODAY’S CONSUMER

The market is changing as consumers expect more from their food

    MORE RELEVANT             MORE INNOVATIVE           MORE CHANNELS
 Fitting lifestyle, values   Seeking the different   Increasing accessibility

                                                                                10
STRATEGIC PRIORITIES TO CREATE VALUE

            DRIVE GROWTH                  IMPROVE PROFITABILITY
      •   Reinvigorate the Core       •   Generate Fuel for Growth
      •   Capitalize on Adjacencies   •   Develop Leading Capabilities

                                                                         11
REINVIGORATING THE CORE BUSINESS

                New Nature’s Own
                Perfectly Crafted reflects
                investments in brand
                growth and innovation        The Wonder/USO
                                             partnership drove
                                              in-store displays

                                                                  12
DKB GROWTH CONTINUES

Product launch in 17Q2 more than doubled share in Breakfast Segment
                                                                                                                Total DKB Retail Sales
                                                                                                                    (in millions)
                                                                                                                                     $83.0

                                                                                                                       +45.8%
                                                                                                    $56.9

                                                                                                     17Q2                                18Q2

                Source: IRI Custom Database Total US Multi Outlet + Convenience, 12 weeks ended July 15, 2018                                   13
MARKET SHARE OPPORTUNITIES BEYOND LOAF BREADS

                              #1 in
                         Traditional Loaf                      Brand extensions and M&A in adjacent segments

                            $4.0
                 $4. 5
      Billions

                 $4. 0

                 $3. 5
                                                                                                                                       $3.4
                 $3. 0

                 $2. 5

                                                               $1.9                                $1.9
                                     $1.6
                 $2. 0

                 $1. 5

                 $1. 0

                                                                         $0.3                                 $0.3
                                                                                                                                              $0.1
                 $0. 5

                 $0. 0

                           Traditional Loaf            Specialty/Premium Loaf                  Sandwich Bun/Roll                  Breakfast/Dinner/Other

                                                                    Total Branded                       FLO

                               IRI Flowers custom data base Total US Multi Outlet + Convenience – 52 weeks ending July 15, 2018                            14
UNDERDEVELOPED GEOGRAPHIES ALSO A STRATEGIC FOCUS
Bolt-on acquisitions are a key part of our growth strategy

  California & West                                   Great Lakes & Plains                                                          7.2
                                                                                4.7
                    13.7                                                                                                   37.8
                                                                                                                                          32.3
          24.5                                                                         27.1
                                                                 41.8
                         37.0                                                                                                     22.7
          24.8
                                                                               26.4
                                                                                                                                         Northeast

                                                                                              22.1                                           FLOWERS
                                                                                                                    28.2
                        Mid South, South Central,                                                                                                BBU
                              & Southeast                                                                                                  STORE BRAND
                                                                                             24.1             25.6                         OTHER BRAND

                 IRI Flowers custom data base Total US Multi Outlet + Convenience – 12 weeks ending July 15, 2018                                        15
CAPITALIZE ON PRODUCT ADJACENCIES

Build on leading foodservice position
 • Expanding share of growing specialty products
     o   Moving beyond loaf and bun
     o   Breakfast items, dinner rolls are opportunities to increase share
                                                                               Expand position and
                                                                             diversify in high-growth
Grow in-store bakery/deli                                                       bakery categories
 • Grow specialty brands on the store perimeter

Grow in baked snacks
 • Evolve cake strategy to leverage dual-brand capabilities
 • Further diversify into snacking occasions

                                                                                                    16
STRATEGIC PRIORITIES TO CREATE VALUE

            DRIVE GROWTH                  IMPROVE PROFITABILITY
      •   Reinvigorate the Core       •   Generate Fuel for Growth
      •   Capitalize on Adjacencies   •   Develop Leading Capabilities

                                                                         17
FOCUSED ON REDUCING COSTS AND BUILDING CAPABILITIES

         PG&S                                             ORGANIZATION              SCO2
    $45m+ of gross                                          Headcount      Launched initiatives to
    savings realized                                      reduced ~9%1      achieve margin goals

              1.   Employee count per form 10-K, FY 17 compared to FY 16                             18
              2.   Supply chain optimization
PROGRESS ON SAVINGS INITIATIVES

PG&S, SCO, and Org cost savings initiatives are on track

      Gross Savings from Tracked Initiatives   •   Anticipating 2018 input cost inflation
                                                   of ~$40 million
                                $38M-$48M
                                               •   Incremental brand investments
       $32M
                                               •   Inflationary pressures in
                                                   commodities, wages, and freight
                                               •   Taking action to address inflationary
                                                   pressures
       17FY-Act                    18FY-Est

                                                                                            19
WORKING CAPITAL IMPROVEMENT ENHANCING CASH FLOW

       Trade Working Capital                                                                     Operating Cash Flow Details
                                                                                                          $ 357.7 *
                                  $45M YOY                                                 $ 322.2           40.0
        $ 200                      decrease                                                                  27.2
                                                                                                             17.5
                                                                                                                      *Excludes the following:
                                       $ 155
                                                                                                                        Pension Contributions
                                                                                                                        VSIP (1)
                                                                                                                        MEPP (2)
                                                                                                            273.0       Operating Cash Flow

        17Q2                           18Q2                                              17Q2-TTM        18Q2-TTM
            Trade Working Capital = Accounts receivable plus Inventories less Accounts Payable
            (1) VSIP = Voluntary Separation Incentive Program                                                                                    20
            (2) MEPP = Multi-Employer Pension Plan
SECOND QUARTER 2018 SUMMARY:

 •   Sales grew 1.6% – achieved record second quarter sales

 •   Increased investments to drive consumer trial of new products

 •   Experienced inflationary cost pressures from commodities, labor, and transportation

 •   Addressed operational disruptions caused by inferior yeast

 •   Appointed COO to better align operations and enhance execution and accountability

                                                                                           21
FY 2018 OUTLOOK

 Revenue Change                                          Flat to +1.6%
                                                                                                           Risk Factors Impacting Back-Half:
 GAAP EPS                                             $0.91 to $0.97
                                                                                                          • Sales comparisons in quarter could be affected
                                                                                                            by significant weather activity last year.
 Adjusted EPS(1)                                      $1.00 to $1.07
                                                                                                          • Inferior yeast received in 18Q2 may result in
 Other                                                                                                      softer-than-expected sales volumes.

                                              $145 to $150 million                                        • Labor markets remain tight with higher wages.
 Depreciation & Amortization
 Net interest expense                              $11 to $12 million                                     • Higher bakery workforce turnover is driving
                                                                                                            reduced manufacturing efficiencies.
 Effective tax rate                                    25.0% to 26.0%
                                                                                                          • Freight and commodity inflation continues.
 Diluted shares outstanding                              ~211.0 million
 Capital expenditures                           $95 to $105 million

                        (1) Adjusted for matters affecting comparability. See non-GAAP reconciliations at the end of this slide presentation.                22
LONG-TERM TRENDS & COST COMPONENTS

                                                                                                                                               Components of Adj EBITDA**
Stable sales and margin profile                                                                                                                     % of 17FY Sales

                                                              Sales            Adj EBITDA Mgn**
                                                                                                                                                                 Adj.
            4.5                                                                                      14.0%                                                     EBITDA**
 Billions

                                                                                                                                                                11.5%
            4.0                                                                                                                                                              Ing & Pkg
                                                                                                     12.0%
                                                                                                                                                                               28.7%

                                                                                                               EBITDA % of Sales
            3.5                                                                                                                              SG&A and
                                                                                                     10.0%                                     Other
            3.0
                                                                                                                                               14.6%
            2.5                                                                                      8.0%

            2.0                                                                                      6.0%
                                                                                                                                                    Shipping/
            1.5                                                                                                                                                           Conversion***
                                                                                                     4.0%                                          Distribution
            1.0                                                                                                                                       22.7%                  22.5%
                                                                                                     2.0%
            0.5

             -                                                                                       0.0%
                  04FY 05FY 06FY 07FY 08FY* 09FY 10FY 11FY 12FY 13FY 14FY* 15FY 16FY 17FY

                                           * 53-week year;
                                           ** Adjusted for items affecting comparability. See non-GAAP reconciliations at the end of the slide presentation.                              23
                                           *** Includes direct labor and indirect manufacturing expenses.
BALANCED CAPITAL ALLOCATION

Focused on consistent, prudent use of capital
          Dividends             Share Repurchases          Cash for Acquisitions
                                                                                   Capital Allocation Principles:
                      $416                        $395                             • Drive core business growth

      $318                                                                         • Strong dividend
                                                                                   • Investment grade credit rating

                                                                            $3     • Accretive acquisitions
                                                      $7       $126
       $19                 $9        $39
                                                               $131        $141
                                                                                   • Opportunistic share repurchases
       $86             $93           $102         $120

      12FY            13FY          14FY*         15FY         16FY        17FY
   (Amounts in millions)

                                      *53-week year                                                                    24
INVESTMENT-GRADE FINANCIAL POSITION

Maintaining flexibility to capitalize on value-creating opportunities

 Total Debt & Capital Leases                                     Aggregate Maturities at 18Q2
                                                                                                              $402   $406
                         $1,005                                          Total Debt & Capital Leases
   $919                           $958
                                            $832        $826
                  $759                                                            At 18Q2,
                                                                           leverage ratio of 1.8X,
                                                                         ~$677M available liquidity
                                                                          on undrawn borrowing
                                   Since end of fiscal 2015,
                                                                               arrangements
                                    Reduced total debt and
                                  capital lease obligations by
                                             $179M

                                                                   $5          $11         $5           $4
   13FY           14FY   15FY     16FY      17FY        18Q2      18FY        19FY       20FY          21FY   22FY   23FY+
 (Amounts in millions)

                                                                                                                             25
OBJECTIVES FOR 2019 & BEYOND

Well-positioned to deliver solid returns over the long-term

• Deliver organic sales growth above categories

• Pursue accretive M&A opportunities
• Target long-term sales growth of 3% to 4%
• Execute on initiatives to realize 250bps of EBITDA margin expansion by fiscal 2021

• Achieve long-term EPS CAGR of 8%-10%
• Dividend yield of 2%-3%

                                                                                       26
FLOWERS LONG-TERM OPPORTUNITY

Well-positioned to deliver top-tier shareholder returns

 Leader in a huge category that is relevant
 to consumers and profitable for retailers

 Has strong competitive advantages                        Clear strategic
 and a robust platform for continued growth               priorities to create
                                                          shareholder value
 Adapting to an ever-changing marketplace
 to drive shareholder value

                                                                                 27
REGARDING NON-GAAP FINANCIAL MEASURES

The company prepares its consolidated financial statements in accordance with U.S. Generally Accepted Accounting Principles (GAAP). However, from time to time, the company may
present in its public statements, press releases and SEC filings, non-GAAP financial measures such as, EBITDA, adjusted EBITDA, adjusted EBIT, EBITDA margin, adjusted EBITDA margin,
adjusted net income, adjusted operating income, adjusted operating income by segment, adjusted EBIT by segment, adjusted EPS, adjusted income tax expense, adjusted selling,
distribution and administrative expenses (SD&A), gross margin excluding depreciation and amortization and the ratio of net debt to adjusted EBITDA. The reconciliations attached provide
reconciliations of the non-GAAP measures used in this presentation or release to the most comparable GAAP financial measure. The company’s definitions of these non-GAAP measures
may differ from similarly titled measures used by others. These non-GAAP measures should be considered supplemental to, and not a substitute for, financial information prepared in
accordance with GAAP. The company defines EBITDA as earnings from continuing operations before interest, income taxes, depreciation, amortization and income attributable to non-
controlling interest. The company believes that EBITDA is a useful tool for managing the operations of its business and is an indicator of the company's ability to incur and service
indebtedness and generate free cash flow. EBITDA is used as the primary performance measure in the company's 2014 Omnibus Equity and Incentive Compensation Plan. Furthermore,
pursuant to the terms of our credit facility, EBITDA is used to determine the company's compliance with certain financial covenants. The company also believes that EBITDA measures are
commonly reported and widely used by investors and other interested parties as measures of a company's operating performance and debt servicing ability because EBITDA measures
assist in comparing performance on a consistent basis without regard to depreciation or amortization, which can vary significantly depending upon accounting methods and non-operating
factors (such as historical cost). EBITDA is also a widely-accepted financial indicator of a company's ability to incur and service indebtedness. EBITDA should not be considered an
alternative to (a) income from operations or net income (loss) as a measure of operating performance; (b) cash flows provided by operating, investing and financing activities (as
determined in accordance with GAAP) as a measure of the company's ability to meet its cash needs; or (c) any other indicator of performance or liquidity that has been determined in
accordance with GAAP. The company defines adjusted EBITDA, adjusted EBIT, EBITDA margin, adjusted EBITDA margin, adjusted net income, adjusted operating income, adjusted
operating income by segment, adjusted EBIT by segment, adjusted EPS, adjusted income tax expense, adjusted selling, distribution and administrative expenses (SD&A), respectively,
excluding the impact of asset impairment charges, Project Centennial consulting costs, lease terminations and legal settlements, acquisition-related costs, and pension plan settlements.
Adjusted income tax expense also excludes the impact of tax reform. The company believes that these measures, when considered together with its GAAP financial results, provides
management and investors with a more complete understanding of its business operating results, including underlying trends, by excluding the effects of certain charges. Net debt to
EBITDA is used as a measure of financial leverage employed by the company. Gross margin excluding depreciation and amortization is used as a performance measure to provide additional
transparent information regarding our results of operations on a consolidated and segment basis. Changes in depreciation and amortization are separately discussed and include
depreciation and amortization for materials, supplies, labor and other production costs and operating activities. Presentation of gross margin includes depreciation and amortization in the
materials, supplies, labor and other production costs according to GAAP. Our method of presenting gross margin excludes the depreciation and amortization components, as discussed
above. The reconciliations attached provide reconciliations of the non-GAAP measures used in this presentation or release to the most comparable GAAP financial measure.

                                                                                                                                                                                               28
RECONCILIATION OF NON-GAAP FINANCIAL MEASURES

                                                                                                              Flowers Foods
                                                                                            Reconciliation of Net Income to Adjusted EBITDA
                                                                                                             (000's omitted)

                                                               17FY        16FY        15FY        14FY        13FY        12FY        11FY         10FY        09FY        08FY        07FY        06FY        05FY        04FY

Net Income attributable to Flowers Foods, Inc.               $ 150,120 $ 163,776 $      189,191 $ 175,739 $     230,894 $ 136,121 $ 123,428 $ 137,047 $ 130,297 $ 119,233 $ 94,615 $ 81,043 $ 61,231 $ 50,774
   (Income)/loss from discontinued operations, net of tax          -         -              -         -             -         -         -         -           -         -         -    (6,731)    1,627     3,486
   Cumulative effect of a change in accounting principle           -         -              -         -             -         -         -         -           -         -         -       568         -         -
   Net income attributable to noncontrolling interest              -         -              -         -             -         -         -         -       3,415     3,074     3,500     3,255     2,904     1,769
   Income tax expense (benefit)                                   (827)   85,761        103,840    92,315        91,479    72,651    68,538    73,333    74,047    67,744    54,970    45,304    39,861    35,071
   Interest income, net                                         13,619    14,353          4,848     7,341        12,860     9,739    (2,940)   (4,518)   (1,426)   (7,349)   (8,404)   (4,946)   (6,337)   (8,826)
   Depreciation and amortization                               146,719   140,869        132,175   128,961       118,491   102,690    94,638    85,118    80,928    73,312    66,094    64,250    59,344    56,702
EBITDA from Continuing Operations                              309,631   404,759        430,054   404,356       453,724   321,201   283,664   290,980   287,261   256,014   210,775   182,743   158,630   138,976
   Asset impairment and facility closure costs/divestiture         -      24,877          4,507     9,301           -         -       4,414       -         -         -         -         -         -         -
   Lease termination depreciation impact                        (1,844)      -              -         -             -         -         -         -         -         -         -         -         -         -
   Multi-employer pension plan withdrawal costs                 18,268       -              -         -             -         -         -         -         -         -         -         -         -         -
   Pension plan settlement loss                                  4,649     6,646            -      15,387           -         -         -         -         -         -         -         -         -         -
   Legal settlement                                              6,543    10,500            -         -             -         -         -         -         -         -         -         -         -         -
   Project Centennial consulting costs                          37,306     6,324            -         -             -         -         -         -         -         -         -         -         -         -
   Restructuring and related impairment charges                104,130       -              -         -             -         -         -         -         -         -         -         -         -         -
   Acquisition-related costs                                       -         -            6,187       -          17,776     9,560     6,240       -         -         -         -         -         -         -
   Divestiture/Bargain purchase gain                           (28,875)      -              -         -         (50,071)      -         -         -         -         -         -         -         -         -
Adjusted EBITDA                                              $ 449,808 $ 453,106 $      440,748 $ 429,044 $     421,429 $ 330,761 $ 294,318 $ 290,980 $ 287,261 $ 256,014 $ 210,775 $ 182,743 $ 158,630 $ 138,976

Net Sales                                                    $ 3,920,733 $ 3,926,885 $ 3,778,505 $ 3,748,973 $ 3,732,616 $ 3,031,124 $ 2,759,367 $ 2,560,787 $ 2,600,849 $ 2,414,892 $ 2,036,674 $ 1,888,654 $ 1,715,869 $ 1,551,308

Adjusted EBITDA Margin                                           11.5%       11.5%        11.7%       11.4%       11.3%       10.9%       10.7%       11.4%       11.0%       10.6%       10.3%        9.7%        9.2%         9.0%

                                                                                                                                                                                                                               29
RECONCILIATION OF NON-GAAP FINANCIAL MEASURES
                                                                    Flowers Foods, Inc.
                                                      Reconciliation of GAAP to Non-GAAP Measures
                                                                       (000's omitted)

                                               Reconciliation of Net Income (Loss) to Adjusted EBITDA

                                                   For the 12 Week       For the 12 Week          For the 16 Week        For the 12 Week        Trailing 52 Week
                                                    Period Ended          Period Ended             Period Ended           Period Ended            Period Ended
                                                   October 7, 2017      December 30, 2017          April 21, 2018          July 14, 2018          July 14, 2018

Net income (loss)                              $            (33,571)    $           78,533    $             51,247   $             45,442   $            141,651
Income tax expense (benefit)                                (22,925)               (34,709)                 18,534                  4,337                (34,763)
Interest expense, net                                         2,730                  2,563                   2,901                  1,748                  9,942
Depreciation and amortization                                32,972                 32,431                  44,189                 35,098                144,690
EBITDA (loss)                                               (20,794)                78,818                 116,871                 86,625                261,520
Project Centennial consulting costs                           7,050                  5,461                   6,432                  2,215                 21,158
Restructuring and related impairment charges                100,549                  3,581                   1,259                    801                106,190
Multi-employer pension plan withdrawal costs                 18,268                      -                   2,322                      -                 20,590
Pension plan settlement loss                                  3,030                  1,619                   4,668                  1,035                 10,352
Legal settlement                                              4,253                  1,475                   1,350                  8,345                 15,423
Loss on inferior ingredients                                      -                      -                       -                  3,884                  3,884
Adjusted EBITDA                                $            112,356     $           90,954    $            132,902   $            102,905   $            439,117

                                                                                                                                                                   30
RECONCILIATION OF NON-GAAP FINANCIAL MEASURES

                                              Flowers Foods, Inc.
                                Reconciliation of GAAP to Non-GAAP Measures
                                                (000's omitted)

                           Reconciliation of Debt to Net Debt and Calculation of Net
                            Debt to Trailing Twelve Month Adjusted EBITDA Ratio

                                                                                         As of
                                                                                     July 14, 2018
       Current maturities of long-term debt and capital lease obligations          $            9,706
       Long-term debt and capital lease obligations                                           816,126
       Total debt and capital lease obligations                                               825,832
       Less: Cash and cash equivalents                                                         29,554
       Net Debt                                                                    $          796,278

       Adjusted EBITDA for the Trailing Twelve Months Ended July 14, 2018          $         439,117
       Ratio of Net Debt to Trailing Twelve Month EBITDA                                         1.8

                                                                                                        31
RECONCILIATION OF NON-GAAP FINANCIAL MEASURES

                                                       Flowers Foods, Inc.
                                         Reconciliation of GAAP to Non-GAAP Measures

                                                                    Reconciliation of Earnings per Share - Full Year Fiscal
                                                                                       2018 Guidance
                                                                                       Range Estimate
     Net income per diluted common share                            $                   0.91 to   $                   0.97
     Project Centennial reorganization and consulting costs                             0.04                          0.05
     Loss on inferior ingredients                                                       0.02                          0.02
     Legal settlements                                                                  0.03                          0.03
     Pension plan settlement loss                                                       0.02                          0.02
     Multi-employer pension plan withdrawal costs                                       0.01                          0.01
     Adjustment to prior year provisional tax reform benefit                           (0.03)                        (0.03)
     Adjusted net income per diluted common share                   $                   1.00 to    $                  1.07

                                                                                                                              32
You can also read