Unaudited Group Interim Results for the six months ended 31 March 2021
←
→
Page content transcription
If your browser does not render page correctly, please read the page content below

Unaudited Group Interim Results
for the six months ended
31 March 2021

                                  1
Overview

Peter Wharton-Hood Group Chief Executive

                                           2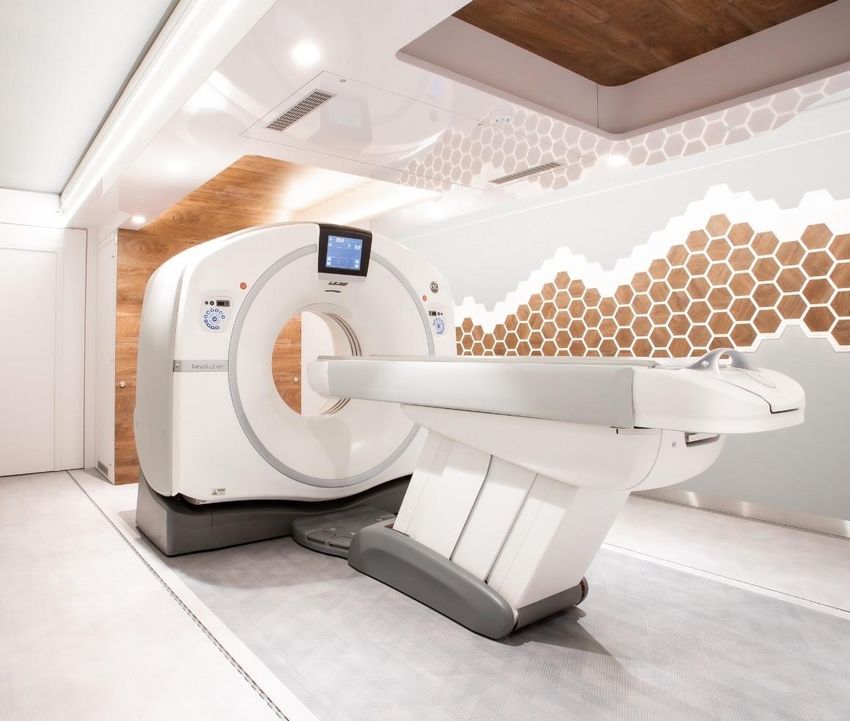
VISION AND STRATEGIC FOCUS AREAS

                                         Our vision is to be a global, people-centred,
                                             diversified healthcare organisation

                                           Global                             Diversified         Clinical excellence,
                                         healthcare                            offering              analytics and
                                          provider                                                    technology

                     1                   Offering an                     2   With a growing   3
                                                                                                        Focus on our
                                          integrated                             share of         employees, clinicians,
                                      healthcare model                         revenue and        clinical excellence and
                                        and diagnostic                           earnings           using analytics and
                                      imaging capability                     from non-acute            technology to
                                                                                 sources             positively impact
                                                                                                        patient care

Unaudited Group interim results for the six months ended 31 March 2021                                                      3
STRATEGIC PILLARS

                QUALITY                                              EFFICIENCY              SUSTAINABILITY         GROWTH

                                                                    Deliver cost-effective        Effectively
                      Deliver                                                                                           Continue
                                                                         care through our       engage with our
                 market-leading                                                                                          to grow
                                                                   employees, clinicians,        stakeholders
                   quality care                                                                                      our businesses,
                                                                     efficient processes,        to ensure our
                        and                                                                                               while
                                                                          and the use of          long-term
              patient experience                                                                                       diversifying
                                                                    technology, research         sustainability
                                                                                                                  our sources of revenue
                                                                         and innovation

Unaudited Group interim results for the six months ended 31 March 2021                                                                 4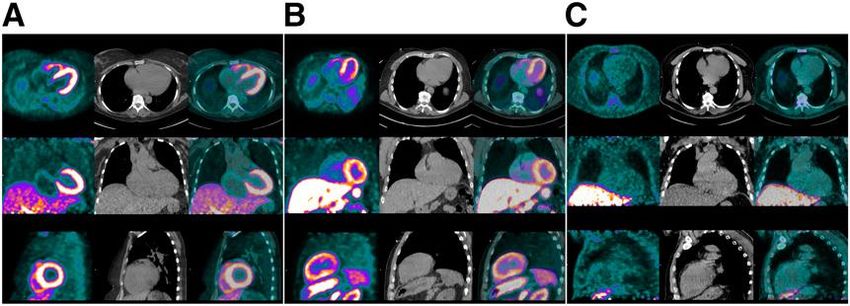
GROUP OVERVIEW
IMPROVED OPERATING PERFORMANCE DESPITE ONGOING COVID-19 PANDEMIC

                      Revenue                                  EPS from continuing
                   from continuing                              and discontinued                             Disposal of Scanmed                          Strong financial position
                     operations1                                   operations                                with net proceeds of
                                                                                                                                                              Undrawn facilities
                      R13.0 billion                                      55.9 cents                                R681 million                                of R6.4 billion
                         +4.0%                                             +4.1%

                                                              Excellent Alliance
            Business benefitting from                                                                      Improving performance
                                                             Medical Group (AMG)                                                                                Net debt/
             diversification strategy                                                                       in southern Africa (SA)
                                                                performance                                                                                 normalised EBITDA⁴
              across territories and                                                                             despite severe
                                                               Revenue2 +17%                                    nd                                                2.78x
                  business lines                                                                              2 COVID-19 wave
                                                           Normalised EBITDA2,3 +38%

            1 Scanmed S.A.   (Scanmed) was disposed of during the period and has been classified as a discontinued operation
            2 Based  on management accounts: Constant EUR/GBP currency of 1.2 and excludes impact of long-term incentives
            3 Life Healthcare defines normalised EBITDA as operating profit before depreciation on property, plant and equipment, amortisation of intangible assets and non-trading-related

            costs and income
            ⁴ Calculated in terms of lender agreements

Unaudited Group interim results for the six months ended 31 March 2021                                                                                                                        5
GROUP OVERVIEW
KEY OBJECTIVES FOR 2021
                                                                         Objectives                            Progress

 Operational efficiency
                                             ▪ Restore the business to pre-COVID-19 levels    ▪ Higher margins in AMG
                                                                                              ▪ Margin improvement in SA

                                             ▪ Deliver high quality outcomes                  ▪ Consistent quality outcomes
     High quality care

   Radiology partner of                      ▪ Grow AMG business in United Kingdom (UK)       ▪ Additional contracts and COVID-19 solutions
          choice                               and Europe as a key partner to public sector     with public sector in UK and Europe

                                             ▪ Enter SA imaging market                        ▪ Good progress made
          SA imaging
                                                                                              ▪ HPSCA application to employ radiographers

                                             ▪ Review and optimise the current asset          ▪ Scanmed disposal completed
      Portfolio review
                                               portfolio

Unaudited Group interim results for the six months ended 31 March 2021                                                                  6
GROUP OVERVIEW
CONTINUED PROGRESS IN DIVERSIFYING REVENUE AND NORMALISED EBITDA MIX
GEOGRAPHICALLY AND GROWING NON-ACUTE HEALTHCARE SERVICES

                                                             Normalised                        Acute versus
             Revenue (%)
                                                              EBITDA (%)                   non-acute revenue (%)

     26%                 25%                         22%       23%       21%               25%
               29%                 30%                                                             28%     30%
                                                                                  38%                                 36%

     74%                 75%                         78%       77%       79%               75%
               71%                 70%                                                             72%     70%
                                                                                  62%                                 64%

     2018      2019      2020      2021              2018      2019      2020     2021     2018    2019    2020       2021

       Southern Africa     International               Southern Africa     International          Acute   Non-acute

The international figures presented above exclude Scanmed in 2020 and 2021

Unaudited Group interim results for the six months ended 31 March 2021                                                       7
Operational Review
International
Mark Chapman CEO International

                                 8
ALLIANCE
MEDICAL GROUP
Europe’s leading
independent provider of
imaging services

Unaudited Group interim results for the six months ended 31 March 2021   9

COVID-19 UPDATE | INTERNATIONAL
RESILIENT OPERATIONAL PERFORMANCE
UK scan volumes
▪ AMG continues to see an improvement in demand for its (100 = Jan 2020)
services across almost all territories despite the ongoing 125
pandemic and lockdowns in many regions 100
75
▪ AMG continues to provide COVID-19-related scanning 50
25
solutions for the NHS England (NHSE) and other governments 0
across Europe as it strives to be the key radiology partner of
Jul-20
Apr-20
May-20
Jun-20
Nov-20
Jan-20
Feb-20
Mar-20
Aug-20
Sep-20
Dec-20
Jan-21
Feb-21
Mar-21
Oct-20
choice
CT+MRI PET-CT
▪ UK PET-CT volumes remain higher than the prior year, pre
COVID-19, while diagnostic imaging services (CT and MRI) have European scan volumes
recently moved back in line with pre-COVID-19 levels (100 = Jan 2020)
▪ Ireland has seen a strong performance aided by winning public 125
100
sector contracts 75
▪ Italy impacted by strict lockdowns following 2nd COVID-19 50
25
wave, but has since rebounded to pre-COVID-19 levels -
Jul-20
Apr-20
May-20
Jun-20
Feb-20
Mar-20
Nov-20
Aug-20
Sep-20
Dec-20
Feb-21
Mar-21
Jan-20
Jan-21
Oct-20
▪ c.72% of AMG staff have received their first COVID-19 vaccine
Italy Ireland
Unaudited Group interim results for the six months ended 31 March 2021 10H1-2021 | INTERNATIONAL
STRONG OVERALL PERFORMANCE
% ▪ Underlying revenue and normalised
H1-2021 H1-2020 change EBITDA growth from:
Revenue (£’m) 177.5 151.5 17.2 ▪ Resilience and growth in PET-CT
scan volumes in the UK
Business as usual (£’m) 162.2 158.4 2.4 ▪ Strong growth across Ireland
Estimated COVID-19 impact (£’m) 15.3 (6.9) ▪ Increasing demand for CT imaging
▪ UK mobile market buoyant with strong
Normalised EBITDA* (£’m) 45.1 32.7 37.6 demand outside of NHSE CT contract
▪ Radiopharmacy supply stabilised as a
Business as usual (£’m) 38.3 37.3 2.6
result of Dinnington opening
Estimated COVID-19 impact (£’m) 6.8 (4.6) ▪ Normalised EBITDA margin increased
to 25.4% from 21.6% driven by:
Normalised EBITDA* margin 25.4% 21.6% ▪ Impact of additional revenue from
providing support to national
Normalised EBITDA* margin (excl COVID-19) 23.6% 23.5%
healthcare providers
* Based on management accounts: Constant EUR/GBP currency of 1.2 and excludes impact of long-term incentives
▪ Radiopharmacy supply challenges
resolved in H2-2020
▪ Partly offset by Dinnington costs
which dilute margin by c.1%
Unaudited Group interim results for the six months ended 31 March 2021 11H1-2021 | INTERNATIONAL
ESTIMATED COVID-19 IMPACT
▪ Diagnostic imaging saw a reduction in volumes
throughout H1-2021 in UK and Italy, with
volumes around 90% of pre COVID-19, but
increasing towards the end of H1-2021
▪ Volumes in some regions, most notably within
mobile services in the UK and Ireland, are above
those expected as pent up demand is met
▪ National healthcare support relates to
additional services performed to support public
healthcare providers with COVID-19 response,
including provision of mobile CTs in UK as well
as COVID-19 blood testing in Italy
▪ Other relates to additional costs being incurred,
such as PPE as well as the additional time
required to clean facilities between patients
* Based on management accounts: Constant EUR/GBP currency of 1.2 and excludes impact
Unaudited Group interim results for the six months ended 31 March 2021 of long-term incentives 12H1-2021 | INTERNATIONAL
SUPPORTING PUBLIC HEALTHCARE PROVIDERS
▪ During initial phases of the COVID-19 pandemic we supported ▪ Waiting lists are at all time highs in many countries and are
national healthcare providers by offering additional COVID-19 continuing to grow
support measures: ▪ May lead to further opportunities for AMG to provide
▪ AMG (UK) provided NHSE with a 24/7 mobile CT service additional capacity through mobiles in the short term,
spanning England, incl. Nightingale hospitals while also offering longer-term solutions to help reduce
▪ AMG (Italy) introduced COVID-19 blood testing at a waiting lists
number of centres ▪ It is expected that the COVID-19 support measures will
▪ AMG (Ireland) provided staff to HSE to support be normalised during FY2022. However, offering support
government hospitals measures to deliver immediate pent-up demand may
become business as usual
▪ This early support cemented our relationships with the
national healthcare providers and has led to further
opportunities, including:
▪ Providing significant additional CT capacity in the UK
both through mobile units as well as in PET-CT centres to
assist with meeting pent up demand
▪ Being awarded a contract to provide significant
additional capacity to reduce waiting lists in Ireland
Unaudited Group interim results for the six months ended 31 March 2021 13H1-2021 | INTERNATIONAL
AMG: OVERVIEW
UK Italy Ireland Other geographies
▪ DI static sites 30
Spain Netherlands Germany Finland
▪ PET-CT national ▪ Owned clinics 34
contract sites 37 ▪ Static sites 7 ▪ Operating sites 32
▪ Mobiles 55 ▪ Cyclotron site 1 Estonia Norway Switzerland Austria
▪ Cyclotron sites 5
US Poland
▪ Revenue (%) 48 ▪ Revenue (%) 27 ▪ Revenue (%) 12 ▪ Operating sites (Spain) 11
▪ Revenue (£‘m) 89 ▪ Revenue (£‘m) 50 ▪ Revenue (£‘m) 22 ▪ Mobile and relocatable
buildings (NE) 23
Number of scanners Number of scanners Number of scanners ▪ MRI 12
▪ MRI 64 ▪ MRI 42 ▪ MRI 32 ▪ CT 11
▪ CT 28 ▪ CT 19 ▪ CT 7
▪ PET-CT 8
▪ PET-CT 38 ▪ PET-CT 4 ▪ PET-CT 1
▪ Cyclotron sites 5
▪ Revenue (%) 13
▪ MRI/CT/other (%) 53 ▪ MRI/CT/other (%) 97 ▪ MRI/CT/other (%) 96 ▪ Revenue (£ ‘million) 25
▪ PET-CT/Radiopharmacy (%) 47 ▪ PET-CT/Radiopharmacy (%) 3 ▪ PET-CT (%) 4
▪ Public/Private (%) 91 / 9 ▪ Public/Private (%) 61 / 39 ▪ Public/Private (%) 46 / 54 ▪ MRI/CT/other (%) 23
▪ PET-CT/Radiopharmacy (%) 77
Unaudited Group interim results for the six months ended 31 March 2021 14H1-2021 | INTERNATIONAL
AMG: UK MOLECULAR IMAGING (MI)
▪ PET-CT wave 1 MI as a % of UK revenue
2021 skewed by
54% additional
▪ MI growth underpinned by 10-year PET-CT 52%
revenue through
NHSE CT contract
wave 1 contract 51%
▪ Pricing certainty until December 2025 47%
▪ PET-CT wave 2
▪ Four separate contracts began in 2019 and 2020 H1 2018 H1 2019 H1 2020 H1 2021
▪ Fixed price contracts with a seven-year term
with a three-year renewal option PET-CT Wave 1 volumes
▪ Now contracted to provide c.70% of NHSE 10% CAGR
PET-CT services
▪ PET-CT volumes continued to recover throughout
H1-2021, being 6.1% above prior year and volumes in
March 2021 were 19% above FY2020 monthly average
pre-COVID-19
H1 2018 H1 2019 H1 2020 H1 2021
Unaudited Group interim results for the six months ended 31 March 2021 15H1-2021 | INTERNATIONAL
AMG: UK DIAGNOSTIC IMAGING (DI) Growth in longer-term contracts
Long Term Short Term
▪ Strategic focus continues to be on long-term
partnership solutions with hospital trusts 41 36
53 59
▪ Over the last 12 months we have been reactive to 59 64
47 41
shorter-term opportunities to meet pent up demand
2018 2019 2020 H1 2021
▪ UK DI volumes down 3.5% as lockdowns impacted NHSE Referral to Treatment waiting times (England)
volumes, particularly in central London
5.00 57.0
4.50 52.0
4.00 47.0
▪ NHSE looking to create Community Diagnostic Hubs
Patients (million)
3.50 42.0
No of weeks
3.00
37.0
across England, with private-public-partnerships 2.50
32.0
2.00
encouraged 1.50 27.0
1.00 22.0
0.50 Number of patients waiting (million) Waiting period in weeks 17.0
0.00 12.0
Jul-19
Jul-20
Apr-19
May-19
Jun-19
Nov-19
Apr-20
May-20
Jun-20
Nov-20
Mar-19
Aug-19
Sep-19
Dec-19
Jan-20
Feb-20
Mar-20
Aug-20
Sep-20
Dec-20
Jan-21
Feb-21
Oct-19
Oct-20
Source: www.england.nhs.uk/statistics
Unaudited Group interim results for the six months ended 31 March 2021 16H1-2021 | INTERNATIONAL
AMG: ITALY, IRELAND AND OTHER REGIONS
▪ Revenue up 13.7% as a result of recovery in volumes supplemented by COVID-19 blood testing activity
▪ 8.0% growth in H1-2021 from diagnostic scanning volume vs H1-2020 (20.2% including lab activity)
▪ Focus on continuing scanning volume recovery, driving public volumes and supporting with
Italy supplementary activity (laboratories)
▪ Clinic acquisitions during recent years performing well
▪ Continuing consolidation of activities within regions to reduce cost base
▪ Record volumes seen through H1-2021, up 22.6% vs the prior year across diagnostic imaging
Ireland ▪ Strong demand in private self-pay marketplace during H1-2021 as patients look to bypass waiting lists
▪ New contracts awarded by HSE to reduce waiting lists
▪ Robust radiopharmacy sales throughout period, with little impact from COVID-19 experienced
Other Regions ▪ Strong demand for interim mobile solutions
▪ Acquisition of additional cyclotron business in Germany completed in January 2021
Unaudited Group interim results for the six months ended 31 March 2021 17QUALITY | INTERNATIONAL
CONTINUED FOCUS ON QUALITY OUTCOMES AND PATIENT EXPERIENCE
Year-on-year
Clinical quality indicator H1-2021 H1-2020 H1-2019 Target
trend
UK
Patient experience (satisfied and very satisfied) 96.9% 97.4% 95.6% ➔ >90.0%
Friends and family score 96.0% 96.3% 95.0% ➔ >90.0%
Written patient complaints per 10 000 scans 1.5 2.0 3.3 Operational Review Southern Africa Adam Pyle CEO southern Africa
COVID-19 UPDATE | SOUTHERN AFRICA

COVID-19 PPDs in Life Healthcare facilities                                                                                                                       Life Healthcare COVID-19 admissions in April and May 2021
3 000                                                                                                                                                                                                                                          Total
                                                                                                                                                                         182     186          199         256      325      373      560     admissions
                                                                                                                    Wave 2
                                                                                                                                                                   300
                                                               Wave 1
2 000

                                                                                                                                                                   200

1 000
                                                                                                                                                                   100

    0
                                                                                                                                                                    0
                          Mar-20

                                   Apr-20

                                                                                                           Dec-20
                                            May-20

                                                                       Aug-20

                                                                                                                                       Mar-21

                                                                                                                                                Apr-21

                                                                                                                                                         May-21
                                                     Jun-20

                                                                                         Oct-20
        Jan-20

                                                                                                  Nov-20

                                                                                                                     Jan-21
                 Feb-20

                                                              Jul-20

                                                                                Sep-20

                                                                                                                              Feb-21                                 11-Apr     18-Apr        25-Apr     02-May   09-May   16-May   23-May
                                                                                                                                                                               KZN       FS         WC       EC     NW      MP      GTN

 ▪ 1st COVID-19 wave peak July 2020: 1 658 patients admitted
 ▪ 2nd COVID-19 wave peak January 2021: 2 074 patients admitted
 ▪ >28 000 COVID-19 admissions

Unaudited Group interim results for the six months ended 31 March 2021                                                                                                                                                                          20
COVID-19 UPDATE | SOUTHERN AFRICA
Total PPDS Theatre minutes
200 000 H2-2020 vs H1-2021 H2-2020 vs H1-2021
2 000
150 000
1 500
100 000 1 000
50 000 500
0 -
Apr May Jun Jul Aug Sept Oct Nov Dec Jan Feb Mar Mth 1 Mth 2 Mth 3 Mth 4 Mth 5 Mth 6
COVID-19 PPds Non-COVID-19 PPDs H2 20 H1 21
COVID-19 PPDs
H2-2020 vs H1-2021
70 000
▪ H1-2021 PPDs show a recovery out of 1st COVID-19 wave in
60 000
50 000 October and November
40 000 ▪ Similar PPDs at peak of 1st and 2nd COVID-19 waves
30 000
20 000 ▪ Sharp fall in COVID-19 PPDs in February 2021
10 000 ▪ Good recovery in non-COVID-19 PPDs in March 2021 after the
-
Mth 1 Mth 2 Mth 3 Mth 4 Mth 5 Mth 6
2nd COVID-19 wave peak in January 2021
H2 20 H1 21
Unaudited Group interim results for the six months ended 31 March 2021 21H1-2021 | SOUTHERN AFRICA
BUSINESS OVERVIEW: SEQUENTIAL IMPROVEMENT IN NUMBERS
Overview Revenue mix (R million)
▪ Acute hospital business has shown a solid recovery despite
the severe 2nd COVID-19 wave impact. Learnings from the 1st Four-year CAGR 4.5%
COVID-19 wave and a rebound in elective surgical cases
between waves have benefitted the acute hospital business 657
736
609 565
▪ Consistent stronger growth in complementary and healthcare 568
467
503
689
566
399
services driven by additional service offerings and some 405 513
capacity growth
Occupancies 7 735
8 180 7 785
7 329
6 823 6 641
73%
66% 67%
61%
55% 57% 57%
49% 50%
2017 2018 2019 2020 H2-2020 2021
Acute Complementary Healthcare Services
H1-2020 H2-2020 H1-2021 Four-year
3.4% 8.7% 16.5%
Acute Complementary Combined CAGR
Unaudited Group interim results for the six months ended 31 March 2021 22H1-2021 | SOUTHERN AFRICA
ACUTE HOSPITALS AND COMPLEMENTARY SERVICES
% ▪ Revenue and normalised EBITDA
2021 2020 change trend improving from April 2020
PPD growth (14.9%) 0.2% onwards despite 2nd COVID-19 wave
Revenue (R’m) 9 087 9 402 (3.4) ▪ Growth in revenue per PPD driven
by change in case mix towards
Business as usual (R’m) 9 759 9 514 2.6
higher acuity cases:
Estimated COVID-19 impact (R’m) (672) (112) n/a ▪ 4.1% tariff increase
▪ 8.0% positive case mix shift
Normalised EBITDA (R’m) 1 510 2 236 (32.5)
Operations EBITDA (R’m) 2 019 2 704 (25.3) ▪ COVID-19 effects now in the base
for full 12 months
Business as usual (R’m) 2 862 2 771 3.3
▪ Corporate consists of head office
Estimated COVID-19 impact (R’m) (843) (67) n/a
costs, central support services and
Corporate costs (R’m) (509) (468) 8.8 investment in new projects and
initiatives
Normalised EBITDA margin 16.6% 23.8%
Normalised EBITDA margin (excl COVID-19) 24.1% 24.2%
Unaudited Group interim results for the six months ended 31 March 2021 23H1-2021 | SOUTHERN AFRICA
ACUTE HOSPITALS: OVERVIEW
Daily occupancies Acute PPDs
80% 1 200 ▪ General improvement from H1-2020 to
70% 1 000 -25.9%
H1-2021 after weaker H2-2020
14.5%
800
60%
▪ March 2021 results are a good indicator of
50% 600
business learnings and the business adapting
40% 400
following the onset of COVID-19 in March
30%
200
-
2020
20%
01-Mar-21 01-Apr-21 01-May-21 H1 20 H2 20 H1 21
PPDs March 2021
vs March 2020
Theatre minutes Cathlab cases Revenue + 0.6%
12 000 10 000
SA Operational EBITDA % 22%
10 000 -30.0% 16.7% 8 000 -30.4% 21.0%
8 000 PPDs -11%
6 000
6 000
4 000 Theatre minutes -2.2%
4 000
2 000 2 000 Cathlab cases + 1.7%
- -
Length of stay 3.82
H1 20 H2 20 H1 21 H1 20 H2 20 H1 21
(H1 21: 4.32)
Minutes Cases
Unaudited Group interim results for the six months ended 31 March 2021 24H1-2021 | SOUTHERN AFRICA
COMPLEMENTARY SERVICES: OVERVIEW
Mental Health PPDs Acute Rehabilitation PPDs
80 000 50 000
-30.0% -15.6%
18.2% 2.7%
60 000 40 000
30 000
40 000
20 000
20 000
10 000
- -
H1 20 H2 20 H1 21 H1 20 H2 20 H1 21
PPDs PPDs
Renal Dialysis treatments Oncology treatments
12 500 11.2%
100 000 3.8% 2.0% -8.9%
10 000
80 000
7 500
60 000
40 000 5 000
20 000 2 500
- -
H1 20 H2 20 H1 21 H1 20 H2 20 H1 21
RD Treatments Treatments
Unaudited Group interim results for the six months ended 31 March 2021 25H1-2021 | SOUTHERN AFRICA
HEALTHCARE SERVICES: OVERVIEW
Normalised
EBITDA margin (%)
Life Esidimeni
▪ Stable performance in terms of activities, revenue and 10.8% 9.3% 16.6%
margins despite the 2nd COVID-19 wave +12.0% +71.8%
▪ 516 000 PPDs during the current period
122
736
▪ 10 facilities with 3 163 beds (+28 in this period)
689
Life Employee Health Solutions (Life EHS)
71
64
▪ Revenue growth due to increased services and
657
benefits offered including COVID-19 screening apps,
contact tracing and virtual consultations
H1-2020 H2-2020 H1-2021 H1-2020 H2-2020 H1-2021
▪ 540 000 lives covered across occupational health and
wellness offerings
Revenue (R‘m) Normalised EBITDA (R‘m)
Unaudited Group interim results for the six months ended 31 March 2021 26QUALITY | SOUTHERN AFRICA
CONTINUED FOCUS ON QUALITY OUTCOMES AND PATIENT EXPERIENCE
Patient Adverse Event Rate Employee Safety Measures
2.8 5.0 ▪ Good overall quality performance in COVID-19 context
2.6 4.5 ▪ General trend shows improvement on prior years
▪ Patient experience on par with prior years
2.4 4.0 ▪ Employee safety measures exclude the impact of
3.5
COVID-19. Including COVID-19 the score is 11.6 showing
2.2
the burden placed on healthcare workers by COVID-19
2 3.0 ▪ VAP, CLABSI and CAUTI measures also impacted by
H1 18 H1 19 H1 20 H1 21 H1 18 H1 19 H1 20 H1 21 COVID-19
Per 1 000 PPDs Per 200 000 labour hours
Ventilator-associated Surgical site infections (SSI) Central line-associated Catheter-associated
pneumonia (VAP) 1.2
bloodstream infections urinary tract infections
1.4
(CLABSI) (CAUTI)
1.0 1.0 1.0
0.8 0.8 0.8
0.9
0.6 0.6 0.6
0.4 0.4 0.4 0.4
H1 18 H1 19 H1 20 H1 21 H1 18 H1 19 H1 20 H1 21 H1 18 H1 19 H1 20 H1 21 H1 18 H1 19 H1 20 H1 21
Per 1 000 ventilator days Per 1 000 theatre cases Per 1 000 central lines Per 1 000 catheter days on one line
Unaudited Group interim results for the six months ended 31 March 2021 27Financial Review Pieter van der Westhuizen Group CFO
H1-2021 | RESULTS SUMMARY

          Reported revenue                                                                      NEPS from continuing
           +4.0% to R13.0 billion                                        Cash generated from    operations
                                                                         operations of          -2.4%
          Reported normalised EBITDA                                     R2.3 billion
                                                                                                to 52.8 cps
             -14.3%

                                                                            Strong financial
                  Disposal of Scanmed                                           position             Net debt /
                    net proceeds of                                                              normalised EBITDA*
                      R681 million                                         Undrawn facilities          2.78x
                                                                            of R6.4 billion

               * Calculated in   terms of lender agreements

Unaudited Group interim results for the six months ended 31 March 2021                                                 29
H1-2021 | FINANCIAL STATUTORY RESULTS
GROUP 2021 2020¹ %
R’m R’m change
Continuing operations ▪ H1-2021 significantly impacted by
Revenue 13 004 12 504 4.0 second COVID-19 wave, whereas the
effect of the first wave was only felt
Normalised EBITDA 2 418 2 822 (14.3) for a brief period in H1-2020
Normalised EBITDA margin (%) 18.6 22.6 ▪ Strong revenue growth due to higher
EBITA 1 615 2 108 (23.4) acuity of patients in SA resulting in
higher revenue per PPD, while AMG
Amortisation (266) (302) (11.9)
showed a good recovery in scan
Operating profit 1 349 1 806 (25.3) volumes as well as revenue from
COVID-19 support provided to
Non-operating (expense)/ income (14) 68 100 26 March and presented as a
discontinued operation and the net
Non-controlling interest (34) (155) (78.1) impact for the period was a profit of
Attributable profit 812 781 4.0 R87 million
Unaudited Group interim results for the six months ended 31 March 2021 ¹ Prior period represented to report Scanmed as a discontinued operation 30H1-2021 | UNDERLYING FINANCIAL RESULTS
GROUP 2021 2021 2021 2020 2020 2020 Change in
As COVID-19 Underlying As COVID-19 Underlying underlying
reported impact results Reported impact results results
R’m R’m R’m R’m R’m R’m %
Continuing operations
Revenue 13 004 355 13 359 12 504 245 12 749 4.8
Normalised EBITDA 2 418 703 3 121 2 822 155 2 977 4.8
Normalised EBITDA margin (%) 18.6 23.4 22.6 23.4
EBITA 1 615 703 2 318 2 108 155 2 263 2.4
Amortisation (266) - (266) (302) - (302) (11.9)
Operating profit 1 349 703 2 052 1 806 155 1 961 4.6
Non-operating (expense)/ income (14) - (14) 68 - 68H1-2021 | EARNINGS PER SHARE
GROUP
2021 2020 % change
Weighted average number of shares (million) 1 454 1 455 (0.1)
EPS from continuing and discontinued operations (cents) 55.9 53.7 4.1
HEPS from continuing and discontinued operations (cents) 47.4 53.8 (11.9)
NEPS from continuing and discontinued operations (cents) 55.7 55.0 1.3
EPS from continuing operations (cents) 49.9 55.1 (9.4)
Impairment of investment 0.6 -
Loss on disposal of PPE 0.2 0.1
HEPS from continuing operations (cents) 50.7 55.2 (8.2)
Unwinding of contingent consideration 2.1 2.2
Gain on derecognition of lease asset and liability - (3.7)
Transactions costs - 0.4
NEPS from continuing operations (cents) 52.8 54.1 (2.4)
NEPS from continuing operations excluding amortisation (cents) 67.5 70.4 (4.1)
Unaudited Group interim results for the six months ended 31 March 2021 32H1-2021 | SEGMENTAL FINANCIAL RESULTS
CONTINUING OPERATIONS
Constant 2021 2020 2 500 25%
currency (%) R’m R’m %
EBITDA (R millions)
EBITDA margin (%)
2 000 20%
Revenue 1.6 13 004 12 504 4.0
1 500 15%
Southern Africa (3.4) 9 087 9 402 (3.4)
International 17.2 3 747 2 945 27.2 1 000 10%
Growth initiatives¹ 4.2 170 157 8.3 500 5%
Normalised EBITDA (16.8) 2 418 2 822 (14.3) 0 0%
H1-2018
H2-2018
H1-2019
H2-2019
H1-2020
H2-2020
H1-2021
Southern Africa (33.6) 1 382 2 081 (33.6)
International 38.7 930 625 48.8
2018 2019 2020 2021
Corporate (17.4) 128 155 (17.4)
Southern Africa International
Growth initiatives¹ 44.8 (22) (39) 43.6
Normalised EBITDA margin (%) 18.6% 22.6%
2021 2020
Southern Africa (incl. corporate) 16.6% 23.8% R’m R’m %
Corporate 128 155 (17.4)
Southern Africa (excl. corporate) 15.2% 22.1%
Income 637 623 2.2
International 24.8% 21.2% Costs (509) (468) 8.8
1 Growth initiatives comprise the new outpatient business model, developing the imaging opportunity, investing 1GBP = ZAR20.66 (31 March 2021)
in data analytics and clinical quality products within South Africa and product development internationally. 1GBP = ZAR19.30 (31 March 2020)
Unaudited Group interim results for the six months ended 31 March 2021 33H1-2021 | CONSOLIDATED CONDENSED STATEMENT OF FINANCIAL POSITION
GROUP
Mar 2021 Sep 2020
R’m R’m
Non-current assets 31 581 35 328
Property, plant and equipment 13 643 15 361 ▪ Strong financial position
Goodwill 13 246 14 315 ▪ Available undrawn facilities
Intangible assets 3 259 3 923 of R6.4 billion at 31 March 2021
Other 1 433 1 729
Current assets (excluding cash) 4 613 5 098
Available Bank Facilities
Cash 2 366 2 279
at 31 March 2021
Total assets 38 560 42 705
Total shareholders’ equity 18 225 18 278
Non-current liabilities 11 237 14 535 3 199
Interest-bearing borrowings 9 463 12 034
Other non-current liabilities 1 774 2 501 1 854
1 345 6 386
Current liabilities (excluding interest-bearing borrowings) 6 812 7 712
3 796
Interest-bearing borrowings 2 286 2 180 2 590
Total equity and liabilities 38 560 42 705
SA International Total
Net debt 11 237 14 116 Available Utilised
Net debt to normalised EBITDA¹ 2.78x 2.96x
¹ Calculated in terms of lender agreements
Unaudited Group interim results for the six months ended 31 March 2021 • Amended bank covenant: 4.5x 34
• Original bank covenant: 3.5xH1-2021 | DEBT BREAKDOWN
FY2020
2021 2021 Weighted avg. FY2020 FY2020 Weighted avg. cost
Funding Local currency ’m R’m cost of debt % Local currency ‘m R’m of debt %
(post-tax) (post-tax)
Acquisition funding
ZAR 500 500 4.22 500 500 4.41
PLN - - - 93 407 2.26
GBP 124 2 511 1.80 139 3 037 1.80
Capex funding - ZAR 2 066 2 066 3.58 2 522 2 522 4.04
Poland - PLN - - - 1 3 1.20
AMG - GBP 214 4 374 1.55 222 4 841 1.56
Capitalised finance leases
ZAR 1 054 1 054 7.01 881 881 7.01
PLN - - - 120 528 3.15
GBP 61 1 244 3.22 69 1 495 3.22
General banking facilities - ZAR 1 854 1 854 3.44 2 181 2 181 3.55
13 603 2.84 16 395 2.85
Net debt to normalised EBITDA 2.78x 2.96x
1 GBP:ZAR (spot) 20.42 21.81
Unaudited Group interim results for the six months ended 31 March 2021 35H1-2021 | DEBT REPAYMENT PROFILE
Balance at Maturing in Maturing in Maturing in Maturing in Maturing in
R’m 31 March 2021 FY2021 FY2022 FY2023 FY2024 FY2025 or later
Bank Debt 9 451 (812) (1 884) (3 648) (1) (3 106)
Lease liabilities 2 298 (212) (341) (478) (169) (1 098)
Total debt 11 749 (1 024) (2 225) (4 126) (170) (4 204)
General banking facilities 1 854 (1 854)
Unaudited Group interim results for the six months ended 31 March 2021 36Growth Initiatives
Peter Wharton-Hood Group Chief Executive
37GROWTH INITIATIVES | LIFE MOLECULAR IMAGING (LMI)
NeuraCeqTM
▪ Is an approved amyloid imaging tracer – used in PET-CT scans to help diagnose Alzheimer’s disease
▪ LMI is in discussions on reimbursement and commercial sales contracts
▪ Biogen is co-developing Aducanumab, a drug which may slow the effects of Alzheimer’s disease
▪ Aducanumab is currently being assessed by the FDA – approval / rejection decision moved to 7 June 2021
▪ While LMI’s current focus is on NeuraCeq, LMI also has a pipeline of other new products in various stages of development
Dementia / Neurodegeneration Cardiovascular Oncology
68Ga-RM2/
Neuraceq 18F-PI-2620 18F-DED 18F-aSyn Florbetaben 18F-GP1 18F-FSPG
177Lu-RM2
Amyloid Tau MAO-B / Alpha- Cardiac Thrombo- Prostate and Lung Cancer
plaques deposits Neuro- synuclein amyloidosis embolism breast HCC, IBD
Inflammation cancers
ISS, Phase3 Phase 2 Phase 2 Phase 2
Marketed Phase 2 Pre-clinical Preclinical
(external) (external) (external) (external)
Unaudited Group interim results for the six months ended 31 March 2021 38GROWTH INITIATIVES | SOUTHERN AFRICA
Southern Africa Comparison of scans done by AMG vs SA private sector
▪ Good growth opportunities within the existing market 887k 104k
▪ Focus on execution 734k
▪ Invest in IT infrastructure to enable digital innovation
SA imaging 12k
▪ Continued progress made
▪ Operations expected to commence during FY2021 Total MRI + CT Total PET-CT
AMG SA Private (2018)
Other growth projects
▪ Acute hospitals
▪ Re-initiating select hospital growth projects
▪ Complementary services
▪ Growth opportunities within mental health, acute rehabilitation,
renal dialysis and oncology
▪ Healthcare services
▪ Life Esidimeni – potential growth opportunities being investigated
▪ Life Employee Health Solutions – COVID-19 growth opportunities
Unaudited Group interim results for the six months ended 31 March 2021 39Outlook
Peter Wharton-Hood Group Chief Executive
40FY2021 | VACCINATION UPDATE
▪ UK and Europe making good progress with vaccinating the bulk of their populations
International ▪ AMG hopes to complete vaccination of all its healthcare workers in H2-2021
▪ c.72% of all AMG healthcare workers have received their first vaccine
▪ c.75% of all Life Healthcare employees, doctors, healthcare workers and contractors have
been vaccinated
▪ Business assisting in the countrywide vaccination programme:
▪ 22 hospital vaccination sites, 9 secondary sites and 20 LEHS sites
Province Site Province Site Province Site
WC Life Kingsbury EC Life St Dominic’s GTN Life Flora
Southern Africa Life West Coast Life St Mary’s Life Wilgers
Life Bayview Life Queenstown Life Glynnwood
Life Knysna Life St George’s Life Springs Parklands
EC Life Entabeni Kirkwood Life Suikerbosrand
Life Chatsmed MP Life Cosmos Life Carstenhof
Life Hilton Siyathatuka
Life Empangeni NW Life Peglerae
Unaudited Group interim results for the six months ended 31 March 2021 41FY2021 | OUTLOOK
▪ More ‘normalised’ operating environment due to progress in vaccination efforts
▪ Continued growth in underlying scan volumes across UK, Ireland and Europe in H2-2021
International ▪ Dinnington now operational; will commence with maintenance of Sutton radiopharmacy
▪ Invest in LMI operational capability to drive NeuraCeq sales and manufacturing capability
▪ Capex spend of approximately R0.9 billion for FY2021
▪ Business prepared for 3rd COVID-19 wave and applying lessons learned from prior waves
▪ Expect continued improvement in PPDs and margins in H2-2021 subject to timing and
magnitude of 3rd COVID-19 wave
Southern Africa ▪ Continued focus on business optimisation programmes, executing initial SA imaging
transactions and Acute Hospitals and Complementary Services growth opportunities
▪ Capex spend of approximately R1.2 billion for FY2021
▪ Cautious outlook and continued cash preservation strategies
Group ▪ Will review distribution policy at the end of FY2021
Unaudited Group interim results for the six months ended 31 March 2021 42Questions
43You can also read