HY21 RESULT - 22 February 2021 - Chorus

Page created by Luis Johnson
 
CONTINUE READING
HY21 RESULT - 22 February 2021 - Chorus
HY21 RESULT

22 February 2021
HY21 RESULT - 22 February 2021 - Chorus
Disclaimer
This presentation:
• Is provided for general information purposes and does not constitute investment advice or an offer of or invitation to purchase Chorus
securities.
• Includes forward-looking statements. These statements are not guarantees or predictions of future performance. They involve known
and unknown risks, uncertainties and other factors, many of which are beyond Chorus’ control, and which may cause actual results to
differ materially from those contained in this presentation.
• Includes statements relating to past performance which should not be regarded as reliable indicators of future performance.
• Is current at the date of this presentation, unless otherwise stated. Except as required by law or the NZX Main Board and ASX listing
rules, Chorus is not under any obligation to update this presentation, whether as a result of new information, future events or otherwise.
• Should be read in conjunction with Chorus’ audited consolidated financial statements for the year to 30 June 2020 and NZX and ASX
market releases.
• Includes non-GAAP financial measures such as "EBITDA”. These measures do not have a standardised meaning prescribed by GAAP and
therefore may not be comparable to similar financial information presented by other entities. They should not be used in substitution for,
or isolation of, Chorus' audited consolidated financial statements. We monitor EBITDA as a key performance indicator and we believe it
assists investors in assessing the performance of the core operations of our business.
• Has been prepared with due care and attention. However, Chorus and its directors and employees accept no liability for any errors or
omissions.
• Contains information from third parties Chorus believes reliable. However, no representations or warranties (express or implied) are
made as to the accuracy or completeness of such information.

   2   22 February 2021                            H1 FY21 RESULT PRESENTATION
HY21 RESULT - 22 February 2021 - Chorus
Agenda
    JB Rousselot, CEO    > HY21 overview                                4
                         > UFB rollout and uptake                       5-7
                         > COVID-19 impacts and connection trends       8-10
    David Collins, CFO   > Financial results                            11-14
                         > Maintenance and capex                        15-19
                         > FY21 guidance, capital management and debt   20-23
                         > Regulatory update                            24-26
    JB Rousselot, CEO    > A gigabit head start                         27-31
                         > Strategic focus                              32-38
                         Appendices
                             ▪ A: Connections data                      39
                             ▪ B: FY22 Capital Allocation framework     40
                             ▪ C: Our strategic focus                   41

3   22 February 2021                H1 FY21 RESULT PRESENTATION
HY21 RESULT - 22 February 2021 - Chorus
HY21 overview

4   22 February 2021   H1 FY21 RESULT PRESENTATION
HY21 RESULT - 22 February 2021 - Chorus
UFB uptake reaches 63%
                                                                                                                                                    Uptake

                                                                                                         Fibre now 79% of Chorus broadband
> UFB uptake increased from 60% to 63% within                                                            connections in planned UFB zone
     completed footprint in HY21*
     ▪ uptake in UFB1 areas grew from 63% to 66%                                           No. of
                                                                                           connections
     ▪ uptake in UFB2 areas grew from 37% to 39%
                                                                                             1,000,000
     ▪ 783,000 connections (FY20: 725,000) now within
       completed footprint, including business premium                                         900,000
       connections                                                                             800,000
     ▪ 1,246,000 customers able to connect (FY20: 1,209,000)                                   700,000
     ▪ 966,000 premises passed** out of 1,054,000 target =                                     600,000
        UFB rollout 92% complete                                                               500,000
     (note: data includes some UFB2 areas that have been partially built, but not
     yet submitted for Crown sign-off)                                                         400,000
                                                                                               300,000
> 90,000 fibre installations completed                                                         200,000
  ▪ customer satisfaction steady at 8.2                                                        100,000
  ▪ WIP reduced to 13k from 16k (FY20)                                                                   0
  ▪ field crews increased from ~600 (FY20) to 689                                                            Dec-19   Mar-20   Jun-20   Sep-20   Dec-20

  * includes ~3k free education connections                                                                       ADSL    VDSL     Fibre
  **under the UFB contract, a multi-dwelling unit or single office block is one premises

 5    22 February 2021                                          H1 FY21 RESULT PRESENTATION
HY21 RESULT - 22 February 2021 - Chorus
UFB1 uptake: 66%

                  80.00%
                                       Dec-19   Mar-20   Jun-20   Sep-20   Dec-20

                  70.00%
                                                                                    Average uptake

                  60.00%

                  50.00%
% uptake
relative to
capable           40.00%
addresses

                  30.00%

                  20.00%

                  10.00%

                   0.00%

      6       22 February 2021        H1 FY21 RESULT PRESENTATION
HY21 RESULT - 22 February 2021 - Chorus
1Gbps uptake grew by 21k connections
              Total mass market fibre uptake by plan type
        100     Business/Education plans

                      1Gbps           $60 p.m.          $56 p.m.
         90                                            from 1 July

                     200Mbps
                                      $55 p.m.                                $56.38 p.m.
                                                                                                     > 62,000 mass market fibre connections
         80
                                                                               from 1 Oct               added
         70                                                                                             ▪ 1Gbps connections grew from 115k to 136k
                                                                                                          and are now 17% of GPON connections
                       100Mbps                                                $47.15 p.m.
         60                            $46 p.m.
                                                                               from 1 Oct               ▪ small business connections grew from 3k to
% of                                                                                                      11k as copper/fibre consumers recognise
         50
plans                                                                                                     benefits of new $52 product with business
         40                                                                                               service levels

         30
                                                                                                     > copper broadband CPI applied from
         20
                                                                                                        mid December
                                                                                                        ▪ $42.35 increased to $42.97 for ADSL and
         10
                        50Mbps         $42.50 p.m.                            $43.56 p.m.
                                                                                                          VDSL connections
                                                                               from 1 Oct
         0
         Dec-19                 Mar-20               Jun-20          Sep-20                 Dec-20

    7     22 February 2021                                           H1 FY21 RESULT PRESENTATION
HY21 RESULT - 22 February 2021 - Chorus
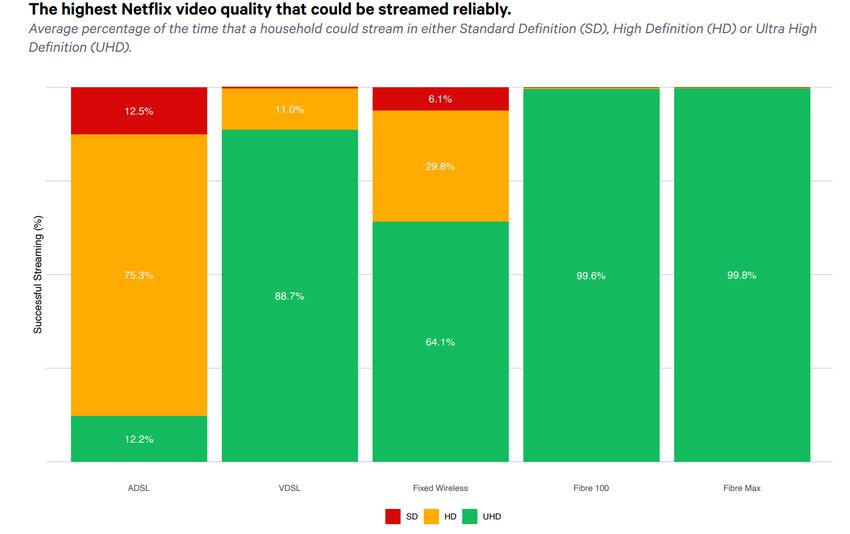
COVID impacts linger

    Population growth tailwind subdued by drop in net migration

                                                                  Source: Stats NZ

8   22 February 2021           H1 FY21 RESULT PRESENTATION
HY21 RESULT - 22 February 2021 - Chorus
Residential property development remains strong
      > Build completed for 12k properties in HY21
      > 27k greenfield properties under contract (FY20: 25k)

                                                                        Source: Stats NZ

9   22 February 2021                      H1 FY21 RESULT PRESENTATION
HY21 RESULT - 22 February 2021 - Chorus
Connection changes by Zone (indicative)

>        Chorus UFB zone: reduction in broadband reflects combined                        Change in connections (‘000s) by zone**
         effects of university holiday disconnections, COVID-19 effect on
         net migration and inertia selling campaigns by fixed wireless                           -15            -5                         5   15
         providers
                                                                                     Q2   FY20           -2     -7
                                                                                                                                                    LFC
>        LFC zone: disconnections consistent with pre-COVID levels                   Q3   FY20          -2     -8                                   Zone
                                                                                     Q4   FY20               -2 -4
                                                                                     Q1   FY21         -2     -9
>         N/C
         Non-UFB    zone: fibre connection growth from 20k to 24k                    Q2   FY21            -3     -6
         helping offset rural wireless competition
                                                                                     Q2   FY20                              -2                      Non-
                                                                                     Q3   FY20                               -11                    UFB
                                                                                     Q4   FY20                               -1
                              Chorus UFB          Non-UFB              Local Fibre   Q1   FY21                           -1 -2                      Zone
                              zone*               zone                 Company       Q2   FY21                               -1
                                                                       UFB zone
                                                                                     Q2   FY20                      -8                 7
Total connections at              1,076,000             191,000             88,000   Q3   FY20                                                      Chorus
                                                                                                                         -5        3
31 December**                                                                        Q4   FY20                           -5            8            UFB Zone
Broadband connections                 974,000            153,000            56,000   Q1   FY21                 -8         -2
                                                                                     Q2   FY21            -7             -4
Copper (no broadband)                 102,000             38,000            32,000
connections
                                                                                                        Broadband connections
 * Includes planned Chorus UFB1, 2 and 2+ coverage
 **Excludes 14k fibre premium and data services (copper) connections
                                                                                                        Copper (no broadband) connections

    10     22 February 2021                                            H1 FY21 RESULT PRESENTATION
Financial performance
                       David Collins, Chief Financial Officer

22 February 2021
Income statement

                                            H1      H2      H1
                                           FY21    FY20    FY20
                                            $m      $m      $m
 Operating revenue                         473      476     483     >   Growing fibre uptake, offset by COVID impact

 Operating expenses                        (150)   (160)   (151)    >   Cost base trending down, noting weather impact
                                                                        on maintenance
 Earnings before interest, tax,            323     316      332
 depreciation and amortisation
 (EBITDA)
 Depreciation and amortisation             (209)   (204)   (198)    >   Increasing with investment in fibre

 Earnings before interest and income tax   114      112     134
 Net interest expense                      (77)    (85)     (88)    >   GBP bond repaid April 2020; weighted average
                                                                        interest rate on debt reduced from 5.2% to 4.0%
 Net earnings before income tax             37      27       46
 Income tax expense                        (13)     (6)     (15)    >   H2 FY20 included one-off benefit from
                                                                        reintroduction of tax depreciation on buildings
 Net earnings for the year                  24      21      31

12   22 February 2021                 H1 FY21 RESULT PRESENTATION
Revenue
                             H1     H2        H1
                            FY21   FY20      FY20
                             $m     $m        $m
     Fibre broadband        228    206        187       >   Growing fibre uptake and ARPU: Dec FY21 $49.66 vs
     (GPON)                                                 June FY20 $48.42

     Fibre premium (P2P)     34     37         36       >   Migration from legacy services to lower cost inputs

     Copper based           110    127        144
     broadband                                              Copper revenues declining as customers migrate to
                                                            Chorus fibre or competing fibre/wireless networks
     Copper based voice      36     40         42
     Data services copper    5      8          8
     Field services          31     32         33
     Value added network     15     13         16
     services
     Infrastructure          12     12         12
     Other                   2      1          5        >   H1 FY20 included $3m legal settlement

     Total                  473    476        483

13     22 February 2021            H1 FY21 RESULT PRESENTATION
Expenses
                            H1     H2          H1
                           FY21   FY20        FY20
                            $m     $m          $m
Labour                      38     41           39       >   H1 FY21 redundancy costs ~$1m

Network maintenance         34     32           34       >   Fault volumes reduced but more weather-related network
                                                             events in HY21 and average cost per fault increased
Other network costs         13     17           12       >   H2 FY20 included $5m COVID-19 serco support payments

IT                          25     24           23       >   Included $2m decommissioning of legacy copper
                                                             network equipment
Rent, rates and property    12     14           11
maintenance
Electricity                 7       7           8
Provisioning                1       3           2
Insurance                   2       1           2
Consultants                 2       4           5        >   Timing of external advice on new regulatory
                                                             framework
Regulatory levies           4       3           4
Other                       12     16           11
Total                      150    160          151

14   22 February 2021             H1 FY21 RESULT PRESENTATION
Reactive maintenance: Chorus network
      Key drivers for $31m spend                                                                           Reactive spend by type
                                                                                            20
     ▪ fault volumes continued to reduce, but weather related events                        15
        and third party damage increased the average cost per fault
                                                                                            10
                                                                                       $m
                                                                                             5
     ▪ overall trend of reducing copper fault costs and increasing fibre
        costs was consistent with prior periods, noting:                                     0
                                                                                                       Fibre          Copper - fixed   Copper -
        • H2 FY20 had reduced maintenance activity due to COVID-19                                                                     variable
        • H1 FY20 had an abnormal step down in faults due to
                                                                                                 H1 FY19    H2 FY19    H1 FY20    H2 FY20   H1 FY21
           favourably dry weather conditions

     ▪ long run annual saving from full copper to fibre migration in                               Copper - reactive spend by area
        Chorus UFB areas estimated at ~$10m p.a for fixed fault costs                       15

     Note:                                                                             $m 10
     ▪ reactive maintenance excludes spend on proactive maintenance and
       customer networks (i.e. premises wiring, no fault found, cancellations)               5
     ▪ ‘fixed’ faults: occur in parts of the network that affect multiple customers
       (e.g. cable between exchange and cabinet)                                             0
     ▪ ‘variable’ faults: only affect one customer (e.g. cable on customer property)               Chorus UFB     Rural (Non UFB)       LFC UFB

15     22 February 2021                                H1 FY21 RESULT PRESENTATION
HY21 gross capex: $353 million
     Fibre capex was 85% of spend
     Fibre capex                        H1 FY21   H2 FY20   H1 FY20
                                          $m        $m        $m

     UFB communal                            86        70       100 >   42k UFB2 premises ready to connect; 34k handed
                                                                        over for testing
     Fibre connections & layer 2            146       127       155 >   90,000 installations (UFB1:70,000; UFB2:20,000)

     Fibre products & systems                 8         7         7
     Other fibre connections & growth        47        34        28 >   West Coast fibre rollout commenced HY21; strong
                                                                        New Property development growth
     Customer retention costs                13        10        10 >   Fibre incentive campaigns increased

     Subtotal                              300        248       300

16   22 February 2021                     H1 FY21 RESULT PRESENTATION
Capex: Fibre connections & layer 2
     Connections and Layer 2 capex of $146m
       ▪    Average cost per UFB1 premises connected: $1,062* vs $1,025 - $1,175 guidance
       ▪    Average cost per UFB2 premises connected: $1,226* vs $1,200 - $1,350 guidance
           * excludes layer 2 and includes standard installations, some non-standard single dwellings and service desk costs

     Fibre connections & layer 2 capex                                             H1 FY21                H2 FY20                H1 FY20

     Layer 2                                                                          $17m                   $19m                  $12m
     Premium business fibre connections                                               $3m                   $4m                  $6m
                                                                                 700 connections       700 connections     1,000 connections
     Single dwelling units and apartments                                            $102m                  $75m                    $98m
                                                                                 90k connections       68k connections         99k connections

     Backbone build: multi-dwelling units and rights of way                           $24m                   $29m                   $39m
                                                                                 3.5k completed         4.5k completed         6.5k completed
     TOTAL SPEND                                                                     $146m                  $127m                 $155m

17   22 February 2021                               H1 FY21 RESULT PRESENTATION
Capex: Copper and Common
     Copper capex                      H1 FY21   H2 FY20   H1 FY20
                                         $m        $m        $m
     Network sustain                     14        16         15
     Copper connections                   1         0         1
     Copper layer 2                       2         4         3
     Product                              0         0         0
     Customer retention costs             6         6         10
     Subtotal                            23        26        29         >   continuing to trend down as connections reduce

     Common capex                      H1 FY21   H2 FY20   H1 FY20
                                         $m        $m        $m
     Information technology              22        23        20         >   lifecycle upgrades for IT infrastructure

     Building & engineering services      8         9         8

     Other                                0         0         0
     Subtotal                            30        32        28

18   22 February 2021                     H1 FY21 RESULT PRESENTATION
Fibre capex: sustaining                H1 FY21       FY20 $m
                                                                   Layer 2                                        17             31

     Sustaining capex                                              Fibre products & systems
                                                                   Other fibre connections
                                                                                                                   8
                                                                                                                  10
                                                                                                                                 14
                                                                                                                                 20
        $93m of H1 FY21 capex was sustaining                       Customer retention costs*                       5              7

     > Sustaining capex is defined as total capex excluding:       Subtotal                                      40             72
       ▪ UFB communal & future footprint expansion                 Copper capex: sustaining               H1 FY21       FY20 $m
       ▪ Fibre connections & greenfield growth
                                                                   Network sustain                                14             31
       ▪ Customer retention spend (incentives related)
     > Exclusions within H1 FY21 Capex of $353m were:              Copper connections                              1              1
       ▪ UFB communal                            $86m              Copper layer 2                                  2              7
       ▪ Footprint expansion (West Coast)        $14m              Customer retention costs*                       6             15
       ▪ Fibre connections                       $129m
                                                                   Subtotal                                       23            54
       ▪ Greenfield growth                       $23m
       ▪ Customer retention                      $8m               Common capex: sustaining               H1 FY21       FY20 $m
         Exclusions sub total                   $260m              Information technology                         23             43
         H1 FY21 Sustaining Capex               $93m
                                                                   Building & engineering                          7             17
                                                                   services
     > Fibre sustaining capex is expected to increase over time
                                                                   Subtotal                                      30             60
        as the asset ages
                                                                            *Relates to provisioning, systems and service desk costs

19    22 February 2021                        H1 FY21 RESULT PRESENTATION
FY21 guidance summary

     EBITDA: $640m to $660m (no change –                                Gross capex: $670m to $700m
     tracking towards lower half)
                                                                        (increased from $630m to $670m)
     ▪    subject to no material changes in expected
          regulatory and competitive outlook                            > Fibre $560m to $590m
     ▪    includes ~$10m allowance for ongoing COVID-19                   (increased from $530m to $560m)
          impact and broader economic uncertainty
                                                                          ▪ greenfields demand ahead of expectations
     CAPEX (unchanged components)
                                                                          ▪ $285m-$305m fibre connections & layer 2
     ▪    $125m-$145m spend for UFB2 communal:
                                                                            (increased from $275m-$295m)
          tracking to top end as rollout ahead of schedule
                                                                               based on mass market 170,000–190,000 fibre
     ▪    UFB1 CPPC $1,025 - $1,175*
                                                                               connections, 7,000 backbone builds and including
     ▪    UFB2 CPPC $1,200 - $1,350*                                           service desk costs
          *excluding layer 2 and including standard installations and
          some non-standard single dwellings and service desk costs
                                                                               Note: prior guidance based on mass market
     ▪ Copper $35m-$55m (no change)                                            145,000 – 165,000 fibre connections, 9,000
     ▪ Common $50m-$65m (no change)                                            backbone builds and including service desk costs

20       22 February 2021                               H1 FY21 RESULT PRESENTATION
FY21 interim dividend                                     FY21 dividend guidance

     10.5cps, fully imputed                                      25cps, subject to no material adverse
                                                                 changes in circumstances or outlook
     ▪ supplementary dividend of 1.85cps payable to non-
         resident shareholders                              > from FY22 we will transition to a dividend policy based on a
     ▪   record date: 16 March 2021                           pay-out range of free cash flow
     ▪   payment date: 13 April 2021                          ▪ free cash flow will be defined as net cash flows from
                                                                  operating activities minus sustaining capex
     ▪   Dividend Reinvestment Plan applies with 2%
         discount to prevailing market price; open to New   > dividend levels through the transition period will reflect the
         Zealand and Australian resident shareholders         following considerations:
                                                               • maintenance of a BBB credit rating
                                                               • UFB related capital expenditure remains elevated
                                                                   initially, reducing as the UFB rollout winds down (ends
                                                                   Dec 2022)
                                                               • fibre connection spend tapers off gradually, subject to
                                                                   ongoing demand and timing of copper migration in
                                                                   selected areas
                                                               • copper capex is declining as connections reduce

21   22 February 2021                         H1 FY21 RESULT PRESENTATION
Net debt/EBITDA

                                 As at                 > Higher H1 FY21 gearing, driven mostly by UFB2 rollout
                              31 Dec 2020                  tracking ahead of schedule vs CIP funding regime;
                                  $m                       increased investment in installations and one-off impact
Borrowings                        2,599                    of RSP payment timing
                                                       >   No change to ratings agency thresholds:
+ PV of CIP debt                     191
securities (senior)                                        ▪ S&P 4.25x on a sustained basis
                                                           ▪ Moody’s intend to review 4.2x threshold once there
+ Net leases payable                 271
                                                              is further clarity on regulatory framework and portion
Sub total                         3,061                       of revenue regulated
- Cash                               268               >   Financial covenants require senior debt ratio to be no
                                                           greater than 4.75 times
Total net debt                    2,793
Net debt/EBITDA*                4.37 times             > The Board considers that a ‘BBB’ credit rating or
                                                           equivalent credit rating is appropriate for a company
*Based on S&P and bank covenant methodologies              such as Chorus.

22   22 February 2021                           H1 FY21 RESULT PRESENTATION
Crown financing and debt profile
                                                         > At 31 December, debt of $2,599m comprised:
     > up to $1.33 billion CIP financing                    ▪ Long term bank facilities of $350m (undrawn)
          available by 2023 (57:43 equity/debt)             ▪ NZ bonds: $1,300m
     >    $1,109m drawn at 31 Dec 2020                      ▪ Euro Medium Term Notes $1,299m (NZ$ equivalent at hedged rates)
                                                                                                   CIP debt securities available
                       drawn   undrawn
                                                             800                                   Face value of CIP debt securities issued
                                                             700
                                                                                                   EUR EMTN
                                                             600
                                                                                                   NZ Bond
                                                             500
                                                       NZ
NZ                                                           400         785
                                                       $M
$M                               120                                                                       20
          462          462                                   300
                                                                                      514         500      86                          46
                                                             200   400                                                   39
                                                             100                            200           200                         163
                                 185                                             85                                     128
                                           105                 0

       UFB1        UFB1 DEBT   UFB2/2+   UFB2/2+
      EQUITY                    EQUITY    DEBT

     23    22 February 2021                        H1 FY21 RESULT PRESENTATION
Chorus regulated fibre revenues

     1200                                                                 100            > Based on input methodologies criteria, we estimate
                                                                          90                  regulated fibre revenue (PQ FFLAS) of:
     1000                                                                                     ▪ ~$480m in FY20
                                                           Commerce       80
                                                           Commission                         ▪ ~$270m in H1 FY21
                                                                          70
      800                                                  to set MAR                    >    The chart shows Regulated fibre revenues vs Other
                                                                          60                  revenue for calendar years 2012-2020
                                                                             %
$m    600                                                                 50 uptake           ▪ excludes capital contributions (e.g. greenfields) and
                                                                                                 FFLAS in LFC areas
                                                                          40
      400                                                                                >    2021-2024 regulated fibre revenues reflect current Board
                                                                          30                  approved business plan, based on fibre uptake trend and
                                                                          20                  target of 1m connections in 2022
      200
                                                                          10             >    Chorus should under-earn the MAR in first regulatory
                                                                                              period (RP1) given:
          0                                                               0
                                                                                              ▪ incentive to invest in better consumer outcomes
                                                                                              ▪ ~70% of connections are on the 100Mbps anchor
                                                                                                 product, with pricing capped at CPI over RP1
                            Other Chorus revenue                                              ▪ fibre uptake is expected to still be growing
                            Regulated fibre revenue (estimated)                               ▪ the starting RAB will include a significant financial loss
                            Fibre uptake (June)                                                  asset

          Note: Assessment of FFLAS revenue is based on final Input Methodologies. Subject to completion of Commerce Commission process.

     24       22 February 2021                               H1 FY21 RESULT PRESENTATION
Input methodologies key parameters
                            Pre January 2022 period (financial loss           First regulatory period
                            asset)
Risk free rate              5-year rate, 1 month average, calculated as at    3-year rate, 3 months average,
                            middle of year, or mid each part year for 2012    calculated as at 1 June 2021
                            and 2021
TAMRP                       7% until Oct 2020 then 7.5%                       7.5%

Debt risk premium           BBB, 7-year term, 1 month average                 BBB, 5-year term, 5-year trailing
                                                                              average
Leverage                    29%                                               29%

Debt issuance cost          0.14%                                             0.33%

Asset beta                  0.5                                               0.5

WACC uplift                 none – 50th percentile                            none – 50th percentile

Asymmetric stranding risk   no allowance                                      10 basis points

Crown financing             Financing rate reflecting Chorus’ actual senior   Financing rate reflecting Chorus’
                            debt/subordinated debt/equity mix                 actual senior debt/subordinated
                                                                              debt/equity mix

25   17 December 2020                 PRICE-QUALITY EXPENDITURE PROPOSAL
Regulatory timetable

                             Source: Commerce Commission

26   22 February 2021   H1 FY21 RESULT PRESENTATION
A gigabit head start
                              JB Rousselot, Chief Executive Officer

H1 FY21 RESULT PRESENTATION
22 February 2021
28   22 February 2021   H1 FY21 RESULT PRESENTATION
Monthly average data usage on fibre 460 gigabytes
         Monthly average data usage per connection on
         our network*
                                                                                > monthly average data usage per connection on our
         500                                                                       network grew to 390GB in December, up from 380GB
                                                                          460      (Sept)
         450
                                                                                   ▪ 460GB on fibre (Sept:456GB)
         400                                                              390
                                                                                   ▪ 241GB on copper (Sept:236GB)
         350
         300                                                                    > Average peak throughput on our network at peak time
Data
         250                                                              241      (~9pm) was 2.44Tbps, up from 1.96Tbps in December
usage
                                                                                   2019
(GB)     200
         150
         100
         50
                                          Copper       Fibre        Average
          0
                Dec-14

                Dec-15

                Dec-16

                Dec-17

                Dec-18

                Dec-19
                Sep-15

                Sep-16

                Sep-17

                Sep-18

                Sep-19

               Sep-20*
               Jun-20*
                Jun-18

               Dec 20*
                Mar-15

                Mar-16

                Mar-17

                Mar-18

                Mar-19

                Mar-20
                Jun-15

                Jun-16

                Jun-17

                Jun-19

               * includes upstream traffic from June 2020 onwards

    29   22 February 2021                                 H1 FY21 RESULT PRESENTATION
Commission reporting shows fixed line reliability
     Fibre is unmatched for UHD streaming and lowest latency

Source: Commerce Commission, Measuring Broadband New Zealand, Spring Report (December 2020)

30   22 February 2021                                  H1 FY21 RESULT PRESENTATION
Commission report: VDSL outperforms fixed wireless
 ▪ The Commerce Commission’s Measuring Broadband New Zealand, Spring Report (December 2020) showed copper VDSL
     services outperformed fixed wireless on key measures such as download speeds and latency

31   22 February 2021                       H1 FY21 RESULT PRESENTATION
1. Winning in our core fibre business
                                 Managed migration programme lifting uptake

             ▪ migration programme has moved from                Managed migration: installations vs activations
                RSP-led campaigns initially to Chorus    35000
                door knocking and targeted incentives
                                                         30000                 Service activation: from copper
                                                                               Service activation: from offnet
             ▪ ~30% of programme generated               25000                 Fibre installations
                activations have come from offnet
                addresses                                20000

             ▪ 5k offnet activations through migration   15000

                programme in H1
                                                         10000

             ▪ continuing to see ~50% of managed          5000
                migration ONT installations activate
                within 6 months                              0
                                                                 H2 FY18    H1 FY19         H2 FY19        H1 FY20   H2 FY20   H1 FY21

32   22 February 2021                         H1 FY21 RESULT PRESENTATION
Diversifying retail market and products

     Smaller RSPs gaining greater share in 1 gigabit

           All Chorus fibre (GPON)                     1 gigabit

      27%
                                                                                    ▪ Flip (Vocus) $15 per week ‘budget’
               23%                               36%                                    50Mbps fibre, unlimited data
                                                       31%
                                                             Dec 2019    Dec 2020
                                                                                    ▪   2degrees Work from Home Fibre
Dec 2020     Dec 2019               Top 3 RSPs
                                                                                    ▪   Vodafone wall-to-wall Wifi
                                    Other RSPs                 69%
                        77%                                             64%         ▪   Sky TV to enter broadband market

                              73%

33   22 February 2021                            H1 FY21 RESULT PRESENTATION
Continuing to refine our active wholesaler focus

 > migration and winback incentives
   ▪ upweighting retailer incentives based on customer segment, plan and
          volumes (up to $300 for targeted copper ‘late adopters’; up to $600
          for winback of offnet connections)

 > localised marketing campaigns
   ▪ targeted activity and advertising in UFB1 areas with lower uptake

 > new Basic Fibre offer
   ▪ one-off $104 credit to RSPs that offer 50Mbps connections at a stand
          alone retail price point of $60 or less (incl GST)
      ▪   must be a new fibre connection

 > Tenancy law change
   ▪ landlords must agree to free fibre installation, unless specific
          exemptions apply

34   22 February 2021                           H1 FY21 RESULT PRESENTATION
2. Grow new revenues

35   22 February 2021          H1 FY21 RESULT PRESENTATION
3. Optimise non-fibre assets

         > Copper Withdrawal Code enables initial trials of copper migrations to begin from September
           ▪ initial trial migration to focus on only 30 cabinets with ~250 customers
           ▪ subject to initial results, trial to be extended to ~400 cabinets within 12 months
           ▪ trials affect less than 1% of remaining copper customers

         > Programme to reduce network footprint
           ▪ 7 more property/lease sites exited (FY20: 20 sites)
           ▪ reviewing radio network site requirements
           ▪ rationalising network equipment in Spark exchanges (leased space)

36   22 February 2021                      H1 FY21 RESULT PRESENTATION
4. Develop long term future of the business
                             Defining our new operating model
                                                                            UFB rollout (premises) and
                                                                                fibre installations
        > Rapidly moving from build to operate                        200,000
          ▪ UFB rollout volume reducing quickly                       180,000
          ▪ fibre installation activity still high but will reduce    160,000
          ▪ fault handling increasingly automated as RSPs utilise     140,000
                new digital channels for fibre                        120,000
                                                                      100,000
            ▪   regulatory outcomes will also shape business
                                                                       80,000
                                                                       60,000
        > Changes already underway                                     40,000
          ▪ recruitment freeze in place                                20,000
          ▪ smaller Executive team                                          0
                                                                                 FY19      FY20    FY21   FY22    FY23
          ▪ employees working remotely 2-3 days on average
          ▪ Technology and other teams adopting Agile practices                 Ready to connect    To be completed
                                                                                Installations

37   22 February 2021                         H1 FY21 RESULT PRESENTATION
Realising New Zealand’s gigabit advantage

38   22 February 2021          H1 FY21 RESULT PRESENTATION
Appendix A: Connection and market trends
                             31 Dec   31 March     30 June     30 Sept      31 Dec
                              2019        2020       2020        2020        2020
                                                                                      1,400,000    Baseband copper

Unbundled copper             18,000     17,000      15,000      14,000      13,000                 Unbundled copper
(no broadband)                                                                        1,200,000

Baseband copper             192,000    185,000     179,000     169,000     159,000
(no broadband)                                                                                     Copper ADSL
                                                                                      1,000,000
Copper ADSL                 283,000    261,000     245,000     218,000     197,000
(includes naked)
                                                                                       800,000      VDSL
VDSL                        242,000    228,000     221,000     202,000     184,000
(includes naked)
                                                                                       600,000
Fibre broadband             681,000    713,000     740,000     773,000     802,000
(GPON)

Data services                 4,000      4,000       4,000       3,000       3,000     400,000
(copper)                                                                                            Fibre (GPON)

Fibre premium                12,000     11,000      11,000      11,000      11,000     200,000
(P2P)

Total connections         1,432,000   1,419,000   1,415,000   1,390,000   1,369,000
                                                                                              0     Business premium
                                                                                            31-Dec-19       31-Mar-20   30-Jun-20   30-Sep-20   31-Dec-20
        > 1,183,000 broadband connections comprises:
          ▪ 802,000 fibre (GPON) connections                              Note: 11,000 free education connections are excluded from this data
          ▪ 381,000 VDSL/ADSL (copper) connections

           39      22 February 2021                           H1 FY21 RESULT PRESENTATION
Appendix B: FY22 capital allocation framework

  Net cash flow from operating activities                         > Transition from FY22 to dividend distribution based on pay-
                                                                    out range of free cash flow to reflect:
                                                                      • a focus on providing shareholders with dividend
 Sustaining capital                                                       predictability, stability and sustainable growth
                                      Dividend                        • comparable Australasian infrastructure and utility-like
   expenditure
                                     distribution                         businesses that pay out the majority of FCF
                                                                      • robust management of sustaining capital expenditure
                                                                      • transition period based on completion of UFB2 communal by
                           Surplus                                        December 2022 and ongoing tapering of connection capex
                           capital                                > Surplus capital after dividend to be allocated based on
                                                                    maximising shareholder value, and guided by:
                                                                    ▪ debt levels consistent with existing credit rating, noting potential
                                                                      re-gearing from any relaxation of rating thresholds
                                                                    ▪ discretionary capex will only be pursued where:
                                                                      • greater shareholder value is created compared to share buy
   Share buy            Additional        Discretionary
                                                                          backs and/or additional dividends; and
     backs              dividends         capex *
                                                                      • regulatory incentives are appropriate (e.g. regulatory WACC
                                                                          vs Chorus WACC)
* Examples include fibre footprint expansion, greenfield connections & customer retention spend

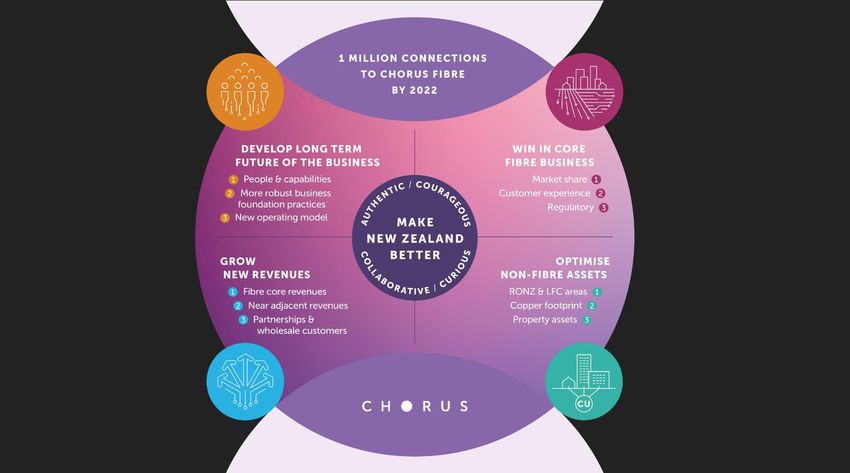
   40   22 February 2021                               H1 FY21 RESULT PRESENTATION
Our strategic
focus in FY21

 41   22 February 2021
You can also read